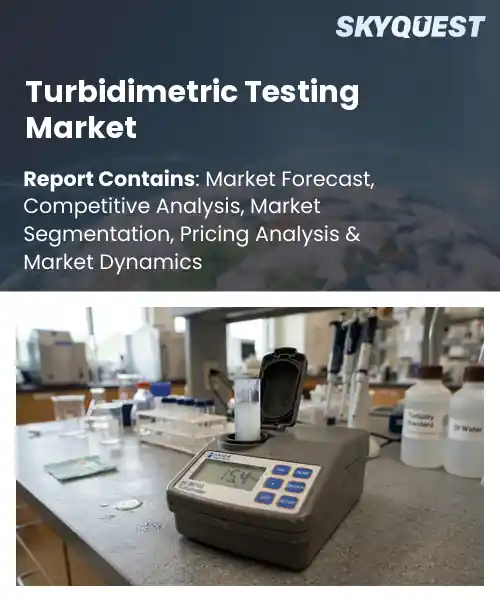
Turbidimetric Testing Market
Report ID: SQMIG35J2768
Report ID: SQMIG35J2768
[email protected]
USA +1 351-333-4748
Report ID:
SQMIG35J2768 |
Region:
Global |
Published Date: August, 2026
Pages:
157
|Tables:
145
|Figures:
78


Global Turbidimetric Testing Market size was valued at USD 642.5 Million in 2024 and is poised to grow from USD 685.55 Million in 2025 to USD 1151.74 Million by 2033, growing at a CAGR of 6.7% during the forecast period (2026-2033).
The turbidimetric testing market revolves around instruments that measure light scattering to quantify suspended particles in liquids, a capability essential for water quality, food safety, and pharmaceutical production. Its relevance stems from regulatory mandates such as the EPA Clean Water Act and FDA guidelines that require precise turbidity limits, prompting laboratories to adopt automated turbidimeters. Historically, the market emerged in the 1970s with simple visual kits, then progressed to nephelometric devices in the 1990s, and now embraces connected sensors that deliver real‑time data. This evolution reflects a broader shift toward monitoring, positioning turbidity assessment as a cornerstone of quality‑control frameworks. Building on the digital‑first foundation, the most compelling growth driver today is the expanding demand for real‑time compliance monitoring across municipal water networks and food‑processing plants. When regulators tighten permissible turbidity thresholds, operators must substitute manual sampling with continuous inline sensors, a shift that fuels sales of advanced turbidimeters equipped with IoT connectivity. For example, a European city recently retrofitted its distribution system with networked probes, achieving a 30 percent reduction in contamination incidents and prompting neighboring utilities to replicate the model. This cascade effect opens opportunities for service contracts, data‑analytics platforms, and regional standards that further accelerate market expansion.
How is AI-driven automation enhancing accuracy in the turbidimetric testing market?
AI driven automation is reshaping turbidimetric testing by linking sample preparation, measurement and data interpretation within a single workflow. Sensors capture light scattering while machine learning models translate raw signals into precise concentration values. The market now sees integrated instruments that self calibrate, flag outliers and suggest corrective actions. Laboratories benefit from reduced manual handling, faster turnaround and consistent results across operators. Real time monitoring of reagent stability and predictive maintenance further tighten accuracy. These capabilities make the technology attractive for clinical, environmental and food safety labs seeking reliable quantitative analysis and compliance with regulatory standards through validated protocols in practice.Thermo Fisher Scientific launched an AI enabled turbidimetric analyzer in April 2024, the system combines optical detection with adaptive algorithms that continuously refine calibration curves. This rollout shortens assay time and lifts confidence in results, driving broader adoption of automated testing across the sector and improves laboratory productivity worldwide significantly.
Market snapshot - (2026-2033)
Global Market Size
USD 642.5 Million
Largest Segment
Immunoturbidimetric Testing
Fastest Growth
Water Quality Testing
Growth Rate
6.7% CAGR
To get more insights on this market click here to Request a Free Sample Report
Global turbidimetric testing market is segmented by test type, product, end user, application, automation and region. Based on test type, the market is segmented into Immunoturbidimetric Testing, Protein Assays, Water Quality Testing and Microbiological Testing. Based on product, the market is segmented into Instruments, Reagents and Calibration Standards. Based on end user, the market is segmented into Clinical Laboratories, Hospitals, Research Institutes and Environmental Laboratories. Based on application, the market is segmented into Clinical Diagnostics, Food Testing and Water Analysis. Based on automation, the market is segmented into Manual and Automated. Based on region, the market is segmented into North America, Europe, Asia Pacific, Latin America and Middle East & Africa.
Immunoturbidimetric Testing segment dominates because it directly supports high‑throughput clinical diagnostics, where rapid quantification of biomarkers is essential for timely treatment decisions. The method’s compatibility with existing laboratory workflows and its proven analytical robustness encourage widespread adoption across healthcare settings. Furthermore, continuous improvements in assay sensitivity and specificity reinforce its position as the preferred choice, driving sustained demand in the Turbidimetric Testing Market globally within the industry.
Meanwhile, Protein Assays are witnessing the strongest growth momentum as they expand beyond traditional clinical uses into food safety and environmental monitoring. Innovations in multiplexed assay formats and the push for comprehensive protein profiling accelerate adoption, opening new revenue streams and positioning this area as a catalyst for future market expansion.
Instruments segment leads because they provide the essential hardware platform that integrates optical detection, temperature control, and data management needed for reliable turbidimetric measurements. Laboratories prioritize robust, user‑friendly devices to ensure reproducibility and compliance with quality standards, making capital equipment a key investment. Continued enhancements in miniaturization, connectivity, and diagnostic workflow integration further solidify instrument dominance in the Turbidimetric Testing Market across diverse testing scenarios and emerging applications.
Conversely, Reagents are emerging as the key high‑growth area as assay developers introduce novel chemistries that boost sensitivity and shorten incubation times. The shift toward point‑of‑care and decentralized testing drives demand for ready‑to‑use reagent kits, while regulatory encouragement for standardized controls fuels broader market reach, accelerating overall expansion.
To get detailed segments analysis, Request a Free Sample Report
North America leads the Turbidimetric Testing Market because it combines a mature industrial base with a robust ecosystem of technology developers, instrument manufacturers, and end‑user sectors such as water utilities, pharmaceuticals, and food processing. The region benefits from strong research institutions that continuously advance analytical methods, while regulatory frameworks promote rigorous water quality monitoring. Integrated supply chains ensure rapid access to high‑performance reagents and calibration standards, and the presence of major multinational corporations drives both innovation and widespread adoption across diverse applications. Collaborative clusters linking universities, start‑ups and established firms accelerate the translation of novel sensor technologies into commercial kits. Continuous investment by both public and private sectors sustains a pipeline of next‑generation turbidimeters that deliver higher sensitivity and lower maintenance requirements. Moreover, stringent environmental guidelines across the United States and Canada compel utilities and manufacturers to adopt reliable turbidity measurement as a compliance cornerstone, reinforcing market depth and resilience.
Turbidimetric Testing Market in United States is propelled by a dense network of water treatment agencies, pharmaceutical firms, and food safety regulators that prioritize precise turbidity control. The country hosts leading instrument manufacturers that combine advanced optics with rugged designs suited for field deployment. Strong collaboration between academic laboratories and industry accelerates innovation in low‑detection‑limit sensors, while extensive training programs ensure skilled operators maintain consistent analytical performance across diverse applications.
Turbidimetric Testing Market in Canada benefits from stewardship policies that drive monitoring of surface and drinking water sources. Domestic manufacturers specialize in compact, low‑power turbidimeters adapted to sampling stations and harsh climates. Research collaborations with national laboratories focus on enhancing reagent stability and expanding data analytics. The emphasis on sustainable water management, combined with a proactive regulatory environment, creates demand for reliable turbidity measurement solutions across municipal and industrial sectors.
Europe’s Turbidimetric Testing Market is propelled by a confluence of stringent environmental directives, a thriving pharmaceutical and food safety landscape, and a collaborative research environment that accelerates analytical innovation. The European Union’s focus on water quality and ecosystem protection creates a pervasive demand for precise turbidity monitoring across municipal supplies, industrial effluents, and laboratory settings. Leading instrument makers benefit from a dense network of technical universities and research institutes that co‑develop low‑detection‑limit sensors and robust calibration protocols. Moreover, the region’s mature regulatory framework offers clear guidance, encouraging manufacturers to integrate advanced digital connectivity and data‑management features. Together these factors establish Europe as a hub of high‑value, compliance‑driven turbidity solutions and underpin its rapid market expansion.
Turbidimetric Testing Market in Germany is anchored by a strong chemical engineering sector and an environmental compliance culture. Domestic manufacturers produce precise turbidimeters that are widely adopted by water utilities and pharmaceutical producers. Cooperation between universities and industry accelerates the development of next‑generation optical sensors, while standardized testing frameworks ensure consistent data quality. The emphasis on sustainable water management reinforces Germany’s position as a leading European hub for turbidity analysis.
Turbidimetric Testing Market in United Kingdom is experiencing growth driven by water quality initiatives and a life‑science sector. British firms specialize in compact, field‑ready turbidimeters that cater to regulatory inspections and research laboratories. Partnerships with universities foster prototyping of smart sensor platforms incorporating AI for turbidity interpretation. Governmental ongoing support for sustainable infrastructure projects amplifies continual significant demand, positioning United Kingdom as a fast‑growing hub for advanced turbidity measurement technologies.
Turbidimetric Testing Market in France is emerging as a hub for environmental monitoring and food safety compliance. French companies develop turbidimeters that integrate with laboratory information systems. Collaborative projects with research agencies aim to enhance sensor robustness for diverse water matrices, including reclaimed and marine environments. Growing awareness of water quality issues, coupled with supportive policy incentives, drives increasing adoption of reliable turbidity measurement across municipal utilities and agrifood processors.
Asia Pacific is rapidly strengthening its position in the Turbidimetric Testing Market through a blend of rising industrial activity, heightened environmental regulation, and accelerated technological adoption. The region’s expanding manufacturing base, particularly in electronics, chemicals, and food processing, creates a growing need for precise water quality control. Governments are introducing stricter effluent standards, prompting utilities and producers to invest in reliable turbidity instrumentation. At the same time, local instrument makers are innovating compact, low‑power devices suited to diverse climatic conditions and remote monitoring needs. Strategic partnerships between multinational firms and regional research institutes foster the development of smart sensors with integrated data‑analytics capabilities. This convergence of regulatory pressure, market demand, and home‑grown innovation positions Asia Pacific as a dynamic engine for future turbidity‑testing advancements.
Turbidimetric Testing Market in Japan benefits from an industrial landscape and an emphasis on precision engineering. Japanese manufacturers produce turbidimeters optimized for semiconductor fabrication, pharmaceutical production, and water treatment plants. Collaboration with leading technical universities drives refinement of optical detection methods and sensor arrays. Governmental initiatives supporting sustainable water management encourage widespread deployment of turbidity monitoring across municipal and industrial networks, reinforcing Japan’s reputation as a leader in the field.
Turbidimetric Testing Market in South Korea is gaining momentum through governmental focus on water safety and an expanding manufacturing sector. Korean firms develop turbidimeters designed for integration into smart city infrastructure and production lines. Partnerships with research institutes accelerate incorporation of IoT connectivity and cloud analytics, enabling turbidity data sharing. The push for environmental compliance and digital transformation drives adoption of turbidity testing solutions across public utilities and private industries.
To know more about the market opportunities by region and country, click here to
Buy The Complete Report
Increasing Clinical Adoption
Advancements in Sensor Technology
High Initial Equipment Cost
Regulatory Compliance Complexity
Request Free Customization of this report to help us to meet your business objectives.
The competitive landscape is shaped by major instrument makers leveraging M&A, strategic alliances, and rapid tech upgrades; Danaher’s 2021 acquisition of Pall expanded its turbidimetric portfolio, while Hach’s partnership with Xylem in 2022 integrates real‑time turbidity sensors into smart water networks, and Shimadzu’s 2023 launch of a AI‑driven turbidimeter accelerates analytical precision, intensifying rivalry and driving innovation cycles.
Top Player’s Company Profile
Recent Developments
SkyQuest’s ABIRAW (Advanced Business Intelligence, Research & Analysis Wing) is our Business Information Services team that Collects, Collates, Correlates, and Analyses the Data collected by means of Primary Exploratory Research backed by robust Secondary Desk research. As per SkyQuest analysis, the market’s momentum is propelled primarily by the surge in real‑time compliance monitoring for municipal water networks, which pushes utilities toward automated, IoT‑enabled turbidimeters, while advancements in sensor technology and AI‑driven automation form a second catalyst by improving sensitivity and workflow efficiency. North America remains the dominant region thanks to its mature supply chain, stringent regulations and strong research ecosystem. The immunoturbidimetric testing segment leads the market owing to its high‑throughput role in clinical diagnostics. However, the high initial equipment cost continues to restrain adoption, especially among smaller laboratories and emerging markets, tempering overall growth in the coming years.
| Report Metric | Details |
|---|---|
| Market size value in 2024 | USD 642.5 Million |
| Market size value in 2033 | USD 1151.74 Million |
| Growth Rate | 6.7% |
| Base year | 2024 |
| Forecast period | (2026-2033) |
| Forecast Unit (Value) | USD Million |
| Segments covered |
|
| Regions covered | North America (US, Canada), Europe (Germany, France, United Kingdom, Italy, Spain, Rest of Europe), Asia Pacific (China, India, Japan, Rest of Asia-Pacific), Latin America (Brazil, Rest of Latin America), Middle East & Africa (South Africa, GCC Countries, Rest of MEA) |
| Companies covered |
|
| Customization scope | Free report customization with purchase. Customization includes:-
|
To get a free trial access to our platform which is a one stop solution for all your data requirements for quicker decision making. This platform allows you to compare markets, competitors who are prominent in the market, and mega trends that are influencing the dynamics in the market. Also, get access to detailed SkyQuest exclusive matrix.
Table Of Content
Executive Summary
Market overview
Parent Market Analysis
Market overview
Market size
KEY MARKET INSIGHTS
COVID IMPACT
MARKET DYNAMICS & OUTLOOK
Market Size by Region
KEY COMPANY PROFILES
Methodology
For the Turbidimetric Testing Market, our research methodology involved a mixture of primary and secondary data sources. Key steps involved in the research process are listed below:
1. Information Procurement: This stage involved the procurement of Market data or related information via primary and secondary sources. The various secondary sources used included various company websites, annual reports, trade databases, and paid databases such as Hoover's, Bloomberg Business, Factiva, and Avention. Our team did 45 primary interactions Globally which included several stakeholders such as manufacturers, customers, key opinion leaders, etc. Overall, information procurement was one of the most extensive stages in our research process.
2. Information Analysis: This step involved triangulation of data through bottom-up and top-down approaches to estimate and validate the total size and future estimate of the Turbidimetric Testing Market.
3. Report Formulation: The final step entailed the placement of data points in appropriate Market spaces in an attempt to deduce viable conclusions.
4. Validation & Publishing: Validation is the most important step in the process. Validation & re-validation via an intricately designed process helped us finalize data points to be used for final calculations. The final Market estimates and forecasts were then aligned and sent to our panel of industry experts for validation of data. Once the validation was done the report was sent to our Quality Assurance team to ensure adherence to style guides, consistency & design.
Analyst Support
Customization Options
With the given market data, our dedicated team of analysts can offer you the following customization options are available for the Turbidimetric Testing Market:
Product Analysis: Product matrix, which offers a detailed comparison of the product portfolio of companies.
Regional Analysis: Further analysis of the Turbidimetric Testing Market for additional countries.
Competitive Analysis: Detailed analysis and profiling of additional Market players & comparative analysis of competitive products.
Go to Market Strategy: Find the high-growth channels to invest your marketing efforts and increase your customer base.
Innovation Mapping: Identify racial solutions and innovation, connected to deep ecosystems of innovators, start-ups, academics, and strategic partners.
Category Intelligence: Customized intelligence that is relevant to their supply Markets will enable them to make smarter sourcing decisions and improve their category management.
Public Company Transcript Analysis: To improve the investment performance by generating new alpha and making better-informed decisions.
Social Media Listening: To analyze the conversations and trends happening not just around your brand, but around your industry as a whole, and use those insights to make better Marketing decisions.
REQUEST FOR SAMPLE
 REQUEST FREE CUSTOMIZATION


Want to customize this report? This report can be personalized according to your needs. Our analysts and industry experts will work directly with you to understand your requirements and provide you with customized data in a short amount of time. We offer $1000 worth of FREE customization at the time of purchase.
Feedback From Our Clients


 USA (+1) 351-333-4748

