Self-service Analytics Market

Self-service Analytics Market Size, Share, Growth Analysis, By Deployment Type(On-Premises, Cloud), By End-Use(IT & Telecom, Retail & E-commerce), By Region(North America, U.S.) - Industry Forecast 2024-2031


Report ID: UCMIG45E2234 | Region: Global | Published Date: Upcoming |
Pages: 165 | Tables: 55 | Figures: 60

Self-service Analytics Market Insights

Market Overview:

Self-service analytics refers to a set of tools and platforms that let business users examine and evaluate data on their own, without having to wait for reports or dashboards to be generated by IT or data analysts. The increasing need for producing in-depth competitive data analysis and increasing the number of corporate data are the main factors propelling the worldwide self-service BI market. The demand for a better analytics-driven organization, the constancy of changing business needs, and IT's incapacity to fulfill business requests on time are additional factors driving the expansion of the global self-service BI market.

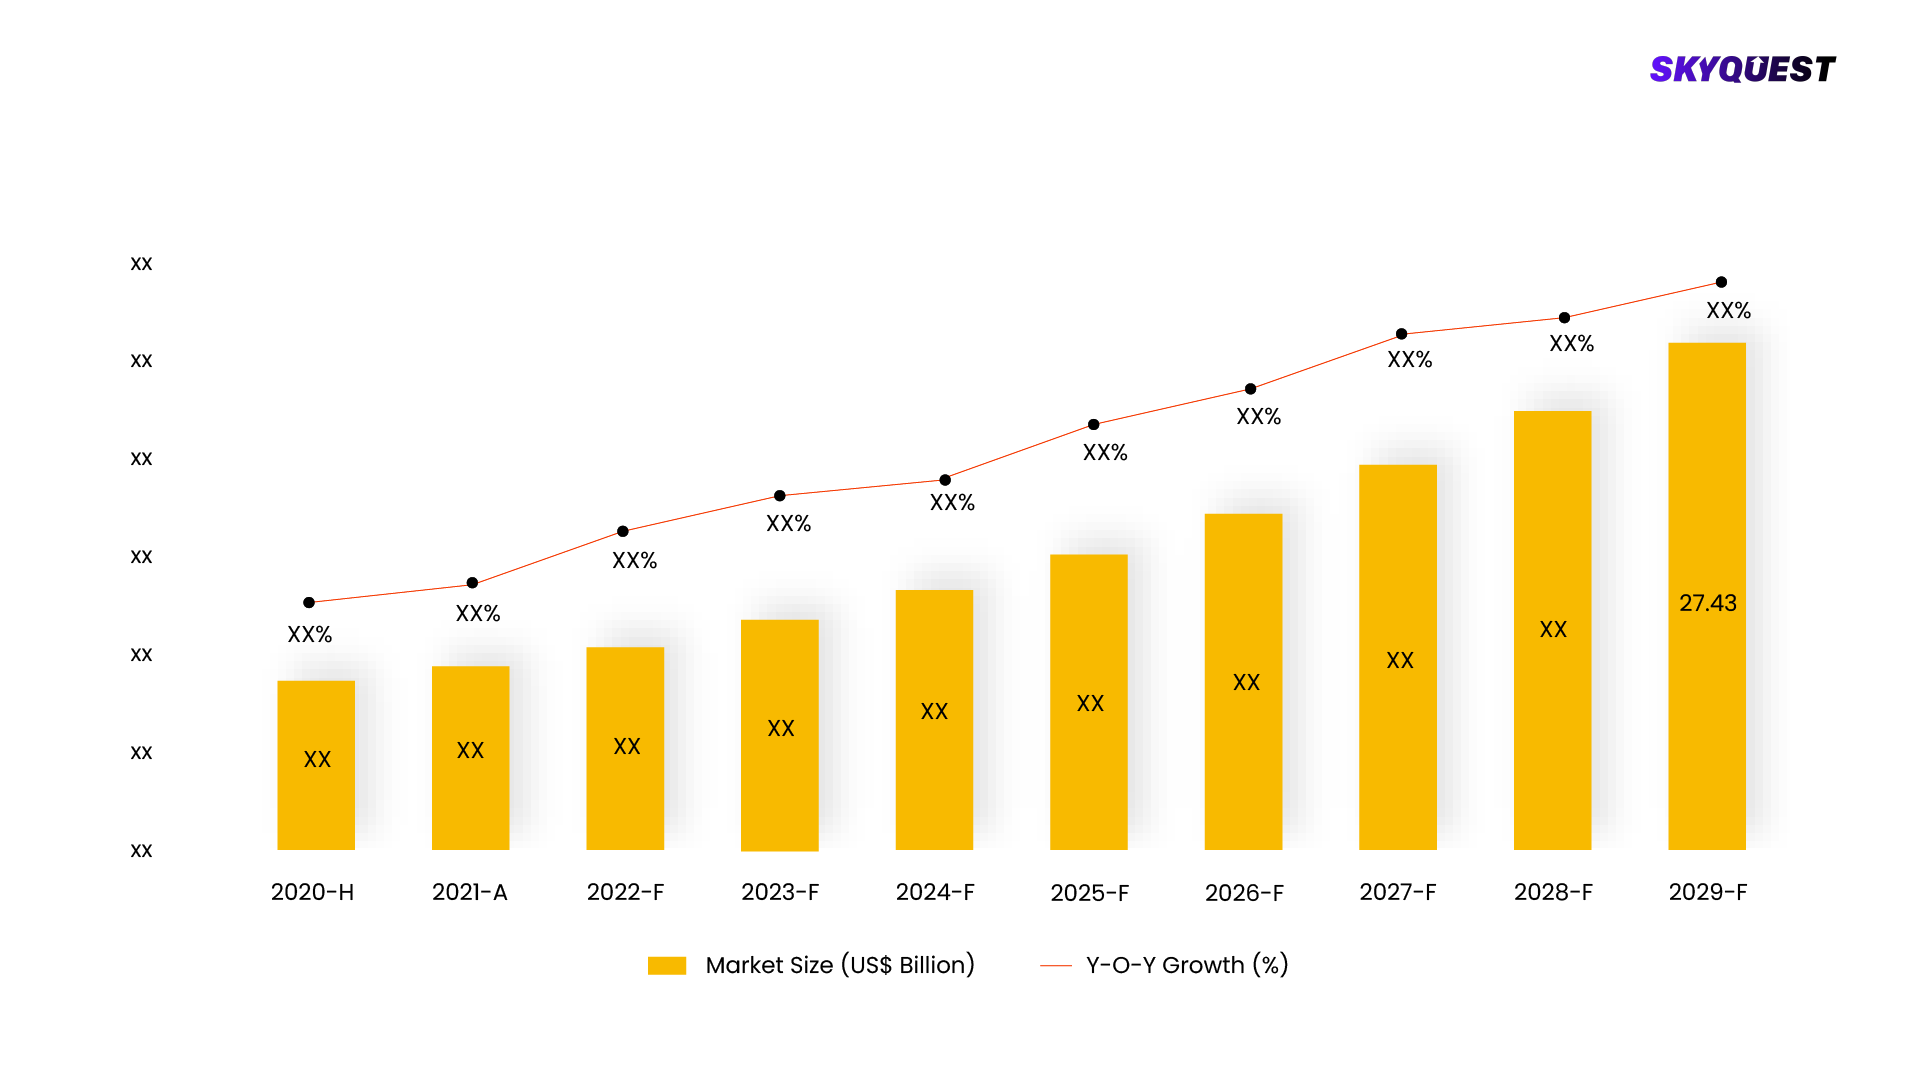
Self-service Analytics Market, Forecast & Y-O-Y Growth Rate, 2020 - 2028
ForecastGrowthRate
To get more reports on the above market click here to
GET FREE SAMPLE

This report is being written to illustrate the market opportunity by region and by segments, indicating opportunity areas for the vendors to tap upon. To estimate the opportunity, it was very important to understand the current market scenario and the way it will grow in future.

Production and consumption patterns are being carefully compared to forecast the market. Other factors considered to forecast the market are the growth of the adjacent market, revenue growth of the key market vendors, scenario-based analysis, and market segment growth.

The market size was determined by estimating the market through a top-down and bottom-up approach, which was further validated with industry interviews. Considering the nature of the market we derived the Application Software by segment aggregation, the contribution of the Application Software in Software & Services and vendor share.

To determine the growth of the market factors such as drivers, trends, restraints, and opportunities were identified, and the impact of these factors was analyzed to determine the market growth. To understand the market growth in detail, we have analyzed the year-on-year growth of the market. Also, historic growth rates were compared to determine growth patterns.

Segmentation Analysis:

The Self-service Analytics Market is segmented by Deployment Type, End-Use, Region. We are analyzing the market of these segments to identify which segment is the largest now and in the future, which segment has the highest growth rate, and the segment which offers the opportunity in the future.

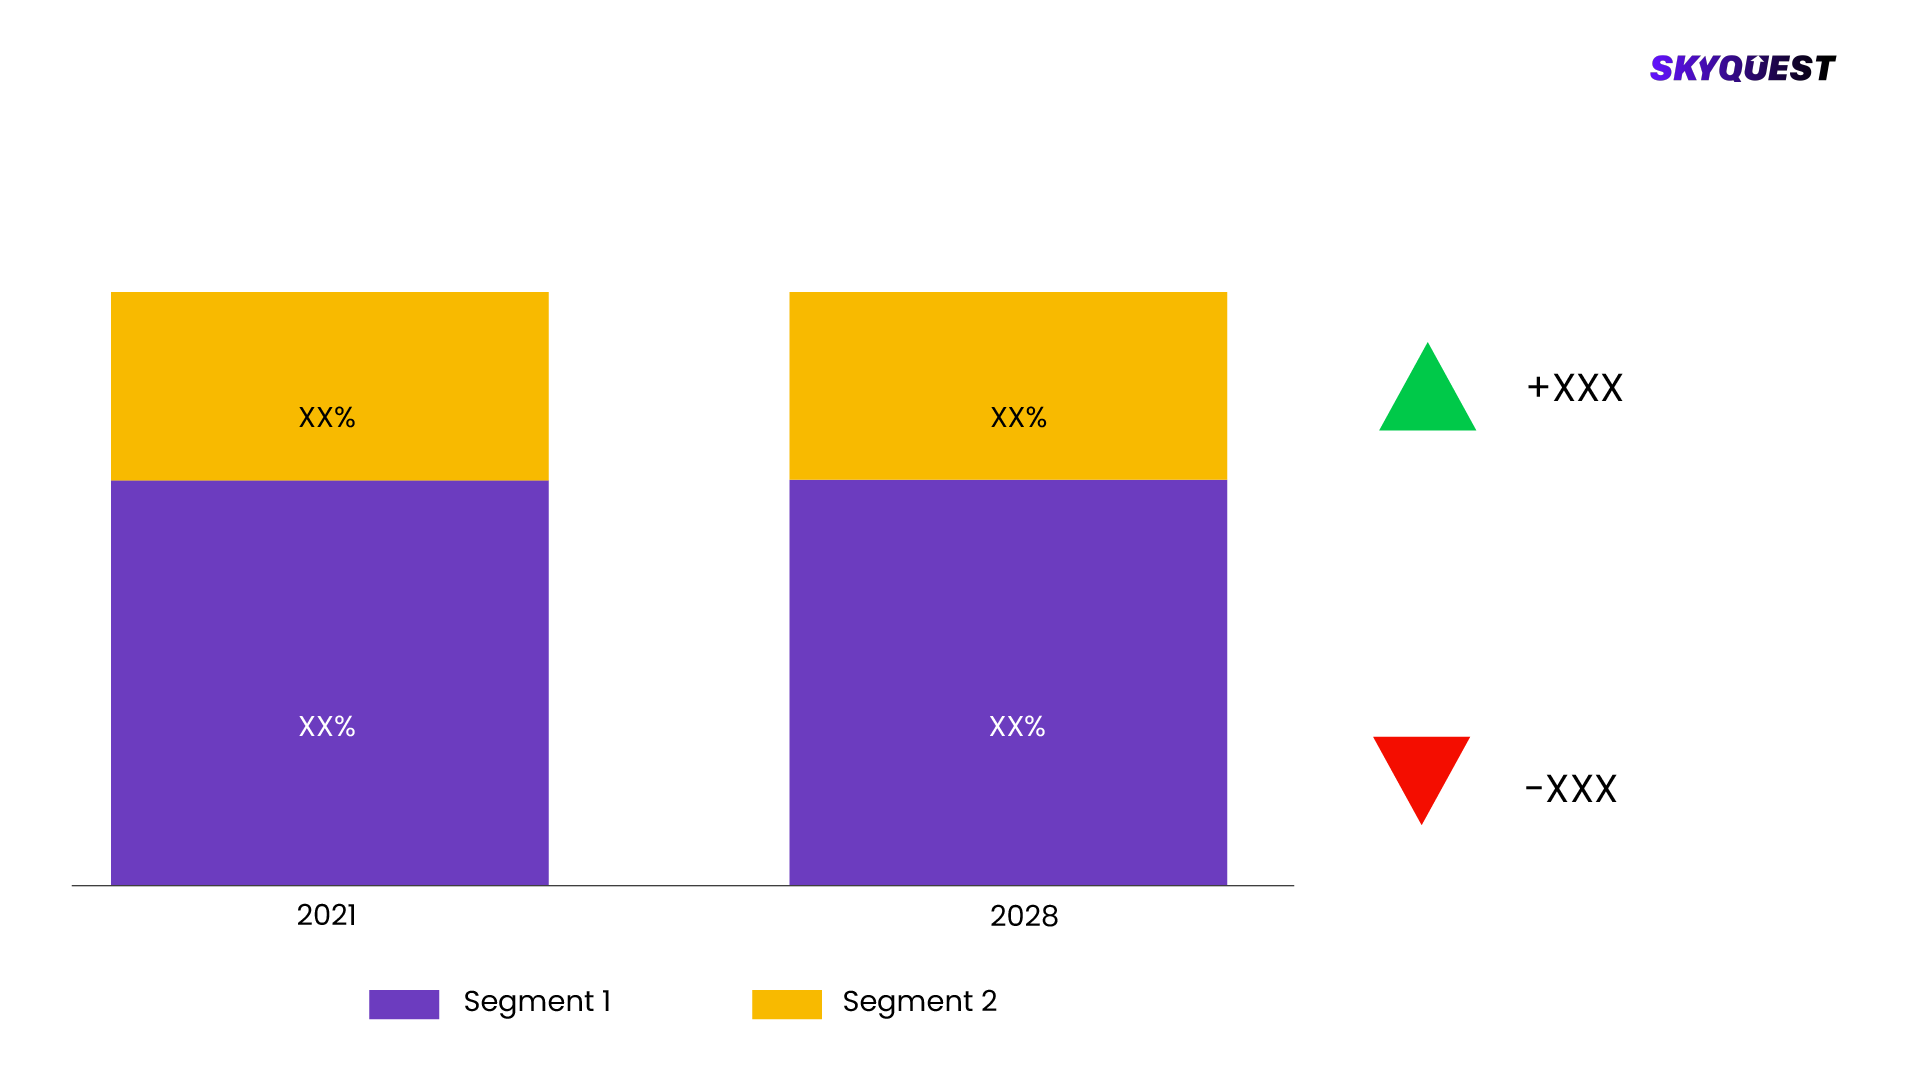
Self-service Analytics Market Basis Point Share Analysis, 2021 Vs. 2028
BasisPointShareAnalysis
To get detailed analysis on all segments
BUY NOW
  • Based on Deployment Type the market is segmented as, On-Premises, Cloud
  • Based on End-Use the market is segmented as, IT & Telecom, Retail & E-commerce, Energy and Utility, Healthcare, Media & Entertainment, BFSI sector
  • Based on Region the market is segmented as, North America, U.S., Canada, Europe, UK, Germany, France, Italy, Asia Pacific, Japan, China, India, Latin America, Brazil, Mexico, Argentina, Middle East & Africa, South Africa, Saudi Arabia, UAE, KEY MARKET PLAYERS, IBM, Microsoft, TATA Consultancy Services Limited, Infosys Limited, TABLEAU SOFTWARE, LLC,, Splunk Inc., Oracle, Cloud Software Group, Inc., Domo, Inc., TARGIT

Regional Analysis:

Self-service Analytics Market is being analyzed by North America, Europe, Asia-Pacific (APAC), Latin America (LATAM), Middle East & Africa (MEA) regions. Key countries including the U.S., Canada, Germany, France, UK, Italy, Spain, China, India, Japan, Brazil, GCC Countries, and South Africa among others were analyzed considering various micro and macro trends.

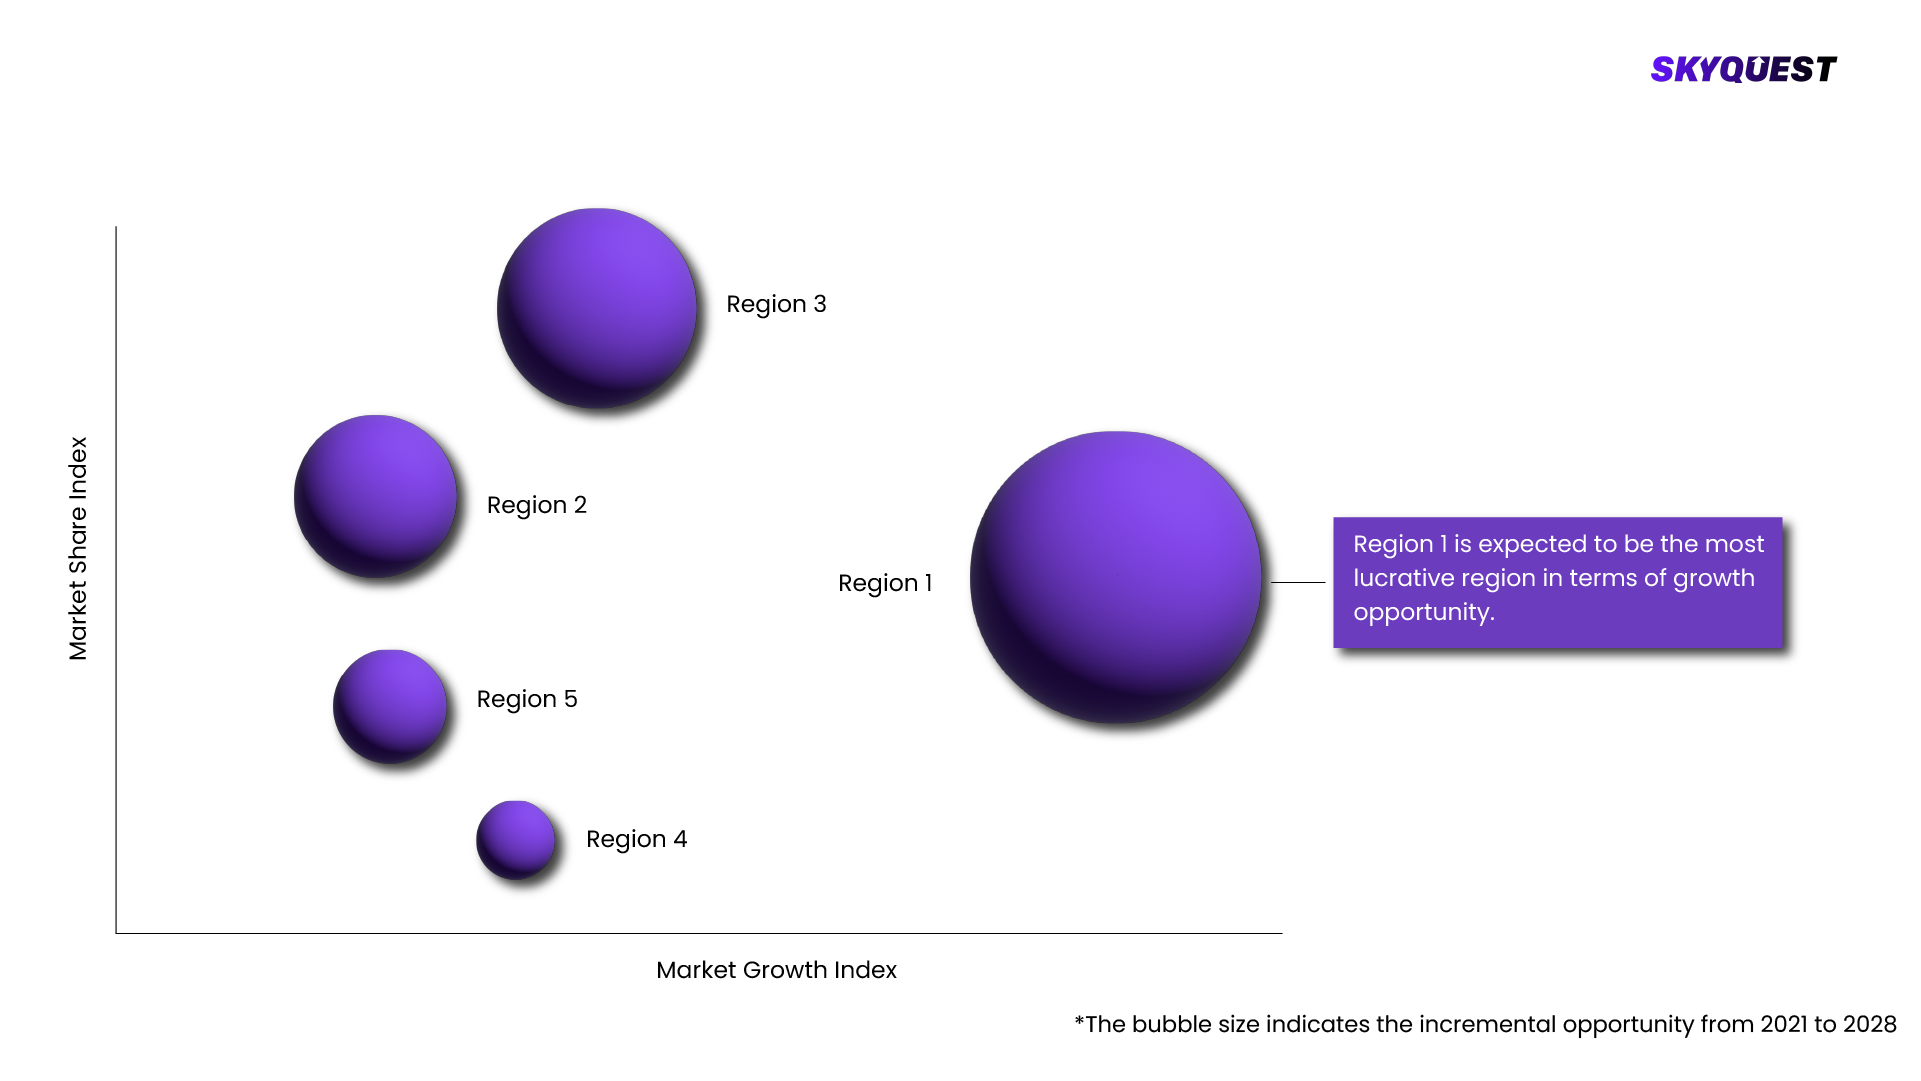
Self-service Analytics Market Attractiveness Analysis, By Region 2020-2028
AttractivenessAnalysis
To know more about the market opportunities by region and country, click here to
REQUEST FREE CUSTOMIZATION

Self-service Analytics Market : Risk Analysis

SkyQuest's expert analysts have conducted a risk analysis to understand the impact of external extremities on Self-service Analytics Market. We analyzed how geopolitical influence, natural disasters, climate change, legal scenario, economic impact, trade & economic policies, social & ethnic concerns, and demographic changes might affect Self-service Analytics Market's supply chain, distribution, and total revenue growth.

Competitive landscaping:

To understand the competitive landscape, we are analyzing key Self-service Analytics Market vendors in the market. To understand the competitive rivalry, we are comparing the revenue, expenses, resources, product portfolio, region coverage, market share, key initiatives, product launches, and any news related to the Self-service Analytics Market.

To validate our hypothesis and validate our findings on the market ecosystem, we are also conducting a detailed porter's five forces analysis. Competitive Rivalry, Supplier Power, Buyer Power, Threat of Substitution, and Threat of New Entry each force is analyzed by various parameters governing those forces.

Key Players Covered in the Report:

  • e analytics encompasses tools and platforms that enable business users to explore and analyze data independently rather than relying on IT or data analysts to generate reports or dashboards. These tools often have user-friendly interfaces, drag-and-drop capability, and other features that allow users to build visualizations quickly and reports from data sources such as spreadsheets, databases, and other data repositories.
  • Self-service analytics is a rapidly growing trend in data analysis and business intelligence. As making decisions based on data becomes more vital for success, organizations must empower their employees to access and analyze data promptly. Some of the key factors responsible for the growth of the self-service analytics market include ease of use of analytics tools, self-service analytics tools have intuitive interfaces for non-IT professionals, and drag-and-drop functionality that allows users to build visualizations and dashboards quickly. Self-service analytics tools are typically less expensive than traditional business intelligence solutions. By giving business users direct access to data, self-service analytics tools help democratize data within organizations, enabling more people to make data-driven decisions. As data volumes and complexity grow, businesses are looking for tools to help them make sense of their data. Self-service analytics provides a way for businesses to unlock insights from their data which owes to demand in the self-service analytics market.
  • LATEST TRENDS
  • The volume of structured and unstructured data is increasing globally, which can be attributed to factors such as globalization, rising internet usage, increased use of social media platforms, and the booming e-commerce industry.
  • This is one of the major driving forces behind the adoption of service-service BI, especially considering the increased uptake of data analytics solutions by small and medium-sized organizations (SMEs).
  • Businesses can decentralize the process of business analysis with its help. Additionally, the market players are being given lucrative growth prospects by the growing adoption of cloud computing technologies in business intelligence. In addition, as governing bodies in many nations promote the use of digital payments, a significant increase in people switching to online payments has been observed.
  • Financial institutions like banks are therefore looking for technology solutions to increase the productivity of their current employees. This has a beneficial impact on how self-service BI is used globally, along with the increased demand for enterprises to be nimbler and maintain a competitive advantage in the market.
  • Owing to the need for modernizing business report analysis and modeling of data, a transition from complicated BI tools that only IT specialists could implement to self-service BI tools took place. Self-service Bl market witnessed a prominent adoption across various business fields such as marketing, sales, operations, human resource and finance attributed to detailed competitive analysis and ease of application for non-technical staff.
  • Self-service BI benefits the business users from non-analytical background to generate insights and data analysis. Self-service BI market is experiencing an increasing demand for the business fields attributed to its ability to transform business organizations into an efficient data-driven organization. Self-service BI market is projected to grow over the forecast period owing to its ability to decentralize the business analytical process!
  • The COVID-19 pandemic had a positive impact on the self-service analytics market. The pandemic highlighted the need for businesses to quickly access accurate data and insights to make informed decisions in a rapidly changing environment. As a result, there has been an increased demand for self-service analytics tools that allow non-technical users to access and analyze data quickly. In addition, technological advancements like AI and machine learning also result in the increased demand for self-service analytics.
  • KEY DRIVER
  • Users can quickly and easily access data, deriving answers and creating reports without waiting for someone else to do it for them.
  • This is especially true for factory14, a European consumer goods company focused on increasing the profitability for brands sold on Amazon. They’re brand management and operations teams were drowning in spreadsheets. These data silos were impacting their ability to keep up with product demand.
  • That’s when they decided to implement a true self-service analytics solution. Here’s how then Vice President of Analytics, Leon Tang, described the increased efficiency of self-service analytics:
  • “For someone like [the CBO] to just go into ThoughtSpot, type a few words into the search bar and pull the exact information he needs, just like that — is nothing short of amazing. Now people are using Excel a lot less. Instead, they’re finding the exact data they need with ThoughtSpot.”
  • factory14 has since undergone a successful acquisition, and Leon Tang has moved on to another opportunity as the Director of Data for Jobandtalent. However, the impact that self-service analytics had on their team is undeniable.
  • By allowing users to access data themselves, self-service analytics reduces the chance of errors that can occur when data is manually entered, downloaded to a machine, or processed. While this is true in every industry, the accuracy and reliability of data is extremely relevant in healthcare.
  • For instance, consider Gilead Sciences, a research-based biopharmaceutical company. Here’s what Murali Vridhachalam, Head of Enterprise Data and Analytics, had to say about how self-service analytics has helped to improve the impact of their insights:
  • “I noticed there were a lot of different teams working on siloed data and analytics. Now, we have a holistic approach of initiating data-driven [insights] at Gilead. It's not a cliche….For example, a lot of things were dependent on a single BI team to create reports. We are trying to disrupt that culture by enabling self-service analytics.”
  • The democratization of data and rise of self-service analytics has the power to improve patient outcomes in healthcare.
  • KEY RESTRAINS
  • By allowing users to access data themselves, self-service analytics reduces the chance of errors that can occur when data is manually entered, downloaded to a machine, or processed. While this is true in every industry, the accuracy and reliability of data is extremely relevant in healthcare.
  • For instance, consider Gilead Sciences, a research-based biopharmaceutical company. Here’s what Murali Vridhachalam, Head of Enterprise Data and Analytics, had to say about how self-service analytics has helped to improve the impact of their insights:
  • “I noticed there were a lot of different teams working on siloed data and analytics. Now, we have a holistic approach of initiating data-driven [insights] at Gilead. It's not a cliche….For example, a lot of things were dependent on a single BI team to create reports. We are trying to disrupt that culture by enabling self-service analytics.”
  • The democratization of data and rise of self-service analytics has the power to improve patient outcomes in healthcare.
  • North America is one of the significant markets for self-service analytics, driven by the presence of major vendors and high adoption rates among enterprises. Europe and Asia Pacific are the fastest-growing markets for self-service analytics, driven by the increasing adoption of cloud-based solutions and the growing need for real-time data analysis.
  • Major players in the self-service analytics market are investing heavily in research and development to introduce new actuators to the market which are more reliable and efficient. They also adopt various strategies such as collaboration, merger, product launch, and acquisition. For instance, in November 2022, IBM launched new software, Business Analytics Enterprise, which consists of analysis tools, including budgeting, planning, reporting, dashboards, and forecasting, for users to make data-driven decisions quickly and navigate unpredictable disruption.
  • KEY MARKET SEGMENTS
  • By Deployment Type
  • On-Premises
  • Cloud
  • By End-Use
  • IT & Telecom
  • Retail & E-commerce
  • Energy and Utility
  • Healthcare
  • Media & Entertainment
  • BFSI sector
  • By Region
  • North America
  • U.S.
  • Canada
  • Europe
  • UK
  • Germany
  • France
  • Italy
  • Asia Pacific
  • Japan
  • China
  • India
  • Latin America
  • Brazil
  • Mexico
  • Argentina
  • Middle East & Africa
  • South Africa
  • Saudi Arabia
  • UAE
  • KEY MARKET PLAYERS
  • IBM
  • Microsoft
  • TATA Consultancy Services Limited
  • Infosys Limited
  • TABLEAU SOFTWARE, LLC,
  • Splunk Inc.
  • Oracle
  • Cloud Software Group, Inc.
  • Domo, Inc.
  • TARGIT

SkyQuest's Expertise:

The Self-service Analytics Market is being analyzed by SkyQuest's analysts with the help of 20+ scheduled Primary interviews from both the demand and supply sides. We have already invested more than 250 hours on this report and are still refining our date to provide authenticated data to your readers and clients. Exhaustive primary and secondary research is conducted to collect information on the market, peer market, and parent market.

Our cross-industry experts and revenue-impact consultants at SkyQuest enable our clients to convert market intelligence into actionable, quantifiable results through personalized engagement.

Scope Of Report

Report Attribute Details
The base year for estimation 2021
Historical data 2016 – 2022
Forecast period 2022 – 2028
Report coverage Revenue forecast, volume forecast, company ranking, competitive landscape, growth factors, and trends, Pricing Analysis
Segments covered
  • By Deployment Type - On-Premises, Cloud
  • By End-Use - IT & Telecom, Retail & E-commerce, Energy and Utility, Healthcare, Media & Entertainment, BFSI sector
  • By Region - North America, U.S., Canada, Europe, UK, Germany, France, Italy, Asia Pacific, Japan, China, India, Latin America, Brazil, Mexico, Argentina, Middle East & Africa, South Africa, Saudi Arabia, UAE, KEY MARKET PLAYERS, IBM, Microsoft, TATA Consultancy Services Limited, Infosys Limited, TABLEAU SOFTWARE, LLC,, Splunk Inc., Oracle, Cloud Software Group, Inc., Domo, Inc., TARGIT
Regional scope North America, Europe, Asia-Pacific (APAC), Latin America (LATAM), Middle East & Africa (MEA)
Country scope U.S., Canada, Germany, France, UK, Italy, Spain, China, India, Japan, Brazil, GCC Countries, South Africa
Key companies profiled
  • e analytics encompasses tools and platforms that enable business users to explore and analyze data independently rather than relying on IT or data analysts to generate reports or dashboards. These tools often have user-friendly interfaces, drag-and-drop capability, and other features that allow users to build visualizations quickly and reports from data sources such as spreadsheets, databases, and other data repositories.
  • Self-service analytics is a rapidly growing trend in data analysis and business intelligence. As making decisions based on data becomes more vital for success, organizations must empower their employees to access and analyze data promptly. Some of the key factors responsible for the growth of the self-service analytics market include ease of use of analytics tools, self-service analytics tools have intuitive interfaces for non-IT professionals, and drag-and-drop functionality that allows users to build visualizations and dashboards quickly. Self-service analytics tools are typically less expensive than traditional business intelligence solutions. By giving business users direct access to data, self-service analytics tools help democratize data within organizations, enabling more people to make data-driven decisions. As data volumes and complexity grow, businesses are looking for tools to help them make sense of their data. Self-service analytics provides a way for businesses to unlock insights from their data which owes to demand in the self-service analytics market.
  • LATEST TRENDS
  • The volume of structured and unstructured data is increasing globally, which can be attributed to factors such as globalization, rising internet usage, increased use of social media platforms, and the booming e-commerce industry.
  • This is one of the major driving forces behind the adoption of service-service BI, especially considering the increased uptake of data analytics solutions by small and medium-sized organizations (SMEs).
  • Businesses can decentralize the process of business analysis with its help. Additionally, the market players are being given lucrative growth prospects by the growing adoption of cloud computing technologies in business intelligence. In addition, as governing bodies in many nations promote the use of digital payments, a significant increase in people switching to online payments has been observed.
  • Financial institutions like banks are therefore looking for technology solutions to increase the productivity of their current employees. This has a beneficial impact on how self-service BI is used globally, along with the increased demand for enterprises to be nimbler and maintain a competitive advantage in the market.
  • Owing to the need for modernizing business report analysis and modeling of data, a transition from complicated BI tools that only IT specialists could implement to self-service BI tools took place. Self-service Bl market witnessed a prominent adoption across various business fields such as marketing, sales, operations, human resource and finance attributed to detailed competitive analysis and ease of application for non-technical staff.
  • Self-service BI benefits the business users from non-analytical background to generate insights and data analysis. Self-service BI market is experiencing an increasing demand for the business fields attributed to its ability to transform business organizations into an efficient data-driven organization. Self-service BI market is projected to grow over the forecast period owing to its ability to decentralize the business analytical process!
  • The COVID-19 pandemic had a positive impact on the self-service analytics market. The pandemic highlighted the need for businesses to quickly access accurate data and insights to make informed decisions in a rapidly changing environment. As a result, there has been an increased demand for self-service analytics tools that allow non-technical users to access and analyze data quickly. In addition, technological advancements like AI and machine learning also result in the increased demand for self-service analytics.
  • KEY DRIVER
  • Users can quickly and easily access data, deriving answers and creating reports without waiting for someone else to do it for them.
  • This is especially true for factory14, a European consumer goods company focused on increasing the profitability for brands sold on Amazon. They’re brand management and operations teams were drowning in spreadsheets. These data silos were impacting their ability to keep up with product demand.
  • That’s when they decided to implement a true self-service analytics solution. Here’s how then Vice President of Analytics, Leon Tang, described the increased efficiency of self-service analytics:
  • “For someone like [the CBO] to just go into ThoughtSpot, type a few words into the search bar and pull the exact information he needs, just like that — is nothing short of amazing. Now people are using Excel a lot less. Instead, they’re finding the exact data they need with ThoughtSpot.”
  • factory14 has since undergone a successful acquisition, and Leon Tang has moved on to another opportunity as the Director of Data for Jobandtalent. However, the impact that self-service analytics had on their team is undeniable.
  • By allowing users to access data themselves, self-service analytics reduces the chance of errors that can occur when data is manually entered, downloaded to a machine, or processed. While this is true in every industry, the accuracy and reliability of data is extremely relevant in healthcare.
  • For instance, consider Gilead Sciences, a research-based biopharmaceutical company. Here’s what Murali Vridhachalam, Head of Enterprise Data and Analytics, had to say about how self-service analytics has helped to improve the impact of their insights:
  • “I noticed there were a lot of different teams working on siloed data and analytics. Now, we have a holistic approach of initiating data-driven [insights] at Gilead. It's not a cliche….For example, a lot of things were dependent on a single BI team to create reports. We are trying to disrupt that culture by enabling self-service analytics.”
  • The democratization of data and rise of self-service analytics has the power to improve patient outcomes in healthcare.
  • KEY RESTRAINS
  • By allowing users to access data themselves, self-service analytics reduces the chance of errors that can occur when data is manually entered, downloaded to a machine, or processed. While this is true in every industry, the accuracy and reliability of data is extremely relevant in healthcare.
  • For instance, consider Gilead Sciences, a research-based biopharmaceutical company. Here’s what Murali Vridhachalam, Head of Enterprise Data and Analytics, had to say about how self-service analytics has helped to improve the impact of their insights:
  • “I noticed there were a lot of different teams working on siloed data and analytics. Now, we have a holistic approach of initiating data-driven [insights] at Gilead. It's not a cliche….For example, a lot of things were dependent on a single BI team to create reports. We are trying to disrupt that culture by enabling self-service analytics.”
  • The democratization of data and rise of self-service analytics has the power to improve patient outcomes in healthcare.
  • North America is one of the significant markets for self-service analytics, driven by the presence of major vendors and high adoption rates among enterprises. Europe and Asia Pacific are the fastest-growing markets for self-service analytics, driven by the increasing adoption of cloud-based solutions and the growing need for real-time data analysis.
  • Major players in the self-service analytics market are investing heavily in research and development to introduce new actuators to the market which are more reliable and efficient. They also adopt various strategies such as collaboration, merger, product launch, and acquisition. For instance, in November 2022, IBM launched new software, Business Analytics Enterprise, which consists of analysis tools, including budgeting, planning, reporting, dashboards, and forecasting, for users to make data-driven decisions quickly and navigate unpredictable disruption.
  • KEY MARKET SEGMENTS
  • By Deployment Type
  • On-Premises
  • Cloud
  • By End-Use
  • IT & Telecom
  • Retail & E-commerce
  • Energy and Utility
  • Healthcare
  • Media & Entertainment
  • BFSI sector
  • By Region
  • North America
  • U.S.
  • Canada
  • Europe
  • UK
  • Germany
  • France
  • Italy
  • Asia Pacific
  • Japan
  • China
  • India
  • Latin America
  • Brazil
  • Mexico
  • Argentina
  • Middle East & Africa
  • South Africa
  • Saudi Arabia
  • UAE
  • KEY MARKET PLAYERS
  • IBM
  • Microsoft
  • TATA Consultancy Services Limited
  • Infosys Limited
  • TABLEAU SOFTWARE, LLC,
  • Splunk Inc.
  • Oracle
  • Cloud Software Group, Inc.
  • Domo, Inc.
  • TARGIT
Customization scope Free report customization (15% Free customization) with purchase. Addition or alteration to country, regional & segment scope.
Pricing and purchase options Reap the benefits of customized purchase options to fit your specific research requirements.

Objectives of the Study

  • To forecast the market size, in terms of value, for various segments with respect to five main regions, namely, North America, Europe, Asia-Pacific (APAC), Latin America (LATAM), Middle East & Africa (MEA)
  • To provide detailed information regarding the major factors influencing the growth of the Market (drivers, restraints, opportunities, and challenges)
  • To strategically analyze the micro markets with respect to the individual growth trends, future prospects, and contribution to the total market
  • To provide a detailed overview of the value chain and analyze market trends with the Porter's five forces analysis
  • To analyze the opportunities in the market for various stakeholders by identifying the high-growth Segments
  • To identify the key players and comprehensively analyze their market position in terms of ranking and core competencies, along with detailing the competitive landscape for the market leaders
  • To analyze competitive development such as joint ventures, mergers and acquisitions, new product launches and development, and research and development in the market

What does this Report Deliver?

  • Market Estimation for 20+ Countries
  • Historical data coverage: 2016 to 2022
  • Growth projections: 2022 to 2028
  • SkyQuest's premium market insights: Innovation matrix, IP analysis, Production Analysis, Value chain analysis, Technological trends, and Trade analysis
  • Customization on Segments, Regions, and Company Profiles
  • 100+ tables, 150+ Figures, 10+ matrix
  • Global and Country Market Trends
  • Comprehensive Mapping of Industry Parameters
  • Attractive Investment Proposition
  • Competitive Strategies Adopted by Leading Market Participants
  • Market drivers, restraints, opportunities, and its impact on the market
  • Regulatory scenario, regional dynamics, and insights of leading countries in each region
  • Segment trends analysis, opportunity, and growth
  • Opportunity analysis by region and country
  • Porter's five force analysis to know the market's condition
  • Pricing analysis
  • Parent market analysis
  • Product portfolio benchmarking

Table Of Content

Executive Summary

Market overview

  • Exhibit: Executive Summary – Chart on Market Overview
  • Exhibit: Executive Summary – Data Table on Market Overview
  • Exhibit: Executive Summary – Chart on Self-service Analytics Market Characteristics
  • Exhibit: Executive Summary – Chart on Market by Geography
  • Exhibit: Executive Summary – Chart on Market Segmentation
  • Exhibit: Executive Summary – Chart on Incremental Growth
  • Exhibit: Executive Summary – Data Table on Incremental Growth
  • Exhibit: Executive Summary – Chart on Vendor Market Positioning

Parent Market Analysis

Market overview

Market size

  • Market Dynamics
    • Exhibit: Impact analysis of DROC, 2021
      • Drivers
      • Opportunities
      • Restraints
      • Challenges
  • SWOT Analysis

KEY MARKET INSIGHTS

  • Technology Analysis
    • (Exhibit: Data Table: Name of technology and details)
  • Pricing Analysis
    • (Exhibit: Data Table: Name of technology and pricing details)
  • Supply Chain Analysis
    • (Exhibit: Detailed Supply Chain Presentation)
  • Value Chain Analysis
    • (Exhibit: Detailed Value Chain Presentation)
  • Ecosystem Of the Market
    • Exhibit: Parent Market Ecosystem Market Analysis
    • Exhibit: Market Characteristics of Parent Market
  • IP Analysis
    • (Exhibit: Data Table: Name of product/technology, patents filed, inventor/company name, acquiring firm)
  • Trade Analysis
    • (Exhibit: Data Table: Import and Export data details)
  • Startup Analysis
    • (Exhibit: Data Table: Emerging startups details)
  • Raw Material Analysis
    • (Exhibit: Data Table: Mapping of key raw materials)
  • Innovation Matrix
    • (Exhibit: Positioning Matrix: Mapping of new and existing technologies)
  • Pipeline product Analysis
    • (Exhibit: Data Table: Name of companies and pipeline products, regional mapping)
  • Macroeconomic Indicators

COVID IMPACT

  • Introduction
  • Impact On Economy—scenario Assessment
    • Exhibit: Data on GDP - Year-over-year growth 2016-2022 (%)
  • Revised Market Size
    • Exhibit: Data Table on Self-service Analytics Market size and forecast 2021-2027 ($ million)
  • Impact Of COVID On Key Segments
    • Exhibit: Data Table on Segment Market size and forecast 2021-2027 ($ million)
  • COVID Strategies By Company
    • Exhibit: Analysis on key strategies adopted by companies

MARKET DYNAMICS & OUTLOOK

  • Market Dynamics
    • Exhibit: Impact analysis of DROC, 2021
      • Drivers
      • Opportunities
      • Restraints
      • Challenges
  • Regulatory Landscape
    • Exhibit: Data Table on regulation from different region
  • SWOT Analysis
  • Porters Analysis
    • Competitive rivalry
      • Exhibit: Competitive rivalry Impact of key factors, 2021
    • Threat of substitute products
      • Exhibit: Threat of Substitute Products Impact of key factors, 2021
    • Bargaining power of buyers
      • Exhibit: buyers bargaining power Impact of key factors, 2021
    • Threat of new entrants
      • Exhibit: Threat of new entrants Impact of key factors, 2021
    • Bargaining power of suppliers
      • Exhibit: Threat of suppliers bargaining power Impact of key factors, 2021
  • Skyquest special insights on future disruptions
    • Political Impact
    • Economic impact
    • Social Impact
    • Technical Impact
    • Environmental Impact
    • Legal Impact

Market Size by Region

  • Chart on Market share by geography 2021-2027 (%)
  • Data Table on Market share by geography 2021-2027(%)
  • North America
    • Chart on Market share by country 2021-2027 (%)
    • Data Table on Market share by country 2021-2027(%)
    • USA
      • Exhibit: Chart on Market share 2021-2027 (%)
      • Exhibit: Market size and forecast 2021-2027 ($ million)
    • Canada
      • Exhibit: Chart on Market share 2021-2027 (%)
      • Exhibit: Market size and forecast 2021-2027 ($ million)
  • Europe
    • Chart on Market share by country 2021-2027 (%)
    • Data Table on Market share by country 2021-2027(%)
    • Germany
      • Exhibit: Chart on Market share 2021-2027 (%)
      • Exhibit: Market size and forecast 2021-2027 ($ million)
    • Spain
      • Exhibit: Chart on Market share 2021-2027 (%)
      • Exhibit: Market size and forecast 2021-2027 ($ million)
    • France
      • Exhibit: Chart on Market share 2021-2027 (%)
      • Exhibit: Market size and forecast 2021-2027 ($ million)
    • UK
      • Exhibit: Chart on Market share 2021-2027 (%)
      • Exhibit: Market size and forecast 2021-2027 ($ million)
    • Rest of Europe
      • Exhibit: Chart on Market share 2021-2027 (%)
      • Exhibit: Market size and forecast 2021-2027 ($ million)
  • Asia Pacific
    • Chart on Market share by country 2021-2027 (%)
    • Data Table on Market share by country 2021-2027(%)
    • China
      • Exhibit: Chart on Market share 2021-2027 (%)
      • Exhibit: Market size and forecast 2021-2027 ($ million)
    • India
      • Exhibit: Chart on Market share 2021-2027 (%)
      • Exhibit: Market size and forecast 2021-2027 ($ million)
    • Japan
      • Exhibit: Chart on Market share 2021-2027 (%)
      • Exhibit: Market size and forecast 2021-2027 ($ million)
    • South Korea
      • Exhibit: Chart on Market share 2021-2027 (%)
      • Exhibit: Market size and forecast 2021-2027 ($ million)
    • Rest of Asia Pacific
      • Exhibit: Chart on Market share 2021-2027 (%)
      • Exhibit: Market size and forecast 2021-2027 ($ million)
  • Latin America
    • Chart on Market share by country 2021-2027 (%)
    • Data Table on Market share by country 2021-2027(%)
    • Brazil
      • Exhibit: Chart on Market share 2021-2027 (%)
      • Exhibit: Market size and forecast 2021-2027 ($ million)
    • Rest of South America
      • Exhibit: Chart on Market share 2021-2027 (%)
      • Exhibit: Market size and forecast 2021-2027 ($ million)
  • Middle East & Africa (MEA)
    • Chart on Market share by country 2021-2027 (%)
    • Data Table on Market share by country 2021-2027(%)
    • GCC Countries
      • Exhibit: Chart on Market share 2021-2027 (%)
      • Exhibit: Market size and forecast 2021-2027 ($ million)
    • South Africa
      • Exhibit: Chart on Market share 2021-2027 (%)
      • Exhibit: Market size and forecast 2021-2027 ($ million)
    • Rest of MEA
      • Exhibit: Chart on Market share 2021-2027 (%)
      • Exhibit: Market size and forecast 2021-2027 ($ million)

KEY COMPANY PROFILES

  • Competitive Landscape
    • Total number of companies covered
      • Exhibit: companies covered in the report, 2021
    • Top companies market positioning
      • Exhibit: company positioning matrix, 2021
    • Top companies market Share
      • Exhibit: Pie chart analysis on company market share, 2021(%)
  • e analytics encompasses tools and platforms that enable business users to explore and analyze data independently rather than relying on IT or data analysts to generate reports or dashboards. These tools often have user-friendly interfaces, drag-and-drop capability, and other features that allow users to build visualizations quickly and reports from data sources such as spreadsheets, databases, and other data repositories.
    • Exhibit Company Overview
    • Exhibit Business Segment Overview
    • Exhibit Financial Updates
    • Exhibit Key Developments
  • Self-service analytics is a rapidly growing trend in data analysis and business intelligence. As making decisions based on data becomes more vital for success, organizations must empower their employees to access and analyze data promptly. Some of the key factors responsible for the growth of the self-service analytics market include ease of use of analytics tools, self-service analytics tools have intuitive interfaces for non-IT professionals, and drag-and-drop functionality that allows users to build visualizations and dashboards quickly. Self-service analytics tools are typically less expensive than traditional business intelligence solutions. By giving business users direct access to data, self-service analytics tools help democratize data within organizations, enabling more people to make data-driven decisions. As data volumes and complexity grow, businesses are looking for tools to help them make sense of their data. Self-service analytics provides a way for businesses to unlock insights from their data which owes to demand in the self-service analytics market.
    • Exhibit Company Overview
    • Exhibit Business Segment Overview
    • Exhibit Financial Updates
    • Exhibit Key Developments
  • LATEST TRENDS
    • Exhibit Company Overview
    • Exhibit Business Segment Overview
    • Exhibit Financial Updates
    • Exhibit Key Developments
  • The volume of structured and unstructured data is increasing globally, which can be attributed to factors such as globalization, rising internet usage, increased use of social media platforms, and the booming e-commerce industry.
    • Exhibit Company Overview
    • Exhibit Business Segment Overview
    • Exhibit Financial Updates
    • Exhibit Key Developments
  • This is one of the major driving forces behind the adoption of service-service BI, especially considering the increased uptake of data analytics solutions by small and medium-sized organizations (SMEs).
    • Exhibit Company Overview
    • Exhibit Business Segment Overview
    • Exhibit Financial Updates
    • Exhibit Key Developments
  • Businesses can decentralize the process of business analysis with its help. Additionally, the market players are being given lucrative growth prospects by the growing adoption of cloud computing technologies in business intelligence. In addition, as governing bodies in many nations promote the use of digital payments, a significant increase in people switching to online payments has been observed.
    • Exhibit Company Overview
    • Exhibit Business Segment Overview
    • Exhibit Financial Updates
    • Exhibit Key Developments
  • Financial institutions like banks are therefore looking for technology solutions to increase the productivity of their current employees. This has a beneficial impact on how self-service BI is used globally, along with the increased demand for enterprises to be nimbler and maintain a competitive advantage in the market.
    • Exhibit Company Overview
    • Exhibit Business Segment Overview
    • Exhibit Financial Updates
    • Exhibit Key Developments
  • Owing to the need for modernizing business report analysis and modeling of data, a transition from complicated BI tools that only IT specialists could implement to self-service BI tools took place. Self-service Bl market witnessed a prominent adoption across various business fields such as marketing, sales, operations, human resource and finance attributed to detailed competitive analysis and ease of application for non-technical staff.
    • Exhibit Company Overview
    • Exhibit Business Segment Overview
    • Exhibit Financial Updates
    • Exhibit Key Developments
  • Self-service BI benefits the business users from non-analytical background to generate insights and data analysis. Self-service BI market is experiencing an increasing demand for the business fields attributed to its ability to transform business organizations into an efficient data-driven organization. Self-service BI market is projected to grow over the forecast period owing to its ability to decentralize the business analytical process!
    • Exhibit Company Overview
    • Exhibit Business Segment Overview
    • Exhibit Financial Updates
    • Exhibit Key Developments
  • The COVID-19 pandemic had a positive impact on the self-service analytics market. The pandemic highlighted the need for businesses to quickly access accurate data and insights to make informed decisions in a rapidly changing environment. As a result, there has been an increased demand for self-service analytics tools that allow non-technical users to access and analyze data quickly. In addition, technological advancements like AI and machine learning also result in the increased demand for self-service analytics.
    • Exhibit Company Overview
    • Exhibit Business Segment Overview
    • Exhibit Financial Updates
    • Exhibit Key Developments
  • KEY DRIVER
    • Exhibit Company Overview
    • Exhibit Business Segment Overview
    • Exhibit Financial Updates
    • Exhibit Key Developments
  • Users can quickly and easily access data, deriving answers and creating reports without waiting for someone else to do it for them.
    • Exhibit Company Overview
    • Exhibit Business Segment Overview
    • Exhibit Financial Updates
    • Exhibit Key Developments
  • This is especially true for factory14, a European consumer goods company focused on increasing the profitability for brands sold on Amazon. They’re brand management and operations teams were drowning in spreadsheets. These data silos were impacting their ability to keep up with product demand.
    • Exhibit Company Overview
    • Exhibit Business Segment Overview
    • Exhibit Financial Updates
    • Exhibit Key Developments
  • That’s when they decided to implement a true self-service analytics solution. Here’s how then Vice President of Analytics, Leon Tang, described the increased efficiency of self-service analytics:
    • Exhibit Company Overview
    • Exhibit Business Segment Overview
    • Exhibit Financial Updates
    • Exhibit Key Developments
  • “For someone like [the CBO] to just go into ThoughtSpot, type a few words into the search bar and pull the exact information he needs, just like that — is nothing short of amazing. Now people are using Excel a lot less. Instead, they’re finding the exact data they need with ThoughtSpot.”
    • Exhibit Company Overview
    • Exhibit Business Segment Overview
    • Exhibit Financial Updates
    • Exhibit Key Developments
  • factory14 has since undergone a successful acquisition, and Leon Tang has moved on to another opportunity as the Director of Data for Jobandtalent. However, the impact that self-service analytics had on their team is undeniable.
    • Exhibit Company Overview
    • Exhibit Business Segment Overview
    • Exhibit Financial Updates
    • Exhibit Key Developments
  • By allowing users to access data themselves, self-service analytics reduces the chance of errors that can occur when data is manually entered, downloaded to a machine, or processed. While this is true in every industry, the accuracy and reliability of data is extremely relevant in healthcare.
    • Exhibit Company Overview
    • Exhibit Business Segment Overview
    • Exhibit Financial Updates
    • Exhibit Key Developments
  • For instance, consider Gilead Sciences, a research-based biopharmaceutical company. Here’s what Murali Vridhachalam, Head of Enterprise Data and Analytics, had to say about how self-service analytics has helped to improve the impact of their insights:
    • Exhibit Company Overview
    • Exhibit Business Segment Overview
    • Exhibit Financial Updates
    • Exhibit Key Developments
  • “I noticed there were a lot of different teams working on siloed data and analytics. Now, we have a holistic approach of initiating data-driven [insights] at Gilead. It's not a cliche….For example, a lot of things were dependent on a single BI team to create reports. We are trying to disrupt that culture by enabling self-service analytics.”
    • Exhibit Company Overview
    • Exhibit Business Segment Overview
    • Exhibit Financial Updates
    • Exhibit Key Developments
  • The democratization of data and rise of self-service analytics has the power to improve patient outcomes in healthcare.
    • Exhibit Company Overview
    • Exhibit Business Segment Overview
    • Exhibit Financial Updates
    • Exhibit Key Developments
  • KEY RESTRAINS
    • Exhibit Company Overview
    • Exhibit Business Segment Overview
    • Exhibit Financial Updates
    • Exhibit Key Developments
  • By allowing users to access data themselves, self-service analytics reduces the chance of errors that can occur when data is manually entered, downloaded to a machine, or processed. While this is true in every industry, the accuracy and reliability of data is extremely relevant in healthcare.
    • Exhibit Company Overview
    • Exhibit Business Segment Overview
    • Exhibit Financial Updates
    • Exhibit Key Developments
  • For instance, consider Gilead Sciences, a research-based biopharmaceutical company. Here’s what Murali Vridhachalam, Head of Enterprise Data and Analytics, had to say about how self-service analytics has helped to improve the impact of their insights:
    • Exhibit Company Overview
    • Exhibit Business Segment Overview
    • Exhibit Financial Updates
    • Exhibit Key Developments
  • “I noticed there were a lot of different teams working on siloed data and analytics. Now, we have a holistic approach of initiating data-driven [insights] at Gilead. It's not a cliche….For example, a lot of things were dependent on a single BI team to create reports. We are trying to disrupt that culture by enabling self-service analytics.”
    • Exhibit Company Overview
    • Exhibit Business Segment Overview
    • Exhibit Financial Updates
    • Exhibit Key Developments
  • The democratization of data and rise of self-service analytics has the power to improve patient outcomes in healthcare.
    • Exhibit Company Overview
    • Exhibit Business Segment Overview
    • Exhibit Financial Updates
    • Exhibit Key Developments
  • North America is one of the significant markets for self-service analytics, driven by the presence of major vendors and high adoption rates among enterprises. Europe and Asia Pacific are the fastest-growing markets for self-service analytics, driven by the increasing adoption of cloud-based solutions and the growing need for real-time data analysis.
    • Exhibit Company Overview
    • Exhibit Business Segment Overview
    • Exhibit Financial Updates
    • Exhibit Key Developments
  • Major players in the self-service analytics market are investing heavily in research and development to introduce new actuators to the market which are more reliable and efficient. They also adopt various strategies such as collaboration, merger, product launch, and acquisition. For instance, in November 2022, IBM launched new software, Business Analytics Enterprise, which consists of analysis tools, including budgeting, planning, reporting, dashboards, and forecasting, for users to make data-driven decisions quickly and navigate unpredictable disruption.
    • Exhibit Company Overview
    • Exhibit Business Segment Overview
    • Exhibit Financial Updates
    • Exhibit Key Developments
  • KEY MARKET SEGMENTS
    • Exhibit Company Overview
    • Exhibit Business Segment Overview
    • Exhibit Financial Updates
    • Exhibit Key Developments
  • By Deployment Type
    • Exhibit Company Overview
    • Exhibit Business Segment Overview
    • Exhibit Financial Updates
    • Exhibit Key Developments
  • On-Premises
    • Exhibit Company Overview
    • Exhibit Business Segment Overview
    • Exhibit Financial Updates
    • Exhibit Key Developments
  • Cloud
    • Exhibit Company Overview
    • Exhibit Business Segment Overview
    • Exhibit Financial Updates
    • Exhibit Key Developments
  • By End-Use
    • Exhibit Company Overview
    • Exhibit Business Segment Overview
    • Exhibit Financial Updates
    • Exhibit Key Developments
  • IT & Telecom
    • Exhibit Company Overview
    • Exhibit Business Segment Overview
    • Exhibit Financial Updates
    • Exhibit Key Developments
  • Retail & E-commerce
    • Exhibit Company Overview
    • Exhibit Business Segment Overview
    • Exhibit Financial Updates
    • Exhibit Key Developments
  • Energy and Utility
    • Exhibit Company Overview
    • Exhibit Business Segment Overview
    • Exhibit Financial Updates
    • Exhibit Key Developments
  • Healthcare
    • Exhibit Company Overview
    • Exhibit Business Segment Overview
    • Exhibit Financial Updates
    • Exhibit Key Developments
  • Media & Entertainment
    • Exhibit Company Overview
    • Exhibit Business Segment Overview
    • Exhibit Financial Updates
    • Exhibit Key Developments
  • BFSI sector
    • Exhibit Company Overview
    • Exhibit Business Segment Overview
    • Exhibit Financial Updates
    • Exhibit Key Developments
  • By Region
    • Exhibit Company Overview
    • Exhibit Business Segment Overview
    • Exhibit Financial Updates
    • Exhibit Key Developments
  • North America
    • Exhibit Company Overview
    • Exhibit Business Segment Overview
    • Exhibit Financial Updates
    • Exhibit Key Developments
  • U.S.
    • Exhibit Company Overview
    • Exhibit Business Segment Overview
    • Exhibit Financial Updates
    • Exhibit Key Developments
  • Canada
    • Exhibit Company Overview
    • Exhibit Business Segment Overview
    • Exhibit Financial Updates
    • Exhibit Key Developments
  • Europe
    • Exhibit Company Overview
    • Exhibit Business Segment Overview
    • Exhibit Financial Updates
    • Exhibit Key Developments
  • UK
    • Exhibit Company Overview
    • Exhibit Business Segment Overview
    • Exhibit Financial Updates
    • Exhibit Key Developments
  • Germany
    • Exhibit Company Overview
    • Exhibit Business Segment Overview
    • Exhibit Financial Updates
    • Exhibit Key Developments
  • France
    • Exhibit Company Overview
    • Exhibit Business Segment Overview
    • Exhibit Financial Updates
    • Exhibit Key Developments
  • Italy
    • Exhibit Company Overview
    • Exhibit Business Segment Overview
    • Exhibit Financial Updates
    • Exhibit Key Developments
  • Asia Pacific
    • Exhibit Company Overview
    • Exhibit Business Segment Overview
    • Exhibit Financial Updates
    • Exhibit Key Developments
  • Japan
    • Exhibit Company Overview
    • Exhibit Business Segment Overview
    • Exhibit Financial Updates
    • Exhibit Key Developments
  • China
    • Exhibit Company Overview
    • Exhibit Business Segment Overview
    • Exhibit Financial Updates
    • Exhibit Key Developments
  • India
    • Exhibit Company Overview
    • Exhibit Business Segment Overview
    • Exhibit Financial Updates
    • Exhibit Key Developments
  • Latin America
    • Exhibit Company Overview
    • Exhibit Business Segment Overview
    • Exhibit Financial Updates
    • Exhibit Key Developments
  • Brazil
    • Exhibit Company Overview
    • Exhibit Business Segment Overview
    • Exhibit Financial Updates
    • Exhibit Key Developments
  • Mexico
    • Exhibit Company Overview
    • Exhibit Business Segment Overview
    • Exhibit Financial Updates
    • Exhibit Key Developments
  • Argentina
    • Exhibit Company Overview
    • Exhibit Business Segment Overview
    • Exhibit Financial Updates
    • Exhibit Key Developments
  • Middle East & Africa
    • Exhibit Company Overview
    • Exhibit Business Segment Overview
    • Exhibit Financial Updates
    • Exhibit Key Developments
  • South Africa
    • Exhibit Company Overview
    • Exhibit Business Segment Overview
    • Exhibit Financial Updates
    • Exhibit Key Developments
  • Saudi Arabia
    • Exhibit Company Overview
    • Exhibit Business Segment Overview
    • Exhibit Financial Updates
    • Exhibit Key Developments
  • UAE
    • Exhibit Company Overview
    • Exhibit Business Segment Overview
    • Exhibit Financial Updates
    • Exhibit Key Developments
  • KEY MARKET PLAYERS
    • Exhibit Company Overview
    • Exhibit Business Segment Overview
    • Exhibit Financial Updates
    • Exhibit Key Developments
  • IBM
    • Exhibit Company Overview
    • Exhibit Business Segment Overview
    • Exhibit Financial Updates
    • Exhibit Key Developments
  • Microsoft
    • Exhibit Company Overview
    • Exhibit Business Segment Overview
    • Exhibit Financial Updates
    • Exhibit Key Developments
  • TATA Consultancy Services Limited
    • Exhibit Company Overview
    • Exhibit Business Segment Overview
    • Exhibit Financial Updates
    • Exhibit Key Developments
  • Infosys Limited
    • Exhibit Company Overview
    • Exhibit Business Segment Overview
    • Exhibit Financial Updates
    • Exhibit Key Developments
  • TABLEAU SOFTWARE, LLC,
    • Exhibit Company Overview
    • Exhibit Business Segment Overview
    • Exhibit Financial Updates
    • Exhibit Key Developments
  • Splunk Inc.
    • Exhibit Company Overview
    • Exhibit Business Segment Overview
    • Exhibit Financial Updates
    • Exhibit Key Developments
  • Oracle
    • Exhibit Company Overview
    • Exhibit Business Segment Overview
    • Exhibit Financial Updates
    • Exhibit Key Developments
  • Cloud Software Group, Inc.
    • Exhibit Company Overview
    • Exhibit Business Segment Overview
    • Exhibit Financial Updates
    • Exhibit Key Developments
  • Domo, Inc.
    • Exhibit Company Overview
    • Exhibit Business Segment Overview
    • Exhibit Financial Updates
    • Exhibit Key Developments
  • TARGIT
    • Exhibit Company Overview
    • Exhibit Business Segment Overview
    • Exhibit Financial Updates
    • Exhibit Key Developments

Methodology

For the Self-service Analytics Market, our research methodology involved a mixture of primary and secondary data sources. Key steps involved in the research process are listed below:

1. Information Procurement: This stage involved the procurement of Market data or related information via primary and secondary sources. The various secondary sources used included various company websites, annual reports, trade databases, and paid databases such as Hoover's, Bloomberg Business, Factiva, and Avention. Our team did 45 primary interactions Globally which included several stakeholders such as manufacturers, customers, key opinion leaders, etc. Overall, information procurement was one of the most extensive stages in our research process.

2. Information Analysis: This step involved triangulation of data through bottom-up and top-down approaches to estimate and validate the total size and future estimate of the Self-service Analytics Market.

3. Report Formulation: The final step entailed the placement of data points in appropriate Market spaces in an attempt to deduce viable conclusions.

4. Validation & Publishing: Validation is the most important step in the process. Validation & re-validation via an intricately designed process helped us finalize data points to be used for final calculations. The final Market estimates and forecasts were then aligned and sent to our panel of industry experts for validation of data. Once the validation was done the report was sent to our Quality Assurance team to ensure adherence to style guides, consistency & design.

Analyst Support

Customization Options

With the given market data, our dedicated team of analysts can offer you the following customization options are available for the Self-service Analytics Market:

Product Analysis: Product matrix, which offers a detailed comparison of the product portfolio of companies.

Regional Analysis: Further analysis of the Self-service Analytics Market for additional countries.

Competitive Analysis: Detailed analysis and profiling of additional Market players & comparative analysis of competitive products.

Go to Market Strategy: Find the high-growth channels to invest your marketing efforts and increase your customer base.

Innovation Mapping: Identify racial solutions and innovation, connected to deep ecosystems of innovators, start-ups, academics, and strategic partners.

Category Intelligence: Customized intelligence that is relevant to their supply Markets will enable them to make smarter sourcing decisions and improve their category management.

Public Company Transcript Analysis: To improve the investment performance by generating new alpha and making better-informed decisions.

Social Media Listening: To analyze the conversations and trends happening not just around your brand, but around your industry as a whole, and use those insights to make better Marketing decisions.

$5,300
BUY NOW GET FREE SAMPLE
Want to customize this report?

Our industry expert will work with you to provide you with customized data in a short amount of time.

REQUEST FREE CUSTOMIZATION

FAQs

The global market for Self-service Analytics was estimated to be valued at US$ XX Mn in 2021.

The global Self-service Analytics Market is estimated to grow at a CAGR of XX% by 2028.

The global Self-service Analytics Market is segmented on the basis of Deployment Type, End-Use, Region.

Based on region, the global Self-service Analytics Market is segmented into North America, Europe, Asia Pacific, Middle East & Africa and Latin America.

The key players operating in the global Self-service Analytics Market are e analytics encompasses tools and platforms that enable business users to explore and analyze data independently rather than relying on IT or data analysts to generate reports or dashboards. These tools often have user-friendly interfaces, drag-and-drop capability, and other features that allow users to build visualizations quickly and reports from data sources such as spreadsheets, databases, and other data repositories. , Self-service analytics is a rapidly growing trend in data analysis and business intelligence. As making decisions based on data becomes more vital for success, organizations must empower their employees to access and analyze data promptly. Some of the key factors responsible for the growth of the self-service analytics market include ease of use of analytics tools, self-service analytics tools have intuitive interfaces for non-IT professionals, and drag-and-drop functionality that allows users to build visualizations and dashboards quickly. Self-service analytics tools are typically less expensive than traditional business intelligence solutions. By giving business users direct access to data, self-service analytics tools help democratize data within organizations, enabling more people to make data-driven decisions. As data volumes and complexity grow, businesses are looking for tools to help them make sense of their data. Self-service analytics provides a way for businesses to unlock insights from their data which owes to demand in the self-service analytics market. , LATEST TRENDS , The volume of structured and unstructured data is increasing globally, which can be attributed to factors such as globalization, rising internet usage, increased use of social media platforms, and the booming e-commerce industry. , This is one of the major driving forces behind the adoption of service-service BI, especially considering the increased uptake of data analytics solutions by small and medium-sized organizations (SMEs). , Businesses can decentralize the process of business analysis with its help. Additionally, the market players are being given lucrative growth prospects by the growing adoption of cloud computing technologies in business intelligence. In addition, as governing bodies in many nations promote the use of digital payments, a significant increase in people switching to online payments has been observed. , Financial institutions like banks are therefore looking for technology solutions to increase the productivity of their current employees. This has a beneficial impact on how self-service BI is used globally, along with the increased demand for enterprises to be nimbler and maintain a competitive advantage in the market. , Owing to the need for modernizing business report analysis and modeling of data, a transition from complicated BI tools that only IT specialists could implement to self-service BI tools took place. Self-service Bl market witnessed a prominent adoption across various business fields such as marketing, sales, operations, human resource and finance attributed to detailed competitive analysis and ease of application for non-technical staff. , Self-service BI benefits the business users from non-analytical background to generate insights and data analysis. Self-service BI market is experiencing an increasing demand for the business fields attributed to its ability to transform business organizations into an efficient data-driven organization. Self-service BI market is projected to grow over the forecast period owing to its ability to decentralize the business analytical process! , The COVID-19 pandemic had a positive impact on the self-service analytics market. The pandemic highlighted the need for businesses to quickly access accurate data and insights to make informed decisions in a rapidly changing environment. As a result, there has been an increased demand for self-service analytics tools that allow non-technical users to access and analyze data quickly. In addition, technological advancements like AI and machine learning also result in the increased demand for self-service analytics. , KEY DRIVER , Users can quickly and easily access data, deriving answers and creating reports without waiting for someone else to do it for them. , This is especially true for factory14, a European consumer goods company focused on increasing the profitability for brands sold on Amazon. They’re brand management and operations teams were drowning in spreadsheets. These data silos were impacting their ability to keep up with product demand. , That’s when they decided to implement a true self-service analytics solution. Here’s how then Vice President of Analytics, Leon Tang, described the increased efficiency of self-service analytics: , “For someone like [the CBO] to just go into ThoughtSpot, type a few words into the search bar and pull the exact information he needs, just like that — is nothing short of amazing. Now people are using Excel a lot less. Instead, they’re finding the exact data they need with ThoughtSpot.” , factory14 has since undergone a successful acquisition, and Leon Tang has moved on to another opportunity as the Director of Data for Jobandtalent. However, the impact that self-service analytics had on their team is undeniable. , By allowing users to access data themselves, self-service analytics reduces the chance of errors that can occur when data is manually entered, downloaded to a machine, or processed. While this is true in every industry, the accuracy and reliability of data is extremely relevant in healthcare. , For instance, consider Gilead Sciences, a research-based biopharmaceutical company. Here’s what Murali Vridhachalam, Head of Enterprise Data and Analytics, had to say about how self-service analytics has helped to improve the impact of their insights: , “I noticed there were a lot of different teams working on siloed data and analytics. Now, we have a holistic approach of initiating data-driven [insights] at Gilead. It's not a cliche….For example, a lot of things were dependent on a single BI team to create reports. We are trying to disrupt that culture by enabling self-service analytics.” , The democratization of data and rise of self-service analytics has the power to improve patient outcomes in healthcare. , KEY RESTRAINS , By allowing users to access data themselves, self-service analytics reduces the chance of errors that can occur when data is manually entered, downloaded to a machine, or processed. While this is true in every industry, the accuracy and reliability of data is extremely relevant in healthcare. , For instance, consider Gilead Sciences, a research-based biopharmaceutical company. Here’s what Murali Vridhachalam, Head of Enterprise Data and Analytics, had to say about how self-service analytics has helped to improve the impact of their insights: , “I noticed there were a lot of different teams working on siloed data and analytics. Now, we have a holistic approach of initiating data-driven [insights] at Gilead. It's not a cliche….For example, a lot of things were dependent on a single BI team to create reports. We are trying to disrupt that culture by enabling self-service analytics.” , The democratization of data and rise of self-service analytics has the power to improve patient outcomes in healthcare. , North America is one of the significant markets for self-service analytics, driven by the presence of major vendors and high adoption rates among enterprises. Europe and Asia Pacific are the fastest-growing markets for self-service analytics, driven by the increasing adoption of cloud-based solutions and the growing need for real-time data analysis. , Major players in the self-service analytics market are investing heavily in research and development to introduce new actuators to the market which are more reliable and efficient. They also adopt various strategies such as collaboration, merger, product launch, and acquisition. For instance, in November 2022, IBM launched new software, Business Analytics Enterprise, which consists of analysis tools, including budgeting, planning, reporting, dashboards, and forecasting, for users to make data-driven decisions quickly and navigate unpredictable disruption. , KEY MARKET SEGMENTS , By Deployment Type , On-Premises , Cloud , By End-Use , IT & Telecom , Retail & E-commerce , Energy and Utility , Healthcare , Media & Entertainment , BFSI sector , By Region , North America , U.S. , Canada , Europe , UK , Germany , France , Italy , Asia Pacific , Japan , China , India , Latin America , Brazil , Mexico , Argentina , Middle East & Africa , South Africa , Saudi Arabia , UAE , KEY MARKET PLAYERS , IBM , Microsoft , TATA Consultancy Services Limited , Infosys Limited , TABLEAU SOFTWARE, LLC, , Splunk Inc. , Oracle , Cloud Software Group, Inc. , Domo, Inc. , TARGIT.

Request Free Customization

Want to customize this report? This report can be personalized according to your needs. Our analysts and industry experts will work directly with you to understand your requirements and provide you with customized data in a short amount of time. We offer $1000 worth of FREE customization at the time of purchase.

logo-images

Feedback From Our Clients

Self-service Analytics Market

Product ID: UCMIG45E2234

$5,300
BUY NOW GET FREE SAMPLE