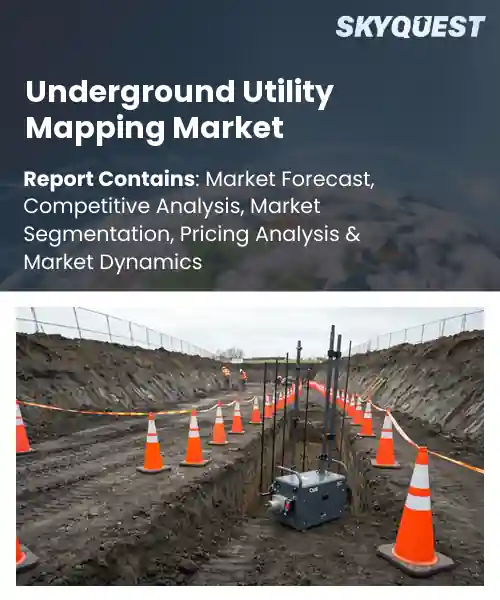
Underground Utility Mapping Market
Report ID: SQMIG20L2103
Report ID: SQMIG20L2103
[email protected]
USA +1 351-333-4748
Report ID:
SQMIG20L2103 |
Region:
Global |
Published Date: July, 2026
Pages:
157
|Tables:
123
|Figures:
77


Global Underground Utility Mapping Market size was valued at USD 1.75 Billion in 2024 and is poised to grow from USD 1.95 Billion in 2025 to USD 4.54 Billion by 2033, growing at a CAGR of 11.9% during the forecast period (2026-2033).
The global underground utility mapping market trends consists of technologies and services that identify, visualize and manage buried infrastructure, including water, gas, electrical and telecommunications lines. Accurate mapping reduces accidental strikes during construction, reduces service disruptions and improves public safety, making it an important part of urban development. The market was traditionally based on invasive excavation and manual surveying, but the market accelerated in data precision and speed with the adoption of ground-penetrating radar, electromagnetic induction, and LiDAR in the early 2000s. As an example, a 2015 New York City subway expansion used high-resolution radar to circumvent costly pipe repairs, illustrating how the demand has moved toward non-destructive and real-time solutions.
The underground utility mapping market growth is being driven by regulatory requirements for accurate information about what is under the ground, as governments worldwide are enacting tougher laws to prevent utility strikes. If municipalities start charging construction companies for accidentally hitting their lines, that will force construction companies to spend on sophisticated mapping platforms, creating a market for integrated software that feeds data to geographic information systems and allows for digital-twin modeling. One example is the 2022 Canadian infrastructure program, which mandates utility layers for each works project, resulting in a 35% increase in service contracts for companies that provide mapping analytics. The pressure from policy and the emergence of smart-city ecosystems create lucrative opportunities for vendors who can offer scalable and standard solutions.
How is AI enhancing accuracy in underground utility mapping?
AI is transforming the underground utility mapping market share process by integrating sensor data with advanced machine learning algorithms, which can distinguish between pipes, cables and other buried assets with much higher accuracy than traditional methods. Real time processing of ground penetrating radar, LiDAR and acoustic signals is incorporated to allow the system to filter out noise and automatically correct for positional errors. It is also learning from every project, constantly improving its ability to recognise complex network layouts. Integrated reporting tools that translate the AI output into actionable plans for crews on the ground also benefit stakeholders.
In January 2026 RodRadar launched an AI enhanced real time utility strike detection system, mapping subsurface networks with unprecedented clarity. AI-powered platforms are becoming the preferred choice as construction firms demand faster, error free site assessments, delivering clearer visualisations and reducing costly strikes. The solution accelerates surveys, reducing false alarms and assists the industry in keeping pace with an increasing demand for accurate underground mapping, increasing overall market efficiency and enabling faster project timelines.
Market snapshot - (2026-2033)
Global Market Size
USD 1.75 Billion
Largest Segment
Software
Fastest Growth
Services
Growth Rate
11.18% CAGR
To get more insights on this market click here to Request a Free Sample Report
Global underground utility mapping market is segmented by component, technology, application, end-use industry and region. Based on component, the market is segmented into software and services. Based on technology, the market is segmented into ground penetrating radar, electromagnetic induction, acoustic sensation, magnetic locating and others. Based on application, the market is segmented into telecommunication lines, electricity cables, gas pipelines, water pipelines, sewage pipes and others. Based on end-use industry, the market is segmented into construction, transportation infrastructure, oil and gas sector, municipalities and public works and others. Based on region, the market is segmented into North America, Europe, Asia Pacific, Latin America and Middle East & Africa.
The software segment is expected to dominate due to the analytical backbone that converts raw sensor data into actionable geospatial intelligence, allowing for the precise location of buried assets. Advanced algorithms, cloud integration and intuitive user interfaces reduce manual interpretation time, increase accuracy and allow for proactive maintenance planning. This capability corresponds to the industry need for digital twins and real time asset management, ensuring software is the core driver of the market across multiple phases of project throughout the industry.
Services segment is the fastest growing, owing to the increasing client demand for end to end mapping solutions. Managed surveys, data integration and consulting reduces the need for in house expertise enabling utilities to focus on core operations. This service-based model allows providers to accelerate market penetration and generate revenue.
Ground penetrating radar segment dominates as it provides highest resolution imaging and deepest penetration which can be used to detect non metallic and metallic utilities in different soil conditions. Its real-time profiling of subsurface reduces the risk of excavation, enables accurate design and meets stringent regulatory safety standards. That makes it the choice of preference for complex urban projects that require precision at each stage of the project cycle, enabling sound decision-making for all stakeholders.
Meanwhile, acoustic sensation segment is witnessing strongest growth as advancements in sensor fidelity and AI-powered signal processing improves detection of small diameter pipes and leaks. These innovations make it more applicable outside the traditional surveys, attracting utility operators looking for low cost low impact solutions. The emerging high resolution acoustic approach will open new market opportunities and drive further adoption.
To get detailed segments analysis, Request a Free Sample Report
North America’s leadership position is due to the combination of mature regulatory structures, high investment in infrastructure resilience, and advanced technological adoption across utility sectors. Strong public-private partnership supports ongoing enhancement of data standards and integration of advanced detection tools The market benefits from a wealth of talent in geospatial analytics and a proactive risk management culture that stresses accurate underground asset identification. The presence of a diverse range of legacy infrastructure facilitates the opportunity for modernization. A strong focus on safety and compliance drives the need for full mapping solutions that support complex urban and suburban development projects.
Underground utility mapping market outlook in the United States is propelled by extensive urban expansion and a heightened focus on infrastructure renewal. The regulatory environment emphasizes accurate asset documentation, prompting utilities to adopt cutting‑edge scanning and data management platforms. Collaborative initiatives among federal agencies, state regulators, and industry groups foster consistent standards, while a competitive technology ecosystem accelerates innovation. The emphasis on public safety and project efficiency reinforces the market’s momentum, encouraging investment in high‑resolution detection methods and integrated GIS solutions.
Underground utility mapping market forecast in Canada benefits from strong governmental commitment to infrastructure modernization and a proactive stance on safety standards. Collaborative frameworks between utility providers and municipal authorities support the adoption of sophisticated locating technologies. Emphasis on sustainable development and remote region accessibility encourages the deployment of advanced mapping tools that can operate under diverse environmental conditions. The market is further reinforced by a skilled workforce and a culture of continuous improvement that drives the integration of real‑time data analytics into planning and maintenance processes.
Europe’s rapid growth comes from tough rules on the environment and safety, and big plans to fix up cities which need good knowledge of what’s underground. Common rules in member states ensure similar quality of data and large public investments help with upgrading old utility networks. The focus on digital transformation in the region is accelerating the deployment of intelligent sensing solutions and interoperable data platforms. Innovative approaches are developed more quickly through collaborative research projects between universities, technology suppliers and utilities, further reinforcing Europe’s position as a hub of advanced underground utility mapping practices that improve project efficiency and risk mitigation.
Underground utility mapping market regional outlook in Germany is characterized by a mature regulatory landscape that mandates detailed asset records for new construction and retrofit projects. Robust engineering standards and a well‑established network of specialized service providers facilitate the adoption of high‑precision detection technologies. Collaborative partnerships between research institutes and industry drive continuous improvement of data integration methods, while a strong focus on sustainability encourages the use of non‑intrusive mapping techniques that minimize environmental impact. The market is further supported by a skilled technical workforce and a culture of rigorous quality assurance.
Underground utility mapping market regional forecast in the United Kingdom experiences accelerated growth due to ambitious infrastructure upgrade programs and a heightened focus on safety compliance. Governmental policies incentivize the use of advanced locating technologies to reduce excavation risks, while industry consortia work to standardize data exchange formats. The market is energized by a vibrant ecosystem of innovators delivering real‑time mapping solutions that integrate with broader digital construction platforms. Emphasis on reducing project delays and safeguarding public assets sustains strong demand for comprehensive underground utility intelligence.
Underground utility mapping market analysis in France is emerging alongside national initiatives to modernize utility networks and support resilient urban planning. Regulatory emphasis on accurate underground documentation encourages utilities to adopt sophisticated scanning and data visualization tools. Collaborative efforts between public agencies and technology firms foster the development of interoperable mapping solutions tailored to France’s diverse terrain. The market benefits from growing awareness of the cost and safety advantages of precise utility detection, prompting increased investment in cutting‑edge geophysical methods and integrated spatial data management.
Rapid urbanisation, massive infrastructure development and a strategic focus on technological innovation are benefiting the Asia Pacific region. As governments across the region place a premium on building resilience, utilities are investing in sophisticated detection and data integration solutions. The development of smart city projects leads to a demand for reliable data about underground infrastructure to enable efficient project execution. Collaborative ecosystems that combine local expertise with global technology partners are speeding up the adoption of state-of-the-art mapping tools, and an increasing focus on responsibility for the environment has led to greater use of non-intrusive techniques across the region.
Underground utility mapping market penetration in Japan benefits from a strong culture of precision engineering and a proactive approach to disaster mitigation. Regulatory frameworks emphasize detailed underground asset documentation, especially in densely populated urban zones prone to seismic activity. The market leverages cutting‑edge sensing technologies and sophisticated data analytics to enhance the accuracy of utility location efforts. Partnerships between leading technology firms and utility operators foster continuous improvement of mapping methodologies, supporting the nation’s commitment to safe and resilient infrastructure development.
Underground utility mapping industry in South Korea is propelled by aggressive infrastructure expansion and a national agenda focused on digital innovation. Government policies encourage the integration of advanced geospatial tools into utility management processes, while strong collaboration between research institutions and industry accelerates technology adoption. The market emphasizes non‑intrusive detection methods that align with sustainability goals, and the rapid deployment of smart city projects creates a steady demand for accurate underground utility data. A skilled engineering workforce underpins the region’s capacity to implement sophisticated mapping solutions across diverse development initiatives.
To know more about the market opportunities by region and country, click here to
Buy The Complete Report
Increasing Urban Infrastructure Projects
Adoption Of Cloud‑Based GIS Platforms
High Initial Capital Expenditure
Regulatory Data Privacy Concerns
Request Free Customization of this report to help us to meet your business objectives.
The underground utility mapping market is becoming increasingly competitive as established geospatial technology companies and specialized subsurface mapping providers invest in AI, cloud-based analytics, and advanced sensing technologies to improve underground asset detection and visualization. Strategic partnerships, acquisitions, and digital platform integrations are accelerating the adoption of ground-penetrating radar (GPR), electromagnetic locating, LiDAR, and digital twin technologies across infrastructure, utilities, and construction projects. At the same time, venture-backed startups are introducing AI-powered sensor fusion and cloud-based subsurface intelligence platforms, encouraging incumbents to expand their software capabilities and deliver more accurate, non-intrusive utility mapping solutions for increasingly complex infrastructure environments.
Top Player’s Company Profile
Recent Developments in the Underground Utility Mapping Market
SkyQuest’s ABIRAW (Advanced Business Intelligence, Research & Analysis Wing) is our Business Information Services team that Collects, Collates, Correlates, and Analyses the Data collected by means of Primary Exploratory Research backed by robust Secondary Desk research. As per SkyQuest analysis, the surge in urban infrastructure projects is the primary driver, pushing utilities and developers to adopt precise mapping to avoid costly strikes. A second driver is the rapid adoption of cloud‑based GIS platforms, which enable real‑time data sharing and collaborative planning. The market is led by North America, where mature regulations and strong investment in infrastructure resilience create steady demand. Within the market, the software segment dominates because it transforms raw sensor data into actionable geospatial intelligence. However, the high initial capital expenditure required for advanced equipment remains a significant restraint, especially for smaller firms seeking to modernize their operations.
| Report Metric | Details |
|---|---|
| Market size value in 2024 | USD 1.75 Billion |
| Market size value in 2033 | USD 4.54 Billion |
| Growth Rate | 11.18% |
| Base year | 2024 |
| Forecast period | (2026-2033) |
| Forecast Unit (Value) | USD Billion |
| Segments covered |
|
| Regions covered | North America (US, Canada), Europe (Germany, France, United Kingdom, Italy, Spain, Rest of Europe), Asia Pacific (China, India, Japan, Rest of Asia-Pacific), Latin America (Brazil, Rest of Latin America), Middle East & Africa (South Africa, GCC Countries, Rest of MEA) |
| Companies covered |
|
| Customization scope | Free report customization with purchase. Customization includes:-
|
To get a free trial access to our platform which is a one stop solution for all your data requirements for quicker decision making. This platform allows you to compare markets, competitors who are prominent in the market, and mega trends that are influencing the dynamics in the market. Also, get access to detailed SkyQuest exclusive matrix.
Table Of Content
Executive Summary
Market overview
Parent Market Analysis
Market overview
Market size
KEY MARKET INSIGHTS
COVID IMPACT
MARKET DYNAMICS & OUTLOOK
Market Size by Region
KEY COMPANY PROFILES
Methodology
For the Underground Utility Mapping Market, our research methodology involved a mixture of primary and secondary data sources. Key steps involved in the research process are listed below:
1. Information Procurement: This stage involved the procurement of Market data or related information via primary and secondary sources. The various secondary sources used included various company websites, annual reports, trade databases, and paid databases such as Hoover's, Bloomberg Business, Factiva, and Avention. Our team did 45 primary interactions Globally which included several stakeholders such as manufacturers, customers, key opinion leaders, etc. Overall, information procurement was one of the most extensive stages in our research process.
2. Information Analysis: This step involved triangulation of data through bottom-up and top-down approaches to estimate and validate the total size and future estimate of the Underground Utility Mapping Market.
3. Report Formulation: The final step entailed the placement of data points in appropriate Market spaces in an attempt to deduce viable conclusions.
4. Validation & Publishing: Validation is the most important step in the process. Validation & re-validation via an intricately designed process helped us finalize data points to be used for final calculations. The final Market estimates and forecasts were then aligned and sent to our panel of industry experts for validation of data. Once the validation was done the report was sent to our Quality Assurance team to ensure adherence to style guides, consistency & design.
Analyst Support
Customization Options
With the given market data, our dedicated team of analysts can offer you the following customization options are available for the Underground Utility Mapping Market:
Product Analysis: Product matrix, which offers a detailed comparison of the product portfolio of companies.
Regional Analysis: Further analysis of the Underground Utility Mapping Market for additional countries.
Competitive Analysis: Detailed analysis and profiling of additional Market players & comparative analysis of competitive products.
Go to Market Strategy: Find the high-growth channels to invest your marketing efforts and increase your customer base.
Innovation Mapping: Identify racial solutions and innovation, connected to deep ecosystems of innovators, start-ups, academics, and strategic partners.
Category Intelligence: Customized intelligence that is relevant to their supply Markets will enable them to make smarter sourcing decisions and improve their category management.
Public Company Transcript Analysis: To improve the investment performance by generating new alpha and making better-informed decisions.
Social Media Listening: To analyze the conversations and trends happening not just around your brand, but around your industry as a whole, and use those insights to make better Marketing decisions.
REQUEST FOR SAMPLE
 REQUEST FREE CUSTOMIZATION
Global Underground Utility Mapping Market size was valued at USD 1.75 Billion in 2024 and is poised to grow from USD 1.95 Billion in 2025 to USD 4.54 Billion by 2033, growing at a CAGR of 11.18% during the forecast period (2026-2033).
The underground utility mapping market is increasingly defined by intense competition as AI‑driven and IoT‑enabled newcomers pressure incumbent firms to accelerate technology rollouts, forge strategic alliances, and pursue acquisitions that broaden sensor portfolios and data‑analytics capabilities; recent examples include AI‑focused startups entering the space and established players announcing joint ventures to integrate real‑time subsurface data into digital‑twin platforms, intensifying the race for more accurate, non‑intrusive mapping solutions. 'Hexagon AB', 'Trimble Inc.', 'SPX Technologies, Inc.', 'Bentley Systems, Incorporated', 'Autodesk, Inc.', 'Topcon Corporation', 'Guideline Geo AB', 'Chc Navigation', 'Geophysical Survey Systems, Inc.', 'Mala Geoscience AB', 'Sensors & Software Inc.', 'Subsurface Maps LLC', 'Vermeer Corporation', 'Vivax-Metrotech Corp.', 'Proceq SA', 'RidgeRun LLC', 'Deeptech Ground Penetrating Radar LLC', 'Cardno Limited', 'T2 Utility Engineers Inc.', 'Ground Penetrating Radar Systems, LLC'
The surge in urban infrastructure projects is prompting municipalities and private developers to prioritize accurate underground utility mapping, as it mitigates construction delays and reduces the risk of accidental damage to existing services. By ensuring precise location data, stakeholders can streamline design processes, coordinate cross‑disciplinary teams, and adhere to increasingly stringent regulatory requirements. This proactive approach enhances project efficiency, safeguards public safety, and ultimately encourages broader adoption of advanced mapping solutions across expanding metropolitan zones. Consequently, investment in mapping technologies is gaining momentum among engineering firms seeking competitive advantage.
Smart Sensor Integration: The proliferation of low‑cost, high‑resolution sensors is driving utilities to embed smart detection capabilities directly within underground mapping workflows. Real‑time pressure, temperature, and vibration data are captured at pipe level, enriching spatial datasets with operational context. This convergence enables predictive maintenance, reduces unplanned outages, and supports dynamic asset optimization. As operators prioritize resilience, they are partnering with sensor manufacturers to create integrated platforms that continuously feed field intelligence into centralized GIS repositories, fostering a proactive infrastructure management culture and sustainability.
Why does North America Dominate the Global Underground Utility Mapping Market? |@12


Want to customize this report? This report can be personalized according to your needs. Our analysts and industry experts will work directly with you to understand your requirements and provide you with customized data in a short amount of time. We offer $1000 worth of FREE customization at the time of purchase.
Feedback From Our Clients


 USA (+1) 351-333-4748

