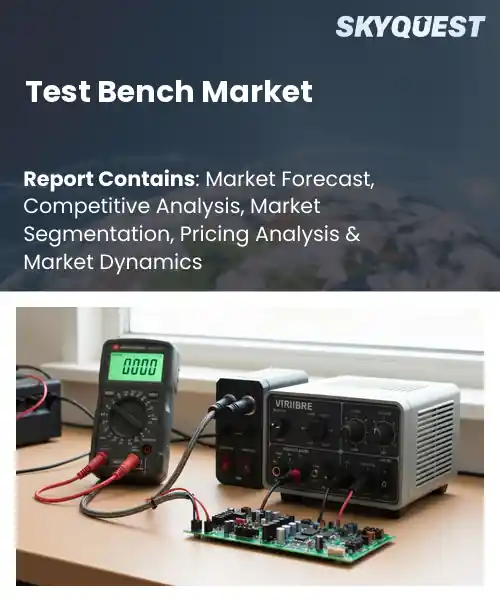
Test Bench Market
Report ID: SQMIG45J2621
Report ID: SQMIG45J2621
[email protected]
USA +1 351-333-4748
Report ID:
SQMIG45J2621 |
Region:
Global |
Published Date: July, 2026
Pages:
157
|Tables:
174
|Figures:
79


Global Test Bench Market size was valued at USD 3.36 Billion in 2024 and is poised to grow from USD 3.56 Billion in 2025 to USD 5.68 Billion by 2033, growing at a CAGR of 6.0% during the forecast period (2026-2033).
Building on this foundation, the next major factor shaping the test‑bench market is the surge in demand for connected systems, which forces manufacturers to accelerate verification cycles while maintaining safety standards. As vehicles and industrial equipment generate terabytes of sensor data, companies adopt hardware‑in‑the‑loop benches that couple streams with simulation models, enabling rapid identification of algorithmic flaws before deployment. For example, an EV maker reduced prototype iteration time by 30 % using a cloud‑based bench that evaluated battery‑management software under extreme temperature profiles. This capability shortens time‑to‑revenue and creates a market for test platforms, attracting investment in infrastructure and driving growth.
How is AI-driven automation reshaping the test bench market?
AI‑driven automation is redefining test benches by embedding machine‑learning models that predict failures, optimise test sequences and generate virtual test scenarios. Today most labs combine hardware rigs with software that learns from past runs, allowing engineers to shift from manual configuration to autonomous execution. This shift accelerates product validation, reduces human error and shortens time‑to‑market. Early adopters report smoother integration with digital twins, enabling real‑time correlation between simulated and physical results. As manufacturers seek higher efficiency, AI layers create adaptive test flows that self‑adjust based on sensor feedback, making the overall process more responsive and cost‑effective.In March 2024, a major test bench provider introduced an AI‑enabled automation suite that cuts setup time and boosts data analytics, supporting market growth through faster cycles and deeper insight. The platform integrates real‑time monitoring with predictive algorithms, allowing engineers to anticipate issues before they arise and streamline validation pipelines.
Market snapshot - (2026-2033)
Global Market Size
USD 3.36 Billion
Largest Segment
PCIe Adapter Cards
Fastest Growth
M.2 Adapter Cards
Growth Rate
6.0% CAGR
To get more insights on this market click here to Request a Free Sample Report
Global test bench market is segmented by interface connection form factor, wireless communication generation standard, frequency band support, device integration form factor, end user focus application, distribution channel and region. Based on interface connection form factor, the market is segmented into PCIe Adapter Cards, M.2 Adapter Cards, Mini PCIe Cards and USB Hardware Adapters. Based on wireless communication generation standard, the market is segmented into Wi-Fi 5 Cards, Wi-Fi 6 Cards, Wi-Fi 6E Cards and Wi-Fi 7 Cards. Based on frequency band support, the market is segmented into Single Band Cards, Dual Band Cards and Tri-Band Cards. Based on device integration form factor, the market is segmented into Desktop Computer Integration, Laptop Computer Integration and Industrial Hardware Integration. Based on end user focus application, the market is segmented into Consumer Gaming Computer Systems, Home Office Personal Desktop Use, Enterprise Commercial Corporate Stations and Industrial Automation Terminals. Based on distribution channel, the market is segmented into Online Computer Component E-Tailers, Brick and Mortar Electronics Stores and Direct B2B Procurement Contracts. Based on region, the market is segmented into North America, Europe, Asia Pacific, Latin America and Middle East & Africa.
PCIe Adapter Cards segment dominates because they provide the highest bandwidth and lowest latency required for rigorous validation of high performance compute modules. Test benches rely on deterministic data throughput to simulate real world loads, and PCIe’s native integration with server grade processors simplifies system architecture. This alignment with performance critical testing workflows drives widespread adoption among OEMs and validation labs, cementing its leading role in the market and ensuring repeatable results through standardized interfaces.
Meanwhile, M.2 Adapter Cards are witnessing the strongest growth momentum in the test bench market because their compact form factor enables high density testing rigs for emerging edge AI devices. The shrinking footprint aligns with lab space constraints while maintaining sufficient throughput, encouraging designers to adopt M.2 solutions for next generation prototype validation and accelerating market expansion.
Wi Fi 6 Cards segment leads because they balance advanced multi user capabilities with broad device compatibility, making them the preferred choice for validation of current enterprise and consumer networking products. Test benches require realistic traffic handling and power efficiency, and Wi Fi 6 provides the necessary throughput and latency improvements without the complexity of newer standards. This practicality drives extensive deployment across verification labs, reinforcing its central position in the market.
On the other hand, Wi Fi 7 Cards are emerging as the key high growth area in the test bench market because they introduce ultra high throughput and exceptionally low latency suited for 8K streaming and immersive XR workloads. Early adopters are integrating these cards to future proof validation platforms, sparking investment in advanced testing tools and expanding market opportunities.
To get detailed segments analysis, Request a Free Sample Report
North America benefits from deep engineering expertise, mature automotive supply chains, strong research institutions, and extensive investment in advanced manufacturing. The presence of leading original equipment manufacturers and a collaborative ecosystem between academia, government, and industry fuels continuous innovation in testing technologies. Robust regulatory frameworks encourage rigorous validation processes, reinforcing demand for sophisticated test benches. The market also leverages high adoption of digital twins and data analytics, enabling more efficient design cycles. Moreover, a culture of safety and reliability prioritizes thorough performance verification, cementing North America’s leadership position in the global test bench landscape.
Test Bench Market in the United States is characterized by a concentration of pioneering firms that integrate cutting‑edge simulation tools with physical testing platforms. Strong ties between defense, aerospace, and automotive sectors create cross‑industry knowledge transfer, accelerating technology adoption. Academic research centers provide a pipeline of talent and collaborative projects that enrich solution development. This ecosystem sustains a high level of sophistication and responsiveness to evolving engineering requirements.
Test Bench Market in Canada leverages its reputation for precision engineering and a supportive innovation policy environment. Collaborative clusters linking universities, government labs, and niche manufacturers foster bespoke testing solutions for renewable energy and automotive applications. Emphasis on sustainability and low‑emission technologies drives the creation of specialized test rigs. The combination of skilled workforce and strategic public‑private partnerships enhances the country’s capability to serve both domestic and international customers.
Europe’s expansion is propelled by a strong emphasis on sustainability, stringent emissions regulations, and a collaborative industrial culture. Leading automotive hubs integrate advanced test bench capabilities to accelerate electrification and autonomous vehicle development. Significant research funding encourages integration of virtual testing and real‑world validation, creating hybrid testing environments. The presence of mature supply chains across Germany, the United Kingdom, and France supports rapid prototyping and scaling of innovative solutions. Moreover, cross‑border initiatives and standardization efforts facilitate knowledge sharing, reducing time to market for new technologies. This confluence of regulatory pressure, technical expertise, and collaborative networks fuels the swift growth of Europe’s test bench sector.
Test Bench Market in Germany reflects the country’s deep automotive engineering heritage and a focus on high‑performance validation. Integrated laboratories combine mechanical testing with advanced sensor analytics, supporting the rapid rollout of electric powertrains. Strong collaboration between major manufacturers and specialized suppliers creates a seamless flow of innovation. Government incentives for low‑emission development further stimulate investment in sophisticated testing infrastructure, reinforcing Germany’s dominant role in the European landscape.
Test Bench Market in the United Kingdom is distinguished by a fast‑moving ecosystem that blends automotive expertise with cutting‑edge software development. Emerging start‑ups and established firms alike adopt modular test solutions to accelerate autonomous system verification. Academic centers excel in digital twin research, feeding advanced methodologies into industry practice. A supportive regulatory environment encourages early adoption of novel testing approaches, positioning the United Kingdom as a rapid growth leader within Europe.
Test Bench Market in France is evolving through a focus on emerging mobility concepts and renewable energy integration. Collaborative clusters bring together automotive manufacturers, aerospace players, and research institutes to develop versatile testing rigs. Emphasis on modularity and adaptability enables swift response to changing market demands. Governmental support for green technology innovation nurtures the creation of specialized test environments, allowing France to emerge as a rising contributor to the European test bench ecosystem.
Asia Pacific is strengthening its position by leveraging rapid technological adoption, extensive manufacturing capacity, and a growing emphasis on smart mobility. Nations such as Japan and South Korea invest heavily in integrating robotics, AI, and high‑precision instrumentation into test bench solutions, enhancing accuracy and throughput. The region benefits from close proximity to major component suppliers, enabling tight feedback loops between design and testing. Collaborative government programmes promote joint research between universities and industry, fostering innovative testing methodologies. Rising demand for electric and autonomous vehicles fuels the need for sophisticated validation platforms, prompting manufacturers to upgrade capabilities. This combination of advanced technology integration, supply chain efficiency, and supportive policy frameworks propels Asia Pacific’s ascent in the global test bench arena.
Test Bench Market in Japan blends meticulous engineering practices with a strong tradition of automotive excellence. Advanced robotics and sensor fusion are embedded within testing facilities to support high‑precision performance evaluation. Collaborative networks linking universities, research institutes, and manufacturers accelerate the deployment of cutting‑edge validation tools. Government initiatives encourage the development of electric vehicle testing standards, further enhancing system robustness. This synergy of precision, innovation, and strategic support solidifies Japan’s influential role in the regional market.
Test Bench Market in South Korea is driven by a dynamic semiconductor and electronics foundation that underpins sophisticated testing technologies. Manufacturers prioritize integration of AI‑enabled diagnostics and rapid prototyping to shorten development cycles. Close cooperation between automotive firms and technology providers creates bespoke test solutions tailored to emerging mobility trends. National policies promoting green transportation encourage investment in advanced validation infrastructure. This blend of high‑tech expertise and proactive policy fosters a robust environment for continuous growth in the test bench sector.
To know more about the market opportunities by region and country, click here to
Buy The Complete Report
Increasing Adoption Of Digital Twins
Growing Demand For Real-Time Validation
High Cost Of Test Equipment
Complex Integration With Legacy Systems
Request Free Customization of this report to help us to meet your business objectives.
Competition in the global test bench market intensifies as OEMs seek faster validation cycles. Key players accelerate through M&A, such as Keysight’s purchase of an AI‑driven test automation startup, and strategic partnerships like National Instruments teaming with Microsoft Azure for cloud‑based testing. Concurrently, firms invest in tech innovation, exemplified by Teradyne’s launch of AI‑enhanced test benches.
Top Player’s Company Profile
Recent Developments
SkyQuest’s ABIRAW (Advanced Business Intelligence, Research & Analysis Wing) is our Business Information Services team that Collects, Collates, Correlates, and Analyses the Data collected by means of Primary Exploratory Research backed by robust Secondary Desk research. As per SkyQuest analysis the global test bench market is projected to rise to $5.68 billion by 2033, driven chiefly by the increasing adoption of digital twins that let manufacturers catch design flaws early and shorten development cycles. A second strong catalyst is the growing demand for real‑time validation, which pushes firms to buy high‑speed platforms that can capture and analyse data instantly. The market is held back by the high cost of test equipment, which makes entry difficult for smaller players. North America remains the dominant region thanks to its deep engineering base and ample capital, while PCIe adapter cards dominate the segment landscape by offering the bandwidth and latency needed for demanding validation tasks.
| Report Metric | Details |
|---|---|
| Market size value in 2024 | USD 3.36 Billion |
| Market size value in 2033 | USD 5.68 Billion |
| Growth Rate | 6.0% |
| Base year | 2024 |
| Forecast period | (2026-2033) |
| Forecast Unit (Value) | USD Billion |
| Segments covered |
|
| Regions covered | North America (US, Canada), Europe (Germany, France, United Kingdom, Italy, Spain, Rest of Europe), Asia Pacific (China, India, Japan, Rest of Asia-Pacific), Latin America (Brazil, Rest of Latin America), Middle East & Africa (South Africa, GCC Countries, Rest of MEA) |
| Companies covered |
|
| Customization scope | Free report customization with purchase. Customization includes:-
|
To get a free trial access to our platform which is a one stop solution for all your data requirements for quicker decision making. This platform allows you to compare markets, competitors who are prominent in the market, and mega trends that are influencing the dynamics in the market. Also, get access to detailed SkyQuest exclusive matrix.
Table Of Content
Executive Summary
Market overview
Parent Market Analysis
Market overview
Market size
KEY MARKET INSIGHTS
COVID IMPACT
MARKET DYNAMICS & OUTLOOK
Market Size by Region
KEY COMPANY PROFILES
Methodology
For the Test Bench Market, our research methodology involved a mixture of primary and secondary data sources. Key steps involved in the research process are listed below:
1. Information Procurement: This stage involved the procurement of Market data or related information via primary and secondary sources. The various secondary sources used included various company websites, annual reports, trade databases, and paid databases such as Hoover's, Bloomberg Business, Factiva, and Avention. Our team did 45 primary interactions Globally which included several stakeholders such as manufacturers, customers, key opinion leaders, etc. Overall, information procurement was one of the most extensive stages in our research process.
2. Information Analysis: This step involved triangulation of data through bottom-up and top-down approaches to estimate and validate the total size and future estimate of the Test Bench Market.
3. Report Formulation: The final step entailed the placement of data points in appropriate Market spaces in an attempt to deduce viable conclusions.
4. Validation & Publishing: Validation is the most important step in the process. Validation & re-validation via an intricately designed process helped us finalize data points to be used for final calculations. The final Market estimates and forecasts were then aligned and sent to our panel of industry experts for validation of data. Once the validation was done the report was sent to our Quality Assurance team to ensure adherence to style guides, consistency & design.
Analyst Support
Customization Options
With the given market data, our dedicated team of analysts can offer you the following customization options are available for the Test Bench Market:
Product Analysis: Product matrix, which offers a detailed comparison of the product portfolio of companies.
Regional Analysis: Further analysis of the Test Bench Market for additional countries.
Competitive Analysis: Detailed analysis and profiling of additional Market players & comparative analysis of competitive products.
Go to Market Strategy: Find the high-growth channels to invest your marketing efforts and increase your customer base.
Innovation Mapping: Identify racial solutions and innovation, connected to deep ecosystems of innovators, start-ups, academics, and strategic partners.
Category Intelligence: Customized intelligence that is relevant to their supply Markets will enable them to make smarter sourcing decisions and improve their category management.
Public Company Transcript Analysis: To improve the investment performance by generating new alpha and making better-informed decisions.
Social Media Listening: To analyze the conversations and trends happening not just around your brand, but around your industry as a whole, and use those insights to make better Marketing decisions.
REQUEST FOR SAMPLE
 REQUEST FREE CUSTOMIZATION


Want to customize this report? This report can be personalized according to your needs. Our analysts and industry experts will work directly with you to understand your requirements and provide you with customized data in a short amount of time. We offer $1000 worth of FREE customization at the time of purchase.
Feedback From Our Clients


 USA (+1) 351-333-4748

