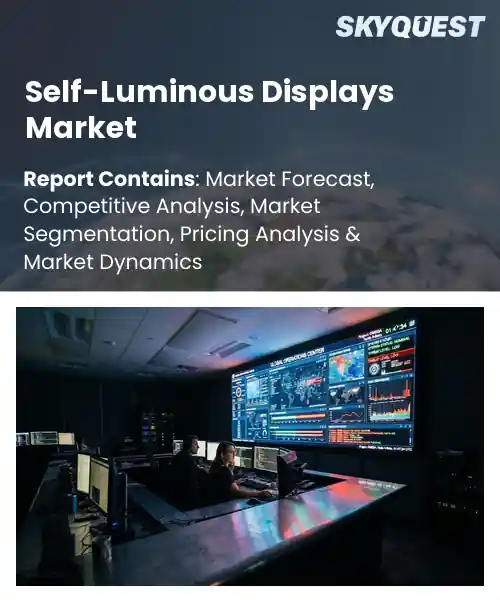
Self-Luminous Displays Market
Report ID: SQMIG45K2512
Report ID: SQMIG45K2512
[email protected]
USA +1 351-333-4748
Report ID:
SQMIG45K2512 |
Region:
Global |
Published Date: October, 2026
Pages:
157
|Tables:
95
|Figures:
76


Global Self-Luminous Displays Market size was valued at USD 890.0 Million in 2024 and is poised to grow from USD 1016.38 Million in 2025 to USD 2940.26 Million by 2033, growing at a CAGR of 14.2% during the forecast period (2026-2033).
The self‑luminous displays market encompasses panels that generate light internally without backlighting, such as OLED, micro‑LED, and quantum‑dot LED technologies. Its relevance lies in delivering higher contrast ratios, thinner form factors, and flexible designs that traditional LCDs cannot match, which fuels demand across smartphones, automotive dashboards, and large‑area signage. A primary driver has been the decline in material costs and manufacturing yields, allowing OEMs to replace conventional screens with brighter, more power‑efficient alternatives. Since the early 2010s, OLED adoption in flagship phones demonstrated consumer appetite, while recent micro‑LED prototypes in stadium screens illustrate the market’s evolution toward larger, high‑resolution installations. The next pivotal factor driving the self‑luminous displays market is the merging of content demand with substrate advances, opening application domains. Streaming services push HDR and 4K, compelling manufacturers to deliver panels with wide color gamuts and brightness, which fuels roll‑to‑roll OLED lines that cut costs and enable curved TVs and wearables. Automotive OEMs embed curved micro‑LED clusters in instrument panels, improving sunlight readability and lowering weight, while retailers adopt ultra‑thin LED signage to draw foot traffic with visuals. These shifts create a feedback loop where user expectations accelerate technology refinement, expanding the market beyond electronics into transportation and advertising.
How is AI-driven automation influencing growth in the self-luminous displays market?
AI-driven automation is reshaping the self‑luminous displays market by streamlining design, manufacturing and quality control. Machine‑learning models now predict optimal pixel layouts, reducing prototype cycles and enabling designers to explore novel form factors quickly. In production lines, computer vision inspects each microLED or OLED element in real time, catching defects that human eyes might miss and allowing immediate adjustments. Predictive maintenance algorithms schedule equipment service before breakdowns occur, keeping factories running at high capacity. These capabilities lower costs, accelerate time‑to‑market and make it easier for brands to launch brighter, thinner screens for wearables, automotive dashboards and large‑area signage.Samsung Display announced an AI‑optimized microLED production line in June 2024, cutting defect rates and boosting output speed. The integration of real‑time learning algorithms enables faster scaling of high‑brightness panels, reinforcing market momentum and expanding applications across consumer electronics and automotive displays.
Market snapshot - (2026-2033)
Global Market Size
USD 890.0 Million
Largest Segment
OLED Displays
Fastest Growth
MicroLED Displays
Growth Rate
14.2% CAGR
To get more insights on this market click here to Request a Free Sample Report
Global self-luminous displays market is segmented by display technology, display type, application and region. Based on display technology, the market is segmented into OLED Displays, MicroLED Displays, Electroluminescent Displays, Vacuum Fluorescent Displays and Other Self-Luminous Technologies. Based on display type, the market is segmented into Flexible Displays, Rigid Displays and Transparent Displays. Based on application, the market is segmented into Consumer Electronics, Automotive Displays, Healthcare & Medical Equipment, Industrial Equipment, Signage & Advertising and Other Applications. Based on region, the market is segmented into North America, Europe, Asia Pacific, Latin America and Middle East & Africa.
OLED displays segment dominates because its ability to deliver vivid colors, deep blacks, and thin form factors aligns tightly with consumer expectations for premium visual experiences. The technology’s inherent flexibility and energy efficiency enable integration into a wide range of devices, fostering strong designer preference. Continuous improvements in material stability and manufacturing yields further reinforce its market leadership, creating a virtuous cycle of adoption and innovation across global ecosystems today.
However, MicroLED displays are witnessing the strongest growth momentum because their superior brightness, long lifespan, and resistance to burn in are unlocking new high performance use cases. Emerging demand from premium wearables, augmented reality headsets, and next generation signage is accelerating investment, positioning MicroLED as a catalyst for future market expansion.
Flexible displays segment stands out because its bendable nature enables integration onto curved and wearable surfaces, meeting rising consumer demand for adaptable form factors. The technology reduces device thickness and weight, enhancing ergonomics while preserving image quality. Its compatibility with roll to roll manufacturing drives cost efficiencies, fostering broader adoption across emerging product categories including foldable smartphones, curved automotive dashboards, and interactive textile interfaces, which collectively expand the ecosystem.
Meanwhile, Transparent displays are emerging as the key high growth area because they enable seamless integration of visual output onto glass surfaces without obstructing view. Their adoption in smart windows, heads up displays, and retail vitrines is spurring design innovation, while improvements in visibility and power consumption are unlocking new commercial opportunities that accelerate overall market expansion.
To get detailed segments analysis, Request a Free Sample Report
Asia Pacific dominates the global Self-Luminous Displays market through a blend of advanced engineering expertise and strong consumer appetite for premium visual experiences. Japan and South Korea lead in OLED and micro‑LED innovation, delivering products that set industry benchmarks. A mature semiconductor ecosystem, sophisticated materials research, and tight collaboration between hardware makers and content creators streamline the supply chain. High adoption rates of premium smartphones, automotive infotainment, and immersive entertainment platforms sustain robust demand. Government initiatives that nurture high‑tech manufacturing and a culture of continuous improvement reinforce the region’s leadership. Export‑focused manufacturers supply cutting‑edge panels to global brands, extending influence on worldwide design trends, while university‑industry partnerships accelerate the move from prototype to mass production, ensuring a steady pipeline of next‑generation display solutions.
Self-Luminous Displays Market in Japan thrives on a legacy of precision manufacturing and a deep pool of display engineers. Leading firms integrate cutting‑edge OLED processes with rigorous quality standards, attracting premium device makers worldwide. Close ties between research institutes and industry accelerate material breakthroughs, while consumer preference for high‑resolution devices sustains demand. The ecosystem benefits from supportive policy frameworks that encourage investment in next‑generation display technologies, reinforcing Japan’s reputation as a hub of visual innovation.
Self-Luminous Displays Market in South Korea is propelled by R&D investment and a strong electronics manufacturing base. Companies excel in scaling micro‑LED and flexible OLED technologies, positioning the nation as a key supplier for premium smartphones and automotive displays. Collaborative clusters linking universities, research labs, and manufacturers foster rapid prototyping and technology transfer. Domestic demand for cutting‑edge consumer electronics fuels growth, while export‑oriented strategies expand South Korea’s influence across global display supply chains.
North America experiences rapid expansion of the Self-Luminous Displays market due to a confluence of high consumer spending on premium electronics and strong demand from emerging automotive and entertainment sectors. The United States leads with extensive R&D ecosystems that translate cutting‑edge OLED and micro‑LED research into commercial products, while Canada contributes robust design expertise and a growing focus on sustainable manufacturing. Content creators and streaming platforms drive the need for vivid, high‑contrast displays, encouraging manufacturers to innovate. Additionally, the region benefits from substantial venture capital support for start‑ups specializing in flexible and transparent display technologies, fostering a pipeline of next‑generation solutions. Collaborative partnerships between technology firms, automotive OEMs, and academic institutions further accelerate adoption, positioning North America as a dynamic hub for self‑luminous display growth.
Self-Luminous Displays Market in the United States is driven by a deep pool of technology talent and a culture of rapid commercialization. Leading firms translate advanced OLED research into high‑volume production for smartphones, televisions, and automotive dashboards. Strong venture capital ecosystems fund innovative start‑ups exploring flexible and transparent display formats. Close collaboration between universities, research labs, and industry accelerates technology transfer, while consumer demand for immersive visual experiences sustains a vibrant market environment.
Self-Luminous Displays Market in Canada benefits from a strong design and engineering community focused on sustainable manufacturing. Canadian firms develop energy‑efficient OLED modules for professional displays and niche automotive applications. Government incentives encourage research collaborations between universities and industry, fostering breakthroughs in flexible substrate technologies. Growing domestic demand for high‑quality visual solutions in education, healthcare, and media production further supports the market, positioning Canada as a contributor to the broader North American display ecosystem.
Europe strengthens its position in the Self-Luminous Displays market through a combination of deep engineering expertise, stringent quality standards, and a strategic focus on sustainable production. Germany leads with precision manufacturing and a robust automotive supply chain that integrates high‑performance OLED and micro‑LED panels into next‑generation vehicle interfaces. The United Kingdom leverages its creative design heritage and a strong software ecosystem to develop immersive display solutions for entertainment and professional visualization. France contributes advanced materials research and a growing emphasis on eco‑friendly manufacturing processes, driving the adoption of energy‑efficient display technologies. Collaborative cross‑border initiatives, supported by EU research funding, accelerate technology transfer and standardization, while a mature regulatory framework ensures reliability and safety, collectively reinforcing Europe’s significant competitive edge in the global self‑luminous display arena.
Self-Luminous Displays Market in Germany is anchored by world‑class precision engineering and a strong automotive electronics sector. German manufacturers excel at integrating high‑brightness OLED and micro‑LED modules into vehicle dashboards and advanced driver‑assistance systems. Collaborative research institutes drive material innovations that ensure continual improvement of efficiency and durability. The emphasis on reliability and rigorous certification processes ensures that German‑produced displays meet the exacting standards of both automotive OEMs and premium globally consumer electronics brands.
Self-Luminous Displays Market in the United Kingdom blends cutting‑edge visual technology with a strong creative and media sector. British firms specialize in high‑resolution OLED panels for broadcasting, gaming, and immersive virtual experiences. Close ties between design studios, software developers, and hardware manufacturers accelerate the creation of interactive display solutions. Emphasis on sustainability drives future‑oriented research into low‑power consumption and recyclable materials, positioning the United Kingdom as a hub for innovative, environmentally conscious display applications.
Self-Luminous Displays Market in France is driven by advanced materials science and a growing emphasis on eco‑friendly production. French companies lead in developing high‑efficiency OLED phosphors and flexible substrates that reduce energy consumption. Strong collaboration between research laboratories and industrial partners accelerates commercialization of lightweight, transparent display technologies. The market also continually benefits from a highly skilled, vibrant European design community that integrates these innovations into luxury consumer electronics and sophisticated architectural lighting solutions.
To know more about the market opportunities by region and country, click here to
Buy The Complete Report
Increasing Adoption Of OLED Technology
Growing Demand For Energy Efficient Displays
High Production Costs Limit Expansion
Complex Integration Challenges Reduce Adoption
Request Free Customization of this report to help us to meet your business objectives.
The self‑luminous displays market is shaped by intense rivalry among established manufacturers and emerging players, driving rapid product differentiation and accelerated adoption in automotive, consumer electronics, and signage. Competitive pressure is prompting firms to pursue strategic acquisitions, form joint development agreements, and invest heavily in next‑generation OLED and micro‑LED technologies to secure premium positioning and expand ecosystem partnerships.
Top Player’s Company Profile
Recent Developments
SkyQuest’s ABIRAW (Advanced Business Intelligence, Research & Analysis Wing) is our Business Information Services team that Collects, Collates, Correlates, and Analyses the Data collected by means of Primary Exploratory Research backed by robust Secondary Desk research. As per SkyQuest analysis, the self‑luminous displays market is expanding rapidly, propelled primarily by the increasing adoption of OLED technology which delivers vivid colors, deep blacks and thin form factors that meet modern consumer expectations. A second strong catalyst is the growing demand for energy‑efficient displays as manufacturers and end‑users seek lower power consumption and sustainability credentials. The market is still constrained by high production costs that keep pricing above that of conventional back‑lit panels, limiting adoption in price‑sensitive segments. Asia Pacific dominates the landscape thanks to advanced engineering ecosystems and strong consumer appetite, while OLED displays remain the leading segment, outpacing micro‑LED and other self‑luminous technologies.
| Report Metric | Details |
|---|---|
| Market size value in 2024 | USD 890.0 Million |
| Market size value in 2033 | USD 2940.26 Million |
| Growth Rate | 14.2% |
| Base year | 2024 |
| Forecast period | (2026-2033) |
| Forecast Unit (Value) | USD Million |
| Segments covered |
|
| Regions covered | North America (US, Canada), Europe (Germany, France, United Kingdom, Italy, Spain, Rest of Europe), Asia Pacific (China, India, Japan, Rest of Asia-Pacific), Latin America (Brazil, Rest of Latin America), Middle East & Africa (South Africa, GCC Countries, Rest of MEA) |
| Companies covered |
|
| Customization scope | Free report customization with purchase. Customization includes:-
|
To get a free trial access to our platform which is a one stop solution for all your data requirements for quicker decision making. This platform allows you to compare markets, competitors who are prominent in the market, and mega trends that are influencing the dynamics in the market. Also, get access to detailed SkyQuest exclusive matrix.
Table Of Content
Executive Summary
Market overview
Parent Market Analysis
Market overview
Market size
KEY MARKET INSIGHTS
COVID IMPACT
MARKET DYNAMICS & OUTLOOK
Market Size by Region
KEY COMPANY PROFILES
Methodology
For the Self-Luminous Displays Market, our research methodology involved a mixture of primary and secondary data sources. Key steps involved in the research process are listed below:
1. Information Procurement: This stage involved the procurement of Market data or related information via primary and secondary sources. The various secondary sources used included various company websites, annual reports, trade databases, and paid databases such as Hoover's, Bloomberg Business, Factiva, and Avention. Our team did 45 primary interactions Globally which included several stakeholders such as manufacturers, customers, key opinion leaders, etc. Overall, information procurement was one of the most extensive stages in our research process.
2. Information Analysis: This step involved triangulation of data through bottom-up and top-down approaches to estimate and validate the total size and future estimate of the Self-Luminous Displays Market.
3. Report Formulation: The final step entailed the placement of data points in appropriate Market spaces in an attempt to deduce viable conclusions.
4. Validation & Publishing: Validation is the most important step in the process. Validation & re-validation via an intricately designed process helped us finalize data points to be used for final calculations. The final Market estimates and forecasts were then aligned and sent to our panel of industry experts for validation of data. Once the validation was done the report was sent to our Quality Assurance team to ensure adherence to style guides, consistency & design.
Analyst Support
Customization Options
With the given market data, our dedicated team of analysts can offer you the following customization options are available for the Self-Luminous Displays Market:
Product Analysis: Product matrix, which offers a detailed comparison of the product portfolio of companies.
Regional Analysis: Further analysis of the Self-Luminous Displays Market for additional countries.
Competitive Analysis: Detailed analysis and profiling of additional Market players & comparative analysis of competitive products.
Go to Market Strategy: Find the high-growth channels to invest your marketing efforts and increase your customer base.
Innovation Mapping: Identify racial solutions and innovation, connected to deep ecosystems of innovators, start-ups, academics, and strategic partners.
Category Intelligence: Customized intelligence that is relevant to their supply Markets will enable them to make smarter sourcing decisions and improve their category management.
Public Company Transcript Analysis: To improve the investment performance by generating new alpha and making better-informed decisions.
Social Media Listening: To analyze the conversations and trends happening not just around your brand, but around your industry as a whole, and use those insights to make better Marketing decisions.
REQUEST FOR SAMPLE
 REQUEST FREE CUSTOMIZATION


Want to customize this report? This report can be personalized according to your needs. Our analysts and industry experts will work directly with you to understand your requirements and provide you with customized data in a short amount of time. We offer $1000 worth of FREE customization at the time of purchase.
Feedback From Our Clients


 USA (+1) 351-333-4748

