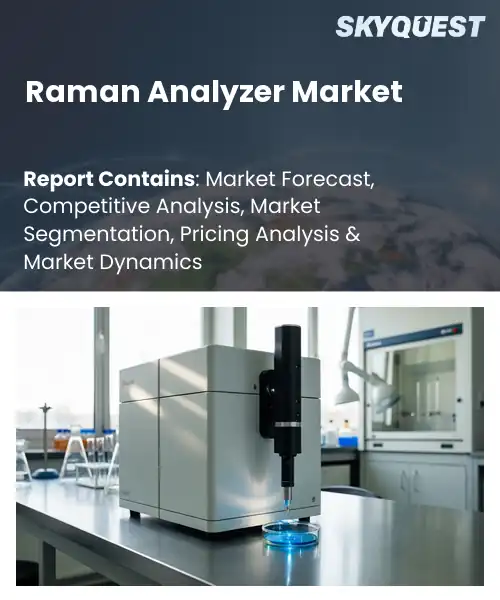
Raman Analyzer Market
Report ID: SQMIG35J2512
Report ID: SQMIG35J2512
[email protected]
USA +1 351-333-4748
Report ID:
SQMIG35J2512 |
Region:
Global |
Published Date: July, 2026
Pages:
157
|Tables:
117
|Figures:
77


Global Raman Analyzer Market size was valued at USD 0.88 Billion in 2024 and is poised to grow from USD 0.96 Billion in 2025 to USD 1.95 Billion by 2033, growing at a CAGR of 9.22% during the forecast period (2026-2033).
At the core of the Raman analyzer market is the growing demand for rapid, non‑destructive molecular identification across regulated industries, which drives purchases and innovation. Raman analyzers use vibrational spectroscopy to reveal chemical composition without sample preparation, making them vital for pharmaceutical quality control, identification, and materials characterization. In recent decades the market shifted from large laboratory bench systems to compact instruments suitable for field deployment, enabled by advances in laser sources, detectors, and data processing.
For example, pharmaceutical manufacturers employ Raman for polymorph screening and inline process analytical technology while customs agencies use handheld units for illicit drug detection.Technological advances represent the principal growth factor because improvements in sensitivity, miniaturization, and data analytics expand viable applications and market reach. As detectors and lasers became smaller and SERS-enhanced substrates increased signal strength, manufacturers offer handheld and inline systems, which led to adoption in customs screening, in situ battery material analysis for electric vehicle production, and pharmaceutical process control. Simultaneously, regulatory emphasis on process analytical technology incentivizes capital investment, while cloud-based spectral libraries and machine learning reduce false positives and speed decision-making. Consequently vendors are positioned to convert pilots into scalable deployments across food safety, environmental monitoring, and advanced manufacturing.
How is AI improving detection accuracy in the Raman analyzer market?
AI improves detection accuracy in Raman analyzers by strengthening several key functions. Machine learning enhances signal cleaning and baseline correction so weak spectra become usable. Advanced algorithms extract subtle features and match them against growing spectral libraries, while adaptive classifiers reduce false positives in complex matrices. Edge inference and cloud analytics let instruments learn from new samples, so handheld, inline and laboratory systems all gain consistency. In markets from bioprocess monitoring to semiconductor inspection, these AI driven workflows turn noisy spectral data into reliable identifications and make routine deployments more practical and scalable.
In May 2026, Canon unveiled a Raman plastic analyzer aimed at black plastic identification for recycling, showing how AI enabled spectral classification raises confidence in matches, speeds sorting decisions and supports broader industrial adoption by improving throughput and operational efficiency.
Market snapshot - (2026-2033)
Global Market Size
USD 0.88 Billion
Largest Segment
Benchtop Raman Analyzers
Fastest Growth
Handheld Raman Analyzers
Growth Rate
9.22% CAGR
To get more insights on this market click here to Request a Free Sample Report
Global raman analyzer market is segmented by type, application, end-user, distribution and region. Based on type, the market is segmented into Handheld Raman Analyzers, Benchtop Raman Analyzers and Portable Raman Spectrometers. Based on application, the market is segmented into Pharmaceutical QC, Food Safety Testing, Material Identification and Forensics. Based on end-user, the market is segmented into Pharma & Biotech, Law Enforcement and Chemical Industry. Based on distribution, the market is segmented into Direct and Distributors. Based on region, the market is segmented into North America, Europe, Asia Pacific, Latin America and Middle East & Africa.
Handheld Raman analyzers segment dominates with large global Raman analyzer market share because their combination of portability, intuitive operation, and rugged design enables rapid, nondestructive identification at point of need, meeting demand across inspection, security, and supply chain checks. Ease of use reduces training barriers, and integration with chemometric libraries enhances on-site decision making, driving procurement by users prioritizing speed and operational flexibility in routine and emergency testing while enabling secure data capture.
As per global Raman analyzer market outlook, portable Raman spectrometers are rapidly expanding, driven by advances in detector sensitivity, modular optics, and battery life that extend analytical reach into semi-mobile labs and field deployments. Increased versatility and broader applications attract investment and unlock new use cases, accelerating market growth by combining enhanced performance with sustained mobility.
Pharmaceutical QC segment dominates because stringent quality requirements and regulatory scrutiny make rapid, nondestructive chemical identification essential for raw material verification, counterfeit detection, and process analytical technology integration. Raman analyzers reduce time to decision within manufacturing and QC labs, and adherence to validation and data integrity expectations drives procurement by manufacturers seeking reliable, audit ready analytical tools that streamline release testing and supply chain quality assurance while enabling continuous monitoring strategies.
As per global Raman analyzer analysis, food safety testing is witnessing the strongest growth momentum as manufacturers and distributors adopt Raman for rapid contaminant, allergen, and authenticity screening across supply chains. Advances in sample handling and spectral libraries for complex matrices, combined with demand for on-site screening, are expanding applications and creating opportunities for specialized instruments and integrated data workflows.
To get detailed segments analysis, Request a Free Sample Report
North America maintains a leading position in the global Raman analyzer market due to a combination of advanced research infrastructure, strong presence of key instrument manufacturers, and broad adoption across pharmaceutical, chemical, and academic sectors. Well established networks of laboratories and early adoption of analytical innovations enable rapid validation and integration of Raman technologies into quality control and process analytical strategies. Supportive regulatory frameworks and robust private investment foster commercialization of application specific solutions and portable instruments. Collaborative ecosystems linking instrument vendors, contract research organizations, and end users accelerate product refinement and service models. Additionally, skilled technical workforce and concentrated centers of innovation create demand for high end spectroscopy platforms while enabling localized service and training capabilities that reinforce market leadership.
As per global Raman analyzer market regional outlook, United States benefits from dense concentration of research institutions, leading instrument developers, and advanced industrial adoption. Strong service networks, specialized application development, and close ties between manufacturers and large pharmaceutical companies drive demand for sophisticated Raman solutions. Emphasis on instrument performance, data analytics, and deployable systems supports product diversification. Collaborative testing and training offerings enhance end user confidence and facilitate uptake in regulated environments across sectors.
As per global Raman analyzer market regional forecast, Canada is shaped by research driven procurement, collaborations with instrument vendors, and growing adoption within pharmaceutical laboratories. Emphasis on portability, remote analysis, and tailored application support encourages uptake in dispersed facilities. Close collaboration between universities and commercial labs fosters validation of specialized workflows and training programs. Service oriented business models and focused technical support enhance accessibility for users and help bridge laboratory demand with supplier capabilities.
Europe is experiencing rapid expansion in the Raman analyzer market driven by concentrated industrial demand, strong research collaboration, and a thriving sensor and instrumentation ecosystem. Regional manufacturers and specialized service providers work closely with pharmaceutical, chemical, and energy sectors to develop tailored analytical solutions. Regulatory emphasis on quality assurance and material verification encourages deployment of Raman techniques for non destructive testing and process monitoring. Growing interest in portable and handheld instruments for field use, combined with supportive innovation networks and cross border partnerships, accelerates application diversification. Investment in training and application support further lowers adoption barriers for mid sized and large enterprises seeking reliable spectroscopic tools. Furthermore, integration of advanced data analytics and instrument connectivity is enhancing utility for complex material characterization, while aftermarket calibration and service offerings help maintain long term operational readiness across diverse user groups.
As per global Raman analyzer industry analysis, Germany benefits from strong industrial demand, deep instrument manufacturing capability, and laboratory infrastructure focused on materials analysis. Presence of established instrumentation companies and service providers supports development of high performance platforms and tailored solutions. Collaboration between industrial research centers and universities promotes application validation and skilled workforce development. Adoption across chemical manufacturing, automotive, and materials testing sectors reinforces demand for advanced Raman instrumentation and support services locally.
United Kingdom is characterized by adoption driven by life science research, proactive procurement by clinical and industrial laboratories, and instrument developers focusing on field ready systems. A vibrant startup ecosystem and targeted partnerships accelerate commercialization of niche applications. Training programs and service oriented offerings lower barriers for smaller laboratories. Emphasis on data integration and portable Raman solutions supports use in materials testing, pharmaceutical development, and regulatory compliance.
France is emerging through focused investments in applied research, strong academic collaborations, and expanding base of application oriented service providers. Demand is growing in pharmaceutical formulation, cosmetics quality control, and materials research where non invasive spectroscopic methods add value. Local instrument customization and integration with laboratory informatics encourage uptake by mid sized companies and institutes. Vendor training and demonstration programs support broader adoption across diverse user groups.
Asia Pacific is strengthening its role in the Raman analyzer market through concentrated investments in instrumentation, expanding manufacturing capabilities, and growing application demand across electronics, pharmaceuticals, and materials science. Regional firms are focusing on product adaptation for local use cases, developing compact and ruggedized systems suited to field operations and factory floor integration. Collaboration between instrument makers and major industrial customers enables rapid iteration of features and service models. Investment in training, application development centers, and localized technical support improves user confidence. Increasing emphasis on integrated data workflows and compatibility with automation platforms further enhances appeal for production oriented users and research institutions seeking reliable spectroscopic solutions. Supportive industrial policies and strengthened regional supply chains reduce barriers to commercialization, while expanded aftermarket services and calibration networks maintain instrument uptime. Academic industry partnerships foster skilled talent and novel applications that increase market relevance across the region.
Japan is supported by a strong electronics manufacturing base, precision instrument makers, and intensive materials research. Local developers specialize in compact, high precision systems that integrate with production line quality controls and component testing workflows. Close collaboration between manufacturers and major industrial customers accelerates refinement of user oriented features and service delivery. Focus on reliability, miniaturization, and automation compatibility drives broad adoption across industrial and research applications.
South Korea benefits from strong semiconductor sectors driving demand for advanced spectroscopic tools and tailored analytical workflows. Domestic instrument firms focus on high sensitivity systems and integration with semiconductor inspection and process monitoring platforms. Partnerships with major manufacturers enable rapid deployment of customized solutions and local service models. Emphasis on innovation, testing capabilities, and technical support encourages adoption across fabrication facilities, research institutes, and quality control laboratories.
To know more about the market opportunities by region and country, click here to
Buy The Complete Report
Advancements In Instrumentation
Increased Use In Pharmaceutical Analysis
High Cost Of Advanced Instruments
Lack Of Standardized Validation Protocols
Request Free Customization of this report to help us to meet your business objectives.
Competition in the global Raman analyzer industry is driven by targeted M&A, strategic OEM partnerships, and rapid instrument innovation; examples include Metrohm’s integration of B&W Tek’s spectroscopy business, HORIBA’s co-development with Fujifilm for an inline high-sensitivity biopharma Raman system, and Renishaw’s product expansion around its Virsa Raman analyser. These moves force differentiation through miniaturization, software analytics, and application-specific probes.
SkyQuest’s ABIRAW (Advanced Business Intelligence, Research & Analysis Wing) is our Business Information Services team that Collects, Collates, Correlates, and Analyses the Data collected by means of Primary Exploratory Research backed by robust Secondary Desk research.
As per SkyQuest analysis, the global Raman analyzer market growth is driven primarily by advancements in instrumentation that enable miniaturization and enhanced sensitivity, while AI driven spectral analysis further improves detection accuracy and broadens practical applications. Adoption is restrained by the high cost of advanced instruments, which limits uptake among smaller laboratories and budget conscious buyers. North America remains the dominating region due to concentrated research infrastructure, manufacturer presence, and early adoption. Handheld Raman analyzers are the dominating segment owing to portability, intuitive operation, and rapid on site identification, positioning vendors to convert pilots into scalable deployments across pharmaceutical, security, and industrial use cases. The global Raman analyzer market trend driven by increasing demand for rapid, non-destructive chemical analysis across the pharmaceutical, biotechnology, chemical, food & beverage, oil & gas, semiconductor, and environmental industries.
| Report Metric | Details |
|---|---|
| Market size value in 2024 | USD 0.88 Billion |
| Market size value in 2033 | USD 1.95 Billion |
| Growth Rate | 9.22% |
| Base year | 2024 |
| Forecast period | (2026-2033) |
| Forecast Unit (Value) | USD Billion |
| Segments covered |
|
| Regions covered | North America (US, Canada), Europe (Germany, France, United Kingdom, Italy, Spain, Rest of Europe), Asia Pacific (China, India, Japan, Rest of Asia-Pacific), Latin America (Brazil, Rest of Latin America), Middle East & Africa (South Africa, GCC Countries, Rest of MEA) |
| Companies covered |
|
| Customization scope | Free report customization with purchase. Customization includes:-
|
To get a free trial access to our platform which is a one stop solution for all your data requirements for quicker decision making. This platform allows you to compare markets, competitors who are prominent in the market, and mega trends that are influencing the dynamics in the market. Also, get access to detailed SkyQuest exclusive matrix.
Table Of Content
Executive Summary
Market overview
Parent Market Analysis
Market overview
Market size
KEY MARKET INSIGHTS
COVID IMPACT
MARKET DYNAMICS & OUTLOOK
Market Size by Region
KEY COMPANY PROFILES
Methodology
For the Raman Analyzer Market, our research methodology involved a mixture of primary and secondary data sources. Key steps involved in the research process are listed below:
1. Information Procurement: This stage involved the procurement of Market data or related information via primary and secondary sources. The various secondary sources used included various company websites, annual reports, trade databases, and paid databases such as Hoover's, Bloomberg Business, Factiva, and Avention. Our team did 45 primary interactions Globally which included several stakeholders such as manufacturers, customers, key opinion leaders, etc. Overall, information procurement was one of the most extensive stages in our research process.
2. Information Analysis: This step involved triangulation of data through bottom-up and top-down approaches to estimate and validate the total size and future estimate of the Raman Analyzer Market.
3. Report Formulation: The final step entailed the placement of data points in appropriate Market spaces in an attempt to deduce viable conclusions.
4. Validation & Publishing: Validation is the most important step in the process. Validation & re-validation via an intricately designed process helped us finalize data points to be used for final calculations. The final Market estimates and forecasts were then aligned and sent to our panel of industry experts for validation of data. Once the validation was done the report was sent to our Quality Assurance team to ensure adherence to style guides, consistency & design.
Analyst Support
Customization Options
With the given market data, our dedicated team of analysts can offer you the following customization options are available for the Raman Analyzer Market:
Product Analysis: Product matrix, which offers a detailed comparison of the product portfolio of companies.
Regional Analysis: Further analysis of the Raman Analyzer Market for additional countries.
Competitive Analysis: Detailed analysis and profiling of additional Market players & comparative analysis of competitive products.
Go to Market Strategy: Find the high-growth channels to invest your marketing efforts and increase your customer base.
Innovation Mapping: Identify racial solutions and innovation, connected to deep ecosystems of innovators, start-ups, academics, and strategic partners.
Category Intelligence: Customized intelligence that is relevant to their supply Markets will enable them to make smarter sourcing decisions and improve their category management.
Public Company Transcript Analysis: To improve the investment performance by generating new alpha and making better-informed decisions.
Social Media Listening: To analyze the conversations and trends happening not just around your brand, but around your industry as a whole, and use those insights to make better Marketing decisions.
REQUEST FOR SAMPLE
 REQUEST FREE CUSTOMIZATION
Global Raman Analyzer Market size was valued at USD 0.88 Billion in 2024 and is poised to grow from USD 0.96 Billion in 2025 to USD 1.95 Billion by 2033, growing at a CAGR of 9.22% during the forecast period (2026-2033).
Competition in the global Raman analyzer market is driven by targeted M&A, strategic OEM partnerships, and rapid instrument innovation; examples include Metrohm’s integration of B&W Tek’s spectroscopy business, HORIBA’s co-development with Fujifilm for an inline high-sensitivity biopharma Raman system, and Renishaw’s product expansion around its Virsa Raman analyser. These moves force differentiation through miniaturization, software analytics, and application-specific probes. 'Thermo Fisher Scientific (TruNarc)', 'HORIBA Scientific', 'Renishaw plc', 'Bruker Corporation', 'Kaiser Optical Systems (Endress+Hauser)', 'B&W Tek (Metrohm)', 'Ocean Insight (Ocean Optics)', 'Rigaku Corporation', 'PerkinElmer Inc.', 'JASCO Inc.', 'Metrohm AG', 'Agilent Technologies', 'Ondas Medical', 'Si-Ware Systems', 'Opton Laser International', 'Photon Systems Instruments', 'Photon etc.', 'Wasatch Photonics', 'Tornado Spectral Systems', 'RamanBio (RamanCloud)'
Continuous improvements in laser sources, detectors, optical design, and instrument miniaturization have enhanced the practical capabilities of Raman analyzers, enabling more sensitive, portable, and user-friendly systems for a range of applications. These technological refinements reduce barriers to deployment by simplifying sample handling and measurement workflows, fostering broader adoption across laboratories and field settings. The resulting accessibility and performance gains encourage users to integrate Raman techniques into routine workflows, driving demand for both benchtop and handheld analyzers in research, quality control, and on-site analysis environments.
Ai Driven Spectral Analysis: AI driven algorithms and chemometric models are increasingly embedded in Raman analyzers to accelerate spectral interpretation, improve material identification, and support automated decision workflows. Vendors are focusing on intuitive software that translates complex spectra into actionable insights for non expert users, enabling broader adoption across industries. This trend reduces interpretation variability, streamlines analysis, and supports integration with laboratory information systems and cloud platforms, creating new value through predictive maintenance, anomaly detection, and continuous monitoring without adding complexity for operational teams.
Why does North America Dominate the Global Raman Analyzer Market? |@12


Want to customize this report? This report can be personalized according to your needs. Our analysts and industry experts will work directly with you to understand your requirements and provide you with customized data in a short amount of time. We offer $1000 worth of FREE customization at the time of purchase.
Feedback From Our Clients


 USA (+1) 351-333-4748

