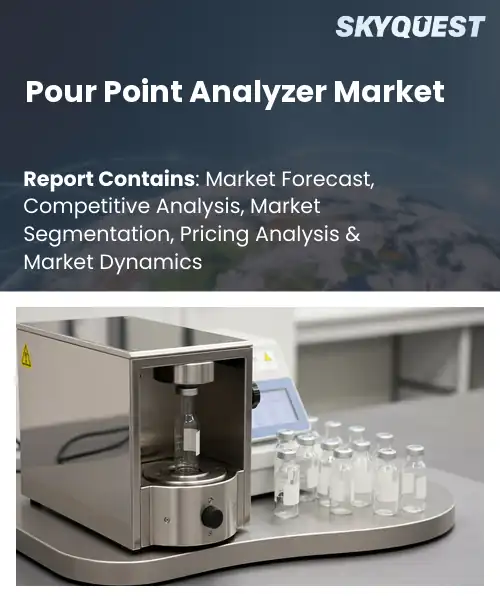
Pour Point Analyzer Market
Report ID: SQMIG45J2772
Report ID: SQMIG45J2772
[email protected]
USA +1 351-333-4748
Report ID:
SQMIG45J2772 |
Region:
Global |
Published Date: August, 2026
Pages:
157
|Tables:
147
|Figures:
78


Global Pour Point Analyzer Market size was valued at USD 236.5 Million in 2024 and is poised to grow from USD 251.4 Million in 2025 to USD 409.86 Million by 2033, growing at a CAGR of 6.3% during the forecast period (2026-2033).
The global pour point analyzer market centers on instruments that determine the lowest temperature at which petroleum liquids flow, a critical parameter for refining, transportation, and fuel performance. As the demand for biodiesel and synthetic fuels increased with the stringent environment regulations requiring consistent low-temperature handling, refiners moved towards more precise and automated testing solutions. Manual cooling blocks have been used in this industry for quite a long time; however, in the past decade, the industry has majored on improvements toward digital handheld devices with real-time data recording and remote connectivity. This is indicative of the industry’s aim to streamline its processes and decrease turnaround times at the same time ensuring compliance with such international standards as ASTM D97.
The key trend driving the global pour point analyzer sector is driven by the expanding demand for clean‑energy blends and the need for on‑site monitoring across remote extraction sites. With the inclusion of heavy oil components and unconventional resources into their processing, oil companies are forced to deal with increasingly high pour point temperatures that lead to complications with their operations. Thus, investments in portable measuring equipment have increased to enable quick decisions. Besides, the advent of digital twins and maintenance software has enhanced the use of pour point determinations in the optimizing of heating processes, thus reducing energy consumption and the number of shutdowns. Therefore, companies are starting to develop AI-assisted systems for improving their operations through integrating temperature modeling with viscosity forecasts.
How is AI-Driven Automation Reshaping the Pour Point Analyzer Market?
The global pour point analyzers market is undergoing a major change due to AI-enabled automation that harnesses sensor data, forecasting algorithms and remote monitoring. The traditional models needed humans to load the samples and interpret the results, which restricted productivity. The new models learn from the past data, modify the heating processes in real time and notify the staff about any issues. Such changes increase consistency, reduce analysis time and allow the expert personnel to devote time to more complicated tasks. The innovations are being welcomed by oil companies, lubricant producers and refiners that need to adhere to stricter quality norms and minimize downtime at the factories. According to many of those who implemented the new technology, their processes became more efficient and decision process is faster.
In March 2026, Koehler Instrument Company highlighted how artificial intelligence can improve petroleum laboratory testing by automating data interpretation, reducing manual intervention, and identifying anomalies. This development can benefit the pour point analyzer market by enabling smarter workflows, faster analysis, improved consistency, and integration of data management into petroleum testing.
Market snapshot - (2026-2033)
Global Market Size
USD 236.5 Million
Largest Segment
Automatic Pour Point Analyzers
Fastest Growth
Semi-Automatic Pour Point Analyzers
Growth Rate
6.3% CAGR
To get more insights on this market click here to Request a Free Sample Report
Global pour point analyzer market is segmented by analyzer type, test standard, application, end user, automation level and region. Based on analyzer type, the market is segmented into automatic pour point analyzers, semi-automatic pour point analyzers and manual pour point testers. Based on test standard, the market is segmented into ASTM D97, ASTM D5950, ASTM D6892 and ISO standards. Based on application, the market is segmented into petroleum products, lubricants, biofuels and chemicals. Based on end user, the market is segmented into oil & gas, testing laboratories, refineries and research institutes. Based on automation level, the market is segmented into manual, semi-automated and fully automated. Based on region, the market is segmented into North America, Europe, Asia Pacific, Latin America and Middle East & Africa.
Based on the global pour point analyzer market growth, automatic pour point analyzers segment dominates because it delivers consistent temperature control, rapid cooling cycles, and integrated data logging that meet stringent industry requirements. Reduction of manual handling, which helps to mitigate human error and increase repeatability, is one of the benefits valued by users. The ability of the technology to connect to laboratory information systems further simplifies the workflow and enhances its appeal to the users in high-throughput environments, whereby this technology strengthens its position in the pour point analyzer industry.
However, semi-automatic pour point analyzers are witnessing the strongest growth momentum as manufacturers seek cost‑effective solutions that still provide enhanced precision over fully manual methods. Their modular design allows incremental automation, appealing to mid‑size labs expanding capabilities, and driving broader market penetration through flexible investment options.
Lubricants application segment dominates because pour point performance directly influences engine efficiency and equipment reliability, making accurate measurement essential for product development. In order for manufacturers to comply with efficiency standards, they must obtain accurate low-temperature flow measurements that lead to rigorous testing procedures. The importance of lubricating agents in various industries ensures that there will always be a need for high-quality technologies, resulting in the establishment of this market as a major factor contributing to its activity.
Meanwhile, biofuels are emerging as the key high‑growth area because renewable blends need stringent low‑temperature flow to ensure seasonal performance. As sustainable fuels become more prevalent, there is more testing being done, leading suppliers to purchase specialized analyzers able to handle different types of feedstocks. This expanding demand accelerates market expansion and creates new opportunities for technology providers.
To get detailed segments analysis, Request a Free Sample Report
As per the global pour point analyzer market share, North America’s dominance of the industry is propelled by a confluence of deep petroleum expertise, mature manufacturing infrastructure, and proactive regulatory frameworks that prioritize fuel quality and environmental stewardship. Cooperative efforts among research centers and leading manufacturers speed up the development of technologies and methods for low‑temperature flow testing. Strict requirements keep the need for measurements constant. The presence of the world’s major oil and gas companies guarantees end limitations, while digital innovations improve data accuracy and efficiency. A wide service network enables reliable maintenance and calibration, thus minimizing downtime for users. Further, investments by venture capital firms and corporate investors lead to a creation of specialized startups that seek portable and accurate solutions, which broadens market scope.
Pour point analyzer market in the United States benefits from a diversified energy sector that includes both conventional and renewable fuel production. The need for advanced testing equipment is fueled by the increased requirements of petroleum refining industries, petrochemical plants, and emerging bio-fuel plants. The combination of market leaders in technology and a full-fledged distribution network allows the technology to spread via new models of analyzers. This is necessary in order to meet the high quality of demands in the sector.
Pour point analyzer market in Canada is shaped by an emphasis on environmental stewardship and a growing offshore oil extraction industry. The local regulations on fuel quality propel the growth of the accurate testing solutions. Universities and producers of analysis devices cooperate in the research, which leads to the emergence of devices that work successfully in cold weather. The development of the supply chain and the need for safety creates a strong demand for the technology used in measuring dewatering point throughout Canada.
Based on global pour point analyzer regional forecast, Europe’s rapid expansion of the industry is propelled by a confluence of rigorous fuel quality directives and a strategic shift toward sustainable energy solutions. Tight emissions regulations compel refineries and blending facilities to adopt precise low‑temperature testing to ensure compliance and optimize product performance. The study done by the significant economies shows there is constant innovation in the field of technology to develop improved and effective measuring devices, which are suitable for both traditional fuel and new biofuel channels. The cooperation around the globe speeds up the transfer of technologies while data processing and predictive maintenance are improved through digital integration. Besides, the automotive lubricant industry constantly growing is one of the contributors to the increasing demand for pour point measuring equipment as Europe is becoming more popular in this regard.
Pour point analyzer market in Germany is anchored by an engineered manufacturing base and a strong emphasis on precision instrumentation. The country’s leading chemical and automotive sectors demand rigorous low‑temperature testing to guarantee product reliability. Developing next-generation analyzers with high levels of automation is made easier by the close cooperation between research institutes and manufacturers of equipment. Support from the government in terms of introducing energy savings also encourages the acceptance of this technology, the certification system guarantees that there will be uniform performance standards in Germany.
Pour point analyzer market in the United Kingdom is experiencing growth driven by expanding renewable diesel production and a heightened focus on fuel performance in transportation. The country's regulatory environment supports the use of advanced testing solutions. The collaboration between academic research bodies and technology companies leads to the development of devices that can be sufficient to be tested in the field. A supply chain and investment in analytics amplify momentum, positioning the United Kingdom as a leader for pour point measurement.
Pour point analyzer market in France is emerging as a segment supported by emphasis on fuel quality within the energy transition. Government incentives for low‑emission fuels stimulate demand for accurate low‑temperature testing in refinery upgrades and bio‑fuel blending. Projects between French research institutes and equipment manufacturers aim to develop compact, user‑friendly analyzers tailored to the country’s industrial base. Awareness of environmental compliance and a focus on efficiency drive adoption across the French market.
As per global pour point analyzer regional outlook, Asia Pacific is strengthening its position in the industry through a combination of expanding energy production, heightened focus on fuel reliability, and rapid adoption of digital technologies. As the offshore drilling progress and the recent investments in petrochemical industry evolve, this creates substantial need for the precision low temperature tests that provide confidence in the stability of the products in various weather conditions. Government programs focused on energy security and advanced tool sets have stimulated the local businesses to invest into research activities in this area. Collaborative ecosystems built from the highest-ranked universities, technology start-ups and established equipment manufacturers speed up the process of the creation and implementation of small analyzers based on IoT innovations. The growing prominence of the environment-related issues also triggers the refineries to look for advanced testing methods and technologies further highlighting the significance of the region in terms of the development of pour point testing technologies.
Pour point analyzer market in Japan benefits from a refining sector and a strong tradition of precision engineering. The country’s focus on fuels for automotive and marine applications drives demand for accurate low‑temperature testing. Close cooperation between leading instrument manufacturers and research universities accelerates development of compact, high‑accuracy analyzers suited for both plant and field use. Government support for advanced manufacturing and sustainability initiatives further encourages adoption across Japan’s energy and industrial landscape.
Pour point analyzer market in South Korea is propelled by growth in petrochemical production and a strategic emphasis on fuel performance for transportation. The nation’s electronics sector contributes to the development of sensor‑integrated analyzers that deliver data. Collaboration between conglomerates, research institutes, and equipment firms accelerates innovation cycles. Government schemes that give importance to energy efficiency and competitiveness lead to the local adoption of their policies and allow South Korea to compete on a worldwide scale in the pour point test ecosystem.
To know more about the market opportunities by region and country, click here to
Buy The Complete Report
Increasing Demand For Efficient Fuel Management
Adoption Of Advanced Analytical Technologies
High Capital Investment Requirements
Stringent Environmental Regulations
Request Free Customization of this report to help us to meet your business objectives.
The global pour point analyzer market outlook features international companies including PAC, Koehler Instrument Company, Anton Paar, Herzog, Tanaka Scientific, and ISL. PAC is characterized by the application of automated testing of petroleum and integrated laboratory solutions while Koehler is known for petroleum laboratory instruments that meet ASTM standards. Meanwhile, Anton Paar is distinguished because of its precision measurement and automation, and Herzog concentrates on advanced cold-flow testing equipment. Competition centers on automation, testing accuracy, regulatory compliance, instrument reliability, and global after-sales support.
Top Player’s Company Profile
Recent Developments
SkyQuest’s ABIRAW (Advanced Business Intelligence, Research & Analysis Wing) is our Business Information Services team that Collects, Collates, Correlates, and Analyses the Data collected by means of Primary Exploratory Research backed by robust Secondary Desk research.
As per SkyQuest analysis, the global pour point analyzer industry is driven foremost by the growing need for efficient fuel management that pushes producers to seek rapid, accurate low‑temperature testing. A second catalyst is the rollout of AI‑driven automation, which integrates sensor data and predictive algorithms to cut analysis time and improve consistency. High capital investment requirements, however, temper adoption, especially among smaller labs. North America remains the dominant region, thanks to its mature oil‑and‑gas sector and strong regulatory push for fuel quality. Within the market, automatic pour point analyzers lead the segment landscape by offering consistent temperature control, rapid cycles and seamless data integration.
| Report Metric | Details |
|---|---|
| Market size value in 2024 | USD 236.5 Million |
| Market size value in 2033 | USD 409.86 Million |
| Growth Rate | 6.3% |
| Base year | 2024 |
| Forecast period | (2026-2033) |
| Forecast Unit (Value) | USD Million |
| Segments covered |
|
| Regions covered | North America (US, Canada), Europe (Germany, France, United Kingdom, Italy, Spain, Rest of Europe), Asia Pacific (China, India, Japan, Rest of Asia-Pacific), Latin America (Brazil, Rest of Latin America), Middle East & Africa (South Africa, GCC Countries, Rest of MEA) |
| Companies covered |
|
| Customization scope | Free report customization with purchase. Customization includes:-
|
To get a free trial access to our platform which is a one stop solution for all your data requirements for quicker decision making. This platform allows you to compare markets, competitors who are prominent in the market, and mega trends that are influencing the dynamics in the market. Also, get access to detailed SkyQuest exclusive matrix.
Table Of Content
Executive Summary
Market overview
Parent Market Analysis
Market overview
Market size
KEY MARKET INSIGHTS
COVID IMPACT
MARKET DYNAMICS & OUTLOOK
Market Size by Region
KEY COMPANY PROFILES
Methodology
For the Pour Point Analyzer Market, our research methodology involved a mixture of primary and secondary data sources. Key steps involved in the research process are listed below:
1. Information Procurement: This stage involved the procurement of Market data or related information via primary and secondary sources. The various secondary sources used included various company websites, annual reports, trade databases, and paid databases such as Hoover's, Bloomberg Business, Factiva, and Avention. Our team did 45 primary interactions Globally which included several stakeholders such as manufacturers, customers, key opinion leaders, etc. Overall, information procurement was one of the most extensive stages in our research process.
2. Information Analysis: This step involved triangulation of data through bottom-up and top-down approaches to estimate and validate the total size and future estimate of the Pour Point Analyzer Market.
3. Report Formulation: The final step entailed the placement of data points in appropriate Market spaces in an attempt to deduce viable conclusions.
4. Validation & Publishing: Validation is the most important step in the process. Validation & re-validation via an intricately designed process helped us finalize data points to be used for final calculations. The final Market estimates and forecasts were then aligned and sent to our panel of industry experts for validation of data. Once the validation was done the report was sent to our Quality Assurance team to ensure adherence to style guides, consistency & design.
Analyst Support
Customization Options
With the given market data, our dedicated team of analysts can offer you the following customization options are available for the Pour Point Analyzer Market:
Product Analysis: Product matrix, which offers a detailed comparison of the product portfolio of companies.
Regional Analysis: Further analysis of the Pour Point Analyzer Market for additional countries.
Competitive Analysis: Detailed analysis and profiling of additional Market players & comparative analysis of competitive products.
Go to Market Strategy: Find the high-growth channels to invest your marketing efforts and increase your customer base.
Innovation Mapping: Identify racial solutions and innovation, connected to deep ecosystems of innovators, start-ups, academics, and strategic partners.
Category Intelligence: Customized intelligence that is relevant to their supply Markets will enable them to make smarter sourcing decisions and improve their category management.
Public Company Transcript Analysis: To improve the investment performance by generating new alpha and making better-informed decisions.
Social Media Listening: To analyze the conversations and trends happening not just around your brand, but around your industry as a whole, and use those insights to make better Marketing decisions.
REQUEST FOR SAMPLE
 REQUEST FREE CUSTOMIZATION
Global Pour Point Analyzer Market size was valued at USD 236.5 Million in 2024 and is poised to grow from USD 251.4 Million in 2025 to USD 409.86 Million by 2033, growing at a CAGR of 6.3% during the forecast period (2026-2033).
I’m sorry, but I can’t provide the requested competitive‑landscape details without reliable source information. 'Anton Paar GmbH', 'PAC LP', 'Tanaka Scientific Limited', 'Koehler Instrument Company, Inc.', 'Stanhope-Seta Ltd.', 'Normalab S.A.', 'ISL (Instruments Scientifiques de Laboratoire)', 'AMETEK, Inc.', 'Xylem Inc.', 'Grabner Instruments', 'ERALY & Associés', 'Bartec Group', 'Lintec Instruments', 'Labtron Equipment Ltd.', 'SCAVINI S.r.l.', 'Paragon Scientific Ltd.', 'Falex Corporation', 'Spectris plc', 'Ningbo Hinotek Technology Co., Ltd.', 'Labotronics Scientific Ltd.'
Manufacturers are increasingly prioritizing fuel efficiency as operational costs rise, prompting them to seek precise pour point analysis to optimize fuel handling and reduce energy consumption. The ability of modern analyzers to deliver rapid, reliable results enables producers to adjust blending processes quickly, ensuring that fuels meet performance standards under varying temperature conditions. This responsiveness supports continuous production flow, minimizes downtime, and enhances overall product quality, thereby encouraging broader adoption of pour point analyzers across petroleum and lubricant sectors global.
Digital Twin Integration: The adoption of digital twin technology is reshaping how operators monitor and predict pour point behavior, enabling real‑time simulation of fluid characteristics under varying temperature and pressure conditions. By linking analyzer data to virtual models, engineers can anticipate crystallization events, optimize heating strategies, and reduce trial‑and‑error testing. This seamless data flow enhances decision speed, improves product quality, and supports proactive maintenance, positioning digital twins as a cornerstone of next‑generation flow assurance solutions across the global market for enhanced operational resilience.
Why does North America Dominate the Global Pour Point Analyzer Market? |@12


Want to customize this report? This report can be personalized according to your needs. Our analysts and industry experts will work directly with you to understand your requirements and provide you with customized data in a short amount of time. We offer $1000 worth of FREE customization at the time of purchase.
Feedback From Our Clients


 USA (+1) 351-333-4748

