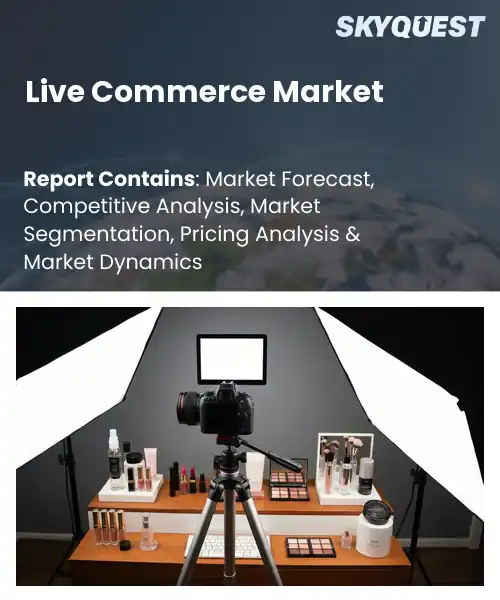
Live Commerce Market
Report ID: SQMIG25Z2023
Report ID: SQMIG25Z2023
[email protected]
USA +1 351-333-4748
Report ID:
SQMIG25Z2023 |
Region:
Global |
Published Date: June, 2026
Pages:
157
|Tables:
175
|Figures:
79


Global Live Commerce Market size was valued at USD 1.05 Trillion in 2024 and is poised to grow from USD 1.3 Trillion in 2025 to USD 7.02 Trillion by 2033, growing at a CAGR of 23.5% during the forecast period (2026-2033).
The key factor driving live commerce is the integration between video streaming services and transactional e-commerce, which turns passive shopping experiences into engaging and more successful interactions that lead to conversions. Live commerce includes interactive video streams, product demonstrations by influencers, and payments systems. It is important since it allows for quicker purchases while giving customers access to additional information and social proof. The concept originated in TV-based home shopping and was developed through mobile applications such as Taobao Live and Douyin in China before spreading to other platforms like Amazon Live and TikTok Shopping in Western countries due to smartphones and improved network connectivity.
Due to deeper consumer engagement with products through live streaming, the retailer benefits from larger order values and quicker purchasing decisions, thus compelling the retailer to focus on high-quality production and influencer collaborations. Thus, the platform starts offering better commerce APIs, payment gateways, and analysis capabilities, allowing for promotions and recommendations to be made to consumers. For instance, cosmetic companies that demonstrate their products through live streaming on platforms such as Instagram and Taobao benefit from an increase in sales and low returns due to accuratedemonstrations, thus prompting other businesses to incorporate shoppable live-streaming videos into their strategies.
How is AI Transforming Customer Engagement in the Live Commerce Market?
AI is changing how customer interaction happens during live commerce transactions with personalized experiences, recommendations in real-time, chatbots, and content generation automation. These include personalized recommendations of products during the broadcast, use of AI hosts to respond to queries from customers, and technologies for quick generation of content by the host. Today, these technologies have been incorporated by live commerce companies for scaling creators, discovery, and increasing immersive experience with virtual try-on and instant checkout functionalities. Under the hood, there is analytics for interpreting messages and behaviors in the chat to recommend offers and minimize inconvenience in the process. TikTok launched in May 2026 AI-driven content creation and commerce tools for automating campaigns and optimizing live shopping.
Market snapshot - (2026-2033)
Global Market Size
USD 1.05 Trillion
Largest Segment
Marketplace Platforms
Fastest Growth
Social Media Platforms
Growth Rate
23.5% CAGR
To get more insights on this market click here to Request a Free Sample Report
Global live commerce market is segmented by platform type, product category, business model, device type, end user, revenue model and region. Based on platform type, the market is segmented into Social Media Platforms, E-Commerce Platforms, Brand-Owned Platforms and Marketplace Platforms. Based on product category, the market is segmented into Fashion & Apparel, Beauty & Personal Care, Consumer Electronics, Home & Living, Food & Beverages and Others. Based on business model, the market is segmented into B2C, C2C and B2B. Based on device type, the market is segmented into Smartphones, Tablets and Desktops & Laptops. Based on end user, the market is segmented into Individual Consumers and Businesses. Based on revenue model, the market is segmented into Product Sales, Commission-Based Sales, Advertising & Sponsorships and Subscription-Based Services. Based on region, the market is segmented into North America, Europe, Asia Pacific, Latin America and Middle East & Africa.
The Social Media Platforms subsegment dominates due to the fact that their natural audience base, interactive live video capabilities, and influencer ecosystem allows for instant trust and attention which turn into conversions quickly. Comments and social proof remove purchase uncertainty, while shoppable overlays and smooth transactional flows ensure quicker buyer journeys. The algorithms in place and virality allow discovery of these platforms’ content easily, allowing businesses to grow rapidly through repeated monetization of live video.
Marketplace Platforms subsegment is seeing the biggest momentum in terms of growth due to their multiple vendors, wide assortment and built-in logistics systems that allow both sellers and consumers to enter the market easily and discover products easily, as well as quick and seamless check out processes.
The Advertising & Sponsorship segment is notable because money generated from branding activities and sponsorship relationships makes money from consumer attention independent of product purchasingactivities, thus allowing diversified income models for hosts and platforms. Branded and sponsored activities increase the budgeting of content productions, allow higher quality streaming services, and reinforce the branding messages that resonate with consumer purchasing intent. Such business model decreases dependency on order economics per person and allows for scalable income generation based on metrics.
Nevertheless, Commission-Based Sales have become the fastest growing income model due to fee structure being tied directly to performance, which reduces entry costs for sellers, incentivizes conversion efficiency, and encourages participation by sellers and joining of platforms.
To get detailed segments analysis, Request a Free Sample Report
Asia Pacific excels because of a combination of factors such as culture, technology, and commerce, which help promote quick uptake of interactive shopping experiences. This is driven by high mobile engagement, advanced technologies, and a retail environment that encourages social selling. The region's consumer behavior that supports real-time engagements enhances the conversion rate, as does the presence of robust vendor systems and payment systems that facilitate smoother transactions. The marketplaces and social networks in the Asia Pacific region conduct experiments and innovate on business models to encourage more content creators and merchants to join their network. The accommodating regulatory framework in support of digital payments and e-commerce advancements, along with fierce competition among different platforms, drives constant product and service innovation.
Live commerce in Japan is marked by the sophistication of consumers, who require the highest levels of trustworthiness and quality experiences. The traditional retailers and specialized creators rely on high-quality live-streaming to showcase product excellence and history. The integration of smooth transaction processes and loyalty programs is crucial for platforms, whereas brand and technology collaborations aim at creating high-quality video content.
Marketplaces for Live Commerce in South Korea are enabled by the digitally savvy audience and the country’s cultural preference for more entertaining, fun-led shopping experience. Combining the strengths of social media and commerce features, live broadcasts are produced. Retailers and cosmetics companies experiment with innovative formats and gamification to attract viewers, while platform companies focus on optimizing payment processing and discovery.
Growth in North America is based on cross-sector adaptation, platform development, and new retail approaches that focus on creating meaningful engagement through content in customer acquisition. There is experimentation among retailers and direct-to-consumer brands involving the use of live streaming to add a human element to their products and to minimize the process of discovery for consumers. Social networks and commerce platforms are incorporating native livestreams, which allows the transactional infrastructure to handle transactions in real-time. Marketers are placing a strong emphasis on measuring engagement for campaign optimization. Influencers, along with the high quality of content created by brands, pushes more established players to develop their own practices. The hunger for entertainment, coupled with investments into omnichannel, make it an ideal market for various business models to thrive.
Live Commerce Market in United States is characterized by the testing of various platforms on social media, markets, and retail sites to interact with the consumer segments. The brands will have to make investments towards creating good-quality content and promotions to transform views into buyers, and the partnerships with creators help in delivering the right message. Integration of payment, shipping, and customer service functions becomes crucial for sustained conversions.
The Live Commerce Market in Canada is one which is marked by omnichannel collaboration, where there is a partnership between local retailers and global platforms so as to access various consumer bases. The brands have a strategy for curating and creating trusted content, including being bilingual. There is a logistical structure and payment system which allows for cross-border transactions. There are also moderation policies which align with local preferences, with the help of creator partnerships.
Europe is reinforcing its strength through the strategic use of localization of platforms, innovation by retailers, and regulation that facilitates scaleable digital commerce. Existing retail chains and boutiques try out new live formats to foster connections with customers while platforms adapt their offerings based on the local language, payment methods, and other cultural considerations. Investments in the ecosystem of creators and professional production improve the quality of content to match that in traditional channels. Collaboration on the cross-border level by various platforms, logistics services, and payments partners minimizes barriers of entering markets. Focus on trustworthiness, consumer rights, and transparent moderation encourages adoption and integration of live commerce into omnichannel commerce strategies in Europe. Partnerships with tech vendors and media channels extend the reach of live commerce, and personalized recommendations based on analytics improve brand messaging to different audiences.
In Germany’s Live Commerce Market, regulation and retailer-led programs take center stage, placing emphasis on trust and transparency. Retailers and branded products showcase authenticity by providing the source and the technical specifications of the items to help consumers understand them better. The platform operators emphasize regulatory compliance, moderation, and local payment solutions. Technology and logistics companies work hand in hand to ensure delivery, while creators and brands uphold professional standards when creating their content.
UK Live Commerce Market combines the strengths of both retailing and media production in order to generate entertaining shopping shows. This involves brand collaboration with broadcasters in order to create stories-based live streams which focus on building trust to create an experience similar to what can be achieved in physical stores. Localization is done by adapting language and payments to local culture while regulation drives moderation practices.
Live Shopping in France integrates fashion and luxury industries with creativity through storytelling in creating aspirational live shopping broadcasts. This is done by the brands through their use of content and presentations to connect with the local audience. In terms of regulations, there is an increased focus on consumers' rights and content regulation. In addition, collaborations by producers, influencers, and designers focus on aesthetics and storytelling in live shopping.
To know more about the market opportunities by region and country, click here to
Buy The Complete Report
Increasing Mobile Device Penetration
The growing number of mobile devices has increased the ability of consumers to access interactive video content, giving consumers the freedom to engage in live streaming sessions from different places and times that suit them best. Ease of access has removed obstacles that would have prevented brand owners and content creators from reaching large numbers of viewers without making huge investments in building an elaborate platform. On-device payment capabilities have made it easier for people to move from being mere viewers to making purchases.
Integration with Social Platforms
Highly integrated use of social media channels uses the existing fan bases and interaction capabilities of those channels to speed up the process of discovery and building trust. Using live streams embedded in social newsfeeds and making use of special interactions available only within the platform, sellers and influencers can easily engage audiences and tell their stories without asking consumers to download a new application. Such placement increases the efficiency of organic dissemination and creates a greater potential for conversion and developing customer loyalty.
Quality Control and Trust Issues
Consumer worries over issues of product quality and the credibility of the sellers are major factors that may hinder their participation in live commerce. Consumers will be wary of participating in this format if they are faced with demonstrations or products that mislead or deceive them. The platforms find themselves challenged when trying to regulate these interactions as they are in real time and trying to prove the validity of what the sellers say. All this creates an atmosphere that requires cautious participation.
Payment Security and Fraud Concerns
Lack of perceived payment security and the danger of fraud could limit consumers' desire to purchase products when using live demonstrations, thus limiting conversion rates and confidence among merchants. In the absence of transparency in terms of the safety measures put in place, consumers will either postpone their purchases or simply not go ahead with them at all, limiting the usefulness of the medium in terms of conducting business. The task of ensuring that each transaction is authentic and resolving disputes becomes greater.
Request Free Customization of this report to help us to meet your business objectives.
In the global live commerce industry, competitive dynamics will center on platform consolidation, brand/retailer partnerships, and quick investments in technology. Companies will engage in mergers & acquisitions (M&A) for content creators, enter into exclusive partnerships to get products, and use AI and AR to improve discovery and conversions. Recent developments have included the launch of AnyMind’sGenAI solution for live commerce and marketplace acquisitions in the United States.
Shoppable Social Ecosystems: The consumer is expecting an integrated buying journey that is incorporated within the social platform itself and the stream that he or she watches, thereby forcing marketers to create a storefront that offers a fully integrated shopping experience in the stream itself, where users discover, learn about, and buy products without having to leave the channel. This creates an engaging experience for consumers based on interaction via live chat, instant offers, and curated drops.
Creator-Driven Commerce Growth: Creators are transforming into full-service commercial partnerships, where they work together on the creation and curation of products while taking an active role in discussions around aftercare, thus shifting the paradigm of trust and purchasing motives. The platforms help creators monetize through commerce tools and logistics integration, thus allowing storytelling across multiple formats as well as repeatable sales models. The brands place an emphasis on maintaining their relationship with creators and engaging in IPs, helping them create their unique stories and build communities around them.
SkyQuest’s ABIRAW (Advanced Business Intelligence, Research & Analysis Wing) is our Business Information Services team that Collects, Collates, Correlates, and Analyses the Data collected by means ofPrimary Exploratory Research backed by robust Secondary Desk research.
As per SkyQuest analysis, the live commerce is driven mainly by the combination of real-time video streaming and transactional e-commerce that turns watching into purchasing. Artificial Intelligence helps personalize and recommend in real time, thus improving user experience. Nevertheless, the problems of quality control and lack of trust on the part of both sellers and demonstration prevent wide adoption and increase the burden on moderation. The largest region is the Asia Pacific due to high mobile engagement, innovations in platforms, and social selling traditions. Social media platforms take the lead within the market because they are best at transforming audience into purchasers.
| Report Metric | Details |
|---|---|
| Market size value in 2024 | USD 1.05 Trillion |
| Market size value in 2033 | USD 7.02 Trillion |
| Growth Rate | 23.5% |
| Base year | 2024 |
| Forecast period | (2026-2033) |
| Forecast Unit (Value) | USD Trillion |
| Segments covered |
|
| Regions covered | North America (US, Canada), Europe (Germany, France, United Kingdom, Italy, Spain, Rest of Europe), Asia Pacific (China, India, Japan, Rest of Asia-Pacific), Latin America (Brazil, Rest of Latin America), Middle East & Africa (South Africa, GCC Countries, Rest of MEA) |
| Companies covered |
|
| Customization scope | Free report customization with purchase. Customization includes:-
|
To get a free trial access to our platform which is a one stop solution for all your data requirements for quicker decision making. This platform allows you to compare markets, competitors who are prominent in the market, and mega trends that are influencing the dynamics in the market. Also, get access to detailed SkyQuest exclusive matrix.
Table Of Content
Executive Summary
Market overview
Parent Market Analysis
Market overview
Market size
KEY MARKET INSIGHTS
COVID IMPACT
MARKET DYNAMICS & OUTLOOK
Market Size by Region
KEY COMPANY PROFILES
Methodology
For the Live Commerce Market, our research methodology involved a mixture of primary and secondary data sources. Key steps involved in the research process are listed below:
1. Information Procurement: This stage involved the procurement of Market data or related information via primary and secondary sources. The various secondary sources used included various company websites, annual reports, trade databases, and paid databases such as Hoover's, Bloomberg Business, Factiva, and Avention. Our team did 45 primary interactions Globally which included several stakeholders such as manufacturers, customers, key opinion leaders, etc. Overall, information procurement was one of the most extensive stages in our research process.
2. Information Analysis: This step involved triangulation of data through bottom-up and top-down approaches to estimate and validate the total size and future estimate of the Live Commerce Market.
3. Report Formulation: The final step entailed the placement of data points in appropriate Market spaces in an attempt to deduce viable conclusions.
4. Validation & Publishing: Validation is the most important step in the process. Validation & re-validation via an intricately designed process helped us finalize data points to be used for final calculations. The final Market estimates and forecasts were then aligned and sent to our panel of industry experts for validation of data. Once the validation was done the report was sent to our Quality Assurance team to ensure adherence to style guides, consistency & design.
Analyst Support
Customization Options
With the given market data, our dedicated team of analysts can offer you the following customization options are available for the Live Commerce Market:
Product Analysis: Product matrix, which offers a detailed comparison of the product portfolio of companies.
Regional Analysis: Further analysis of the Live Commerce Market for additional countries.
Competitive Analysis: Detailed analysis and profiling of additional Market players & comparative analysis of competitive products.
Go to Market Strategy: Find the high-growth channels to invest your marketing efforts and increase your customer base.
Innovation Mapping: Identify racial solutions and innovation, connected to deep ecosystems of innovators, start-ups, academics, and strategic partners.
Category Intelligence: Customized intelligence that is relevant to their supply Markets will enable them to make smarter sourcing decisions and improve their category management.
Public Company Transcript Analysis: To improve the investment performance by generating new alpha and making better-informed decisions.
Social Media Listening: To analyze the conversations and trends happening not just around your brand, but around your industry as a whole, and use those insights to make better Marketing decisions.
REQUEST FOR SAMPLE
 REQUEST FREE CUSTOMIZATION
Global Live Commerce Market size was valued at USD 1.05 Trillion in 2024 and is poised to grow from USD 1.3 Trillion in 2025 to USD 7.02 Trillion by 2033, growing at a CAGR of 23.5% during the forecast period (2026-2033).
Competitive dynamics in the global live commerce market revolve around platform consolidation, brand and retailer partnerships, and rapid technology investment. Firms pursue M&A to acquire creator supply, sign exclusive retail integrations to secure product drops, and deploy AI and AR to boost discovery and conversion. Notable recent moves include AnyMind’s GenAI live product and U.S. marketplace expansions and acquisitions by mid‑stage platforms. 'Alibaba Group', 'JD.com', 'PDD Holdings', 'Kuaishou Technology', 'Amazon.com', 'ByteDance', 'Whatnot', 'TalkShopLive', 'NTWRK', 'Bambuser', 'ShopShops', 'Popshop Live', 'Walmart', 'Meesho', 'Sea Limited', 'QVC Group', 'ChannelEngine', 'Tencent Holdings', 'eBay', 'NAVER Corporation'
Mobile device proliferation has expanded consumer access to immersive video experiences, enabling shoppers to join live streaming sessions from diverse locations and at convenient times. This widespread availability reduces friction in discovery and participation, allowing brands and creators to reach larger, more engaged audiences without heavy infrastructure investment. Enhanced on device cameras and integrated payment capabilities further simplify the path from viewing to purchasing, encouraging spontaneous transactions and repeat engagement while supporting platform scalability and merchant experimentation. This accessibility nurtures creative formats and longer engagement cycles.
Shoppable Social Ecosystems: Consumers increasingly expect seamless purchase journeys integrated directly into social platforms and livestreams, prompting brands to design immersive, interactive storefronts where discovery, demonstration, and checkout happen without leaving the broadcast. This trend elevates user engagement through real-time chat, instant offers, and curated drops, shifting marketing toward experience-led selling. Retailers and platforms collaborate to optimize discovery funnels, merchandising strategy, and content formats that foster immediacy and reduce friction, driving conversion through emotional resonance and community validation rather than traditional detached advertising.
Why does Asia Pacific Dominate the Global Live Commerce Market? |@12


Want to customize this report? This report can be personalized according to your needs. Our analysts and industry experts will work directly with you to understand your requirements and provide you with customized data in a short amount of time. We offer $1000 worth of FREE customization at the time of purchase.
Feedback From Our Clients


 USA (+1) 351-333-4748

