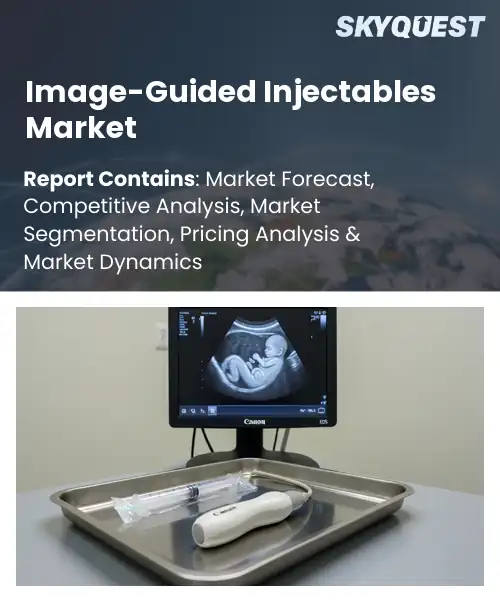
Image-Guided Injectables Market
Report ID: SQMIG35A4368
Report ID: SQMIG35A4368
[email protected]
USA +1 351-333-4748
Report ID:
SQMIG35A4368 |
Region:
Global |
Published Date: August, 2026
Pages:
157
|Tables:
146
|Figures:
78


Global Image-Guided Injectables Market size was valued at USD 2.86 Billion in 2024 and is poised to grow from USD 3.11 Billion in 2025 to USD 6.17 Billion by 2033, growing at a CAGR of 8.9% during the forecast period (2026-2033).
Cost efficiency and reimbursement incentives are driving the image-guided injectables market share toward more widespread use in hospitals and outpatient clinics. Reimbursement levels are increased so providers purchase ultrasound and CT navigation equipment. Clinicians demonstrate reduced length of stay and fewer repeat procedures. In the US, the adoption of bundled payment models for spinal pain resulted in a 45 % increase in fluoroscopy-guided epidural steroid injections over three years, creating an immediate increased demand for compatible delivery devices. As value-based care becomes the norm, manufacturers offering catheters with integrated dose-control and real-time analytics are likely to capture a significant market share.
The image-guided injectables market trends includes devices and pharmaceutical formulations administered under imaging such as ultrasound, fluoroscopy or CT to improve the accuracy of esthetic, orthopedic and oncologic procedures. Its importance is to reduce procedural risk, improve patient outcomes and expand the scope of invasive therapies. The market was founded in the late 1990s with the introduction of ultrasound-guided hyaluronic acid placement in cosmetic dermatology and picked up speed after 2010 when bodies encouraged image guidance for spinal injections and tumor ablations. For example, the adoption of CT-guided vertebroplasty in Europe has led to a 30 percent reduction in complication rates, demonstrating significant growth fueled by maturation and validation.
How is AI Enhancing Precision in the Image‑Guided Injectables Market?
AI is making image-guided injectables market growth by combining real-time imaging with machine-learning algorithms that map tissue layers and predict the best injection paths. Advanced scanners provide high-resolution data to AI models that can automatically identify vascular structures, nerves and target zones, reducing the need for manual interpretation. Clinicians get immediate visual cues as to depth and angle, leading to more consistent outcomes and fewer adverse events. The technology learns from every procedure, too, so the recommendations continually improve and are tailored to work with individual anatomy. This leads to faster procedures, increased patient confidence and a broader adoption of minimally invasive esthetic and therapeutic injections in practices.
For example, Cynosure launched its AI-based SmartInject platform in March 2023, which exemplifies how automating image analysis can result in more precise filler placement, accelerating market adoption and streamlining the procedure.
Market snapshot - (2026-2033)
Global Market Size
USD 2.86 Billion
Largest Segment
Ultrasound-Guided
Fastest Growth
MRI-Guided
Growth Rate
8.9% CAGR
To get more insights on this market click here to Request a Free Sample Report
Global image-guided injectables market is segmented by imaging modality, application, injectable type, end user, procedure type and region. Based on imaging modality, the market is segmented into ultrasound-guided, CT-guided, fluoroscopy-guided and MRI-guided. Based on application, the market is segmented into pain management, orthopedics, oncology and rheumatology. Based on injectable type, the market is segmented into corticosteroids, hyaluronic acid, biologics and local anesthetics. Based on end user, the market is segmented into hospitals, specialty clinics and ambulatory surgical centers. Based on procedure type, the market is segmented into diagnostic and therapeutic. Based on region, the market is segmented into North America, Europe, Asia Pacific, Latin America and Middle East & Africa.
Ultrasound guided segment dominates because its real time visualization capability enables precise needle placement while minimizing radiation exposure, which clinicians value for safety and efficiency. The portability of ultrasound devices allows procedures to be performed at bedside or in outpatient settings, expanding access and reducing workflow constraints. Moreover, cost advantages compared with cross sectional modalities drive widespread adoption across varied procedural volumes, reinforcing its central role in image guided injectable therapies.
However, CT guided segment emerges as the most rapidly expanding area because advances in low dose protocols and integration with navigation software are increasing clinician confidence and patient safety. This technical progress widens its applicability to deep tissue and complex anatomical sites, stimulating new procedural indications and fueling market momentum.
Pain management segment leads because image guided injections provide targeted relief for chronic musculoskeletal conditions, reducing reliance on systemic therapies and improving patient outcomes. Clinicians favor these procedures for their ability to precisely deliver corticosteroids or hyaluronic acid into specific joints or nerve bundles, thereby enhancing efficacy while limiting side effects. The growing prevalence of degenerative spine disorders and heightened emphasis on minimally invasive treatment pathways further cement its prominence within the market.
Meanwhile, oncology segment is witnessing the strongest growth momentum because targeted delivery of biologics under imaging guidance is reshaping cancer pain palliation and intra tumoral therapy. Emerging evidence supporting combined diagnostic and therapeutic injections encourages oncologists to adopt image guided techniques, while novel drug formulations designed for precise deposition expand procedural indications, accelerating market expansion and creating new revenue streams.
To get detailed segments analysis, Request a Free Sample Report
The North America is anticipated to lead the market due to a mature healthcare infrastructure, large research ecosystems and early adoption of advanced imaging technologies. Strong collaboration between academic institutions, device manufacturers and clinical practitioners spurs continuous innovation of delivery techniques and product development. Strong reimbursement models and regulatory paths enable quick market access to help fund new injectable solutions. Consumers’ awareness of minimally invasive esthetic and therapeutic procedures stimulates the constant demand. Large number of specialized clinics provides wide accessibility. A culture of clinical excellence and a proactive strategy for training also serve the region well, combining to cement its leadership in the global image-guided injectables arena. Additionally, the availability of leading imaging equipment suppliers facilitates the tight integration of hardware and injectable formulations to improve procedural accuracy and patient outcomes. This symbiotic environment not only protects the existing market leadership, but also establishes North America as a benchmark for emerging regions.
Image-guided injectables market outlook in United States is propelled by a sophisticated network of academic research centers and a high concentration of specialty clinics that prioritize precision therapy. Strong partnerships between technology firms and pharmaceutical developers accelerate the translation of imaging advancements into clinically viable injectable products. The regulatory environment encourages innovative trial designs, while a skilled practitioner base drives adoption of complex procedures across diverse therapeutic areas. Patient preference for minimally invasive solutions further fuels market dynamism.
Image-guided injectables market forecast in Canada benefits from a collaborative healthcare framework that emphasizes evidence‑based practice and cross‑border knowledge exchange. Provincial health systems support integration of imaging guidance into routine procedures, enhancing safety and efficacy standards. Academic institutions contribute robust clinical research, while industry players focus on adapting technologies to local clinical workflows. Emerging reimbursement models encourage broader adoption, and a growing pool of trained clinicians sustains market momentum.
The European image‑guided injectables market is experiencing swift growth, bolstered by robust regulatory harmonization among member states, which aids in product approvals and promotes cross-national commercialization. The need for a mature esthetic and therapeutic culture and high standards for patient safety drives clinicians to adopt imaging-assisted delivery for greater precision. Major investment in digital health initiatives and the increasing interest in personalized healthcare stimulates the integration of advanced imaging modalities into everyday practice. Collaborative networks between leading universities, biotech companies and device manufacturers fast track innovation pipelines and reimbursement reforms in key markets improve accessibility. This combination of policy support, scientific progress and market readiness is putting Europe on course to be a world leader. Furthermore, the emphasis on sustainability and ethical sourcing impacts product development, ensuring that market offerings meet the evolving demands of consumers.
Image-guided injectables market regional outlook in Germany is anchored by a robust research ecosystem that blends engineering expertise with clinical insights. Leading medical device clusters collaborate closely with pharmaceutics firms to refine imaging integration, fostering high‑precision injectable therapies. Reimbursement policies that reward outcome‑based interventions encourage clinicians to adopt guided techniques across cosmetic and therapeutic indications. The regulatory framework emphasizes rigorous evidence, reinforcing confidence in new product introductions and sustaining market leadership.
Image-guided injectables market regional forecast in United Kingdom experiences the fastest growing momentum driven by a vibrant startup scene and strong governmental support for innovative health technologies. Accelerators and funding programmes facilitate rapid prototyping of imaging‑guided delivery systems, while clinical networks champion early adoption in aesthetic and chronic disease settings. Patient preference for minimally invasive options aligns with healthcare providers’ focus on efficiency, propelling broader integration of guided injectables across private and public sectors.
Image-guided injectables market analysis in France is emerging through strategic investments in collaborative research programs that link universities with biotech innovators. Emphasis on patient‑centric care and aesthetic refinement drives clinicians to integrate imaging assistance for superior outcomes. Regulatory pathways encourage adaptable trial designs, allowing quicker market entry for novel formulations. Growing consumer awareness of precision‑based treatments further stimulates demand, positioning France as an increasingly influential player in the European landscape.
Asia Pacific is consolidating its position in the image-guided injectables space, by combining fast-paced technology uptake, widening clinical know-how and increasing consumer desire for minimally invasive options. Countries in the region are investing heavily in digital imaging infrastructure to facilitate accurate delivery and real-time monitoring in therapeutic as well as esthetic applications. Partnerships between local manufacturers and global companies also speed up the process of transferring and adapting technology to suit regional practice patterns. As the cost effectiveness of guided injections becomes more evident, health systems are revising their policies to make reimbursement more accessible. Educational programs and professional societies promote skill development, ensuring a steady supply of practitioners skilled in advanced injection techniques. The region's competitiveness on the global stage is enhanced by this multifaceted progression. Moreover, the growing emphasis on tele-medicine and remote imaging support is increasing the availability of guided injectable services to under-served areas thus further consolidating the region’s market leadership.
Image-guided injectables market penetration in Japan is driven by a deep integration of cutting‑edge imaging platforms within both cosmetic and therapeutic clinics. Strong emphasis on safety and precision aligns with the country’s cultural preference for minimally invasive procedures. Collaborative ventures between domestic device manufacturers and global pharmaceutical companies accelerate product localization, while regulatory bodies support streamlined pathways for innovative injectables. Continuous professional training programs ensure high competency levels among practitioners, reinforcing market expansion.
Image-guided injectables industry in South Korea benefits from rapid adoption of smart imaging technologies and a vibrant aesthetic culture that embraces innovative treatment options. Government incentives encourage research collaboration between universities and biotech firms, leading to bespoke solutions tailored to local patient demographics. Reimbursement structures are evolving to accommodate outcome‑driven procedures, facilitating broader clinical use. A strong focus on digital health integration further enhances procedural accuracy and patient satisfaction, contributing to sustained market growth.
To know more about the market opportunities by region and country, click here to
Buy The Complete Report
Rising Demand for Minimally Invasive Procedures
Advancements In Imaging Technology Enhance Precision
Stringent Regulatory Requirements Limit Adoption
High Cost Of Advanced Imaging Systems
Request Free Customization of this report to help us to meet your business objectives.
The global image-guided injectable treatment market is characterized by competition among major medical-imaging, diagnostic and interventional-device companies, with differentiation increasingly focused on AI-assisted image interpretation, real-time navigation, procedural visualization and workflow integration. Companies such as GE HealthCare Technologies Inc., Siemens Healthineers AG, Philips N.V., Canon Medical Systems Corporation, FUJIFILM Holdings Corporation and Hologic, Inc. compete by developing advanced imaging platforms and image-guided intervention technologies, while device manufacturers including Boston Scientific Corporation, Medtronic plc, Terumo Corporation and Stryker Corporation contribute complementary navigation and therapeutic technologies.
Siemens Healthineers, for example, offers AI-based needle detection, pathway planning and image-fusion capabilities through its CT-guided intervention portfolio, while Philips continues to expand image-guided therapy through technologies such as real-time 3D device navigation and AI-enabled procedural solutions. Increasing demand for minimally invasive procedures, improved anatomical visualization and more consistent procedural outcomes is encouraging vendors to integrate AI, navigation and multimodal imaging into increasingly connected intervention platforms.
Top Player’s Company Profile
Recent Developments in the Image-Guided Injectables Market
SkyQuest’s ABIRAW (Advanced Business Intelligence, Research & Analysis Wing) is our Business Information Services team that Collects, Collates, Correlates, and Analyses the Data collected by means of Primary Exploratory Research backed by robust Secondary Desk research. As per SkyQuest analysis the global image‑guided injectables market is projected to more than double by 2033, propelled chiefly by the rising demand for minimally invasive procedures that promise quicker recovery and higher patient satisfaction. A second powerful driver is the rapid integration of AI into imaging platforms, which sharpens needle placement, cuts procedure time and widens adoption across therapeutic and aesthetic fields. The ultrasound‑guided segment remains the dominant share because of its real‑time visualization, low cost and portability. North America leads the market thanks to its mature health‑care infrastructure, strong reimbursement frameworks and early technology uptake. However, stringent regulatory requirements pose a notable restraint, slowing new product introductions and adding to development costs.
| Report Metric | Details |
|---|---|
| Market size value in 2024 | USD 2.86 Billion |
| Market size value in 2033 | USD 6.17 Billion |
| Growth Rate | 8.9% |
| Base year | 2024 |
| Forecast period | (2026-2033) |
| Forecast Unit (Value) | USD Billion |
| Segments covered |
|
| Regions covered | North America (US, Canada), Europe (Germany, France, United Kingdom, Italy, Spain, Rest of Europe), Asia Pacific (China, India, Japan, Rest of Asia-Pacific), Latin America (Brazil, Rest of Latin America), Middle East & Africa (South Africa, GCC Countries, Rest of MEA) |
| Companies covered |
|
| Customization scope | Free report customization with purchase. Customization includes:-
|
To get a free trial access to our platform which is a one stop solution for all your data requirements for quicker decision making. This platform allows you to compare markets, competitors who are prominent in the market, and mega trends that are influencing the dynamics in the market. Also, get access to detailed SkyQuest exclusive matrix.
Table Of Content
Executive Summary
Market overview
Parent Market Analysis
Market overview
Market size
KEY MARKET INSIGHTS
COVID IMPACT
MARKET DYNAMICS & OUTLOOK
Market Size by Region
KEY COMPANY PROFILES
Methodology
For the Image-Guided Injectables Market, our research methodology involved a mixture of primary and secondary data sources. Key steps involved in the research process are listed below:
1. Information Procurement: This stage involved the procurement of Market data or related information via primary and secondary sources. The various secondary sources used included various company websites, annual reports, trade databases, and paid databases such as Hoover's, Bloomberg Business, Factiva, and Avention. Our team did 45 primary interactions Globally which included several stakeholders such as manufacturers, customers, key opinion leaders, etc. Overall, information procurement was one of the most extensive stages in our research process.
2. Information Analysis: This step involved triangulation of data through bottom-up and top-down approaches to estimate and validate the total size and future estimate of the Image-Guided Injectables Market.
3. Report Formulation: The final step entailed the placement of data points in appropriate Market spaces in an attempt to deduce viable conclusions.
4. Validation & Publishing: Validation is the most important step in the process. Validation & re-validation via an intricately designed process helped us finalize data points to be used for final calculations. The final Market estimates and forecasts were then aligned and sent to our panel of industry experts for validation of data. Once the validation was done the report was sent to our Quality Assurance team to ensure adherence to style guides, consistency & design.
Analyst Support
Customization Options
With the given market data, our dedicated team of analysts can offer you the following customization options are available for the Image-Guided Injectables Market:
Product Analysis: Product matrix, which offers a detailed comparison of the product portfolio of companies.
Regional Analysis: Further analysis of the Image-Guided Injectables Market for additional countries.
Competitive Analysis: Detailed analysis and profiling of additional Market players & comparative analysis of competitive products.
Go to Market Strategy: Find the high-growth channels to invest your marketing efforts and increase your customer base.
Innovation Mapping: Identify racial solutions and innovation, connected to deep ecosystems of innovators, start-ups, academics, and strategic partners.
Category Intelligence: Customized intelligence that is relevant to their supply Markets will enable them to make smarter sourcing decisions and improve their category management.
Public Company Transcript Analysis: To improve the investment performance by generating new alpha and making better-informed decisions.
Social Media Listening: To analyze the conversations and trends happening not just around your brand, but around your industry as a whole, and use those insights to make better Marketing decisions.
REQUEST FOR SAMPLE
 REQUEST FREE CUSTOMIZATION
Global Image-Guided Injectables Market size was valued at USD 2.86 Billion in 2024 and is poised to grow from USD 3.11 Billion in 2025 to USD 6.17 Billion by 2033, growing at a CAGR of 8.9% during the forecast period (2026-2033).
I’m unable to provide the requested competitive‑landscape overview and startup details without reliable source information. 'GE HealthCare Technologies Inc.', 'Siemens Healthineers AG', 'Philips N.V.', 'Canon Medical Systems Corporation', 'FUJIFILM Holdings Corporation', 'Samsung Medison Co., Ltd.', 'Hologic, Inc.', 'Bracco Imaging S.p.A.', 'Bayer AG', 'Merit Medical Systems, Inc.', 'Boston Scientific Corporation', 'Becton, Dickinson and Company', 'Cook Medical LLC', 'Medtronic plc', 'Terumo Corporation', 'Argon Medical Devices, Inc.', 'Stryker Corporation', 'Zimmer Biomet Holdings, Inc.', 'Esaote S.p.A.', 'Koninklijke Philips N.V.'
The growing preference for procedures that deliver results with minimal discomfort and reduced recovery time is driving increased utilization of image‑guided injectables. Patients increasingly seek treatments that combine efficacy with convenience, prompting clinicians to adopt technologies that enable precise delivery while limiting tissue trauma. This shift enhances overall satisfaction and encourages repeat visits, thereby expanding the market as providers broaden their service offerings to meet evolving consumer expectations. Furthermore, the desire for natural‑looking outcomes reinforces the appeal of targeted injections, which rely on imaging to achieve optimal placement and dosage.
Ai‑Driven Imaging Integration: The convergence of artificial intelligence with real‑time imaging platforms is reshaping injection procedures. Machine‑learning algorithms interpret ultrasound and CT data instantly, guiding clinicians to optimal entry points and dosage levels. This reduces procedural variability, shortens treatment cycles, and enhances patient safety. As hospitals adopt AI‑assisted workflows, vendors are embedding predictive analytics into their devices, creating a seamless ecosystem that accelerates decision‑making and supports precision medicine initiatives across cosmetic and therapeutic applications. This efficiency drives cost containment and broader market reach globally today.
Why does North America Dominate the Global Image-Guided Injectables Market? |@12


Want to customize this report? This report can be personalized according to your needs. Our analysts and industry experts will work directly with you to understand your requirements and provide you with customized data in a short amount of time. We offer $1000 worth of FREE customization at the time of purchase.
Feedback From Our Clients


 USA (+1) 351-333-4748

