Image-guided Therapy Systems Market
Report ID: SQMIG35A3408
Report ID: SQMIG35A3408
[email protected]
USA +1 351-333-4748
Report ID:
SQMIG35A3408 |
Region:
Global |
Published Date: May, 2026
Pages:
157
|Tables:
183
|Figures:
79


Global Image-Guided Therapy Systems Market size was valued at USD 6.1 Billion in 2024 and is poised to grow from USD 6.42 Billion in 2025 to USD 9.63 Billion by 2033, growing at a CAGR of 5.2% during the forecast period (2026-2033).
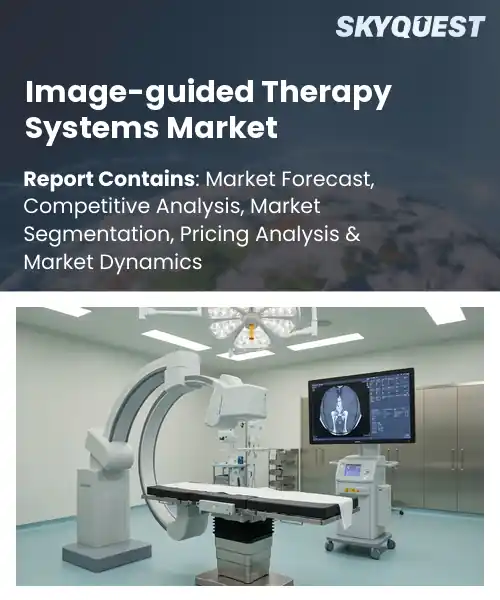
The image-guided therapy systems industry is about setups that blend real time imaging with surgical and interventional care , so clinicians can see the anatomy and where the instruments actually are while the procedure is happening. It matters, because clearer visualization can make the procedure finish faster, reduce the odds of complications, and help the team choose minimally invasive pathways which often means better patient results and lower overall costs. Over time this space moved away from mostly fluoroscopy and ultrasound and more toward integrated CT and MRI platforms, and navigation software, and even robotic help. Like hybrid operating rooms now support complicated cardiac and neurovascular work that used to be done with more open surgery , so that shift is important.
The main driver behind the global image-guided therapy systems market growth is rising demand for precision medicine and a preference for less invasive care. And building on that , the dominant market factor is rapid progress in multimodal imaging and navigation, which pushes adoption. As image quality gets sharper and workflow automation gets smoother, clinicians can carry out complex percutaneous interventions with shorter hospital stays, fewer complications, and cost savings, which then makes hospitals more willing to invest. At the same time reimbursement decisions tend to look more favorable. For instance, image fusion can speed up the decision process for stroke thrombectomy and that is linked with improved recanalization rates. Also cone beam CT-guided ablation in interventional oncology can improve local control, which is another cause-and-effect loop that keeps momentum going. Because of those dynamics, there are opportunities for AI-enhanced planning tools, software models, and expansion into emerging markets across the globe.
AI is enhancing procedural accuracy by improving image clarity and then automating anatomy recognition. It also helps with patient motion compensation and supports more accurate instrument tracking. Machine learning models can merge multiple imaging types and perform automated segmentation, which cuts down variability when clinicians are identifying the target. Real-time analytics then give decision support during the intervention, and help the team stay aligned with preoperative plans. Together, these features make complex minimally invasive procedures more predictable and easier to repeat with consistent results. Vendors are embedding AI into navigation and imaging platforms to reduce clinician mental effort and to streamline the workflow so that device placement and therapy delivery end up being more uniform and dependable.
Market snapshot - (2026-2033)
Global Market Size
USD 6.1 Billion
Largest Segment
X-ray-guided Therapy Systems
Fastest Growth
MRI-guided Therapy Systems
Growth Rate
5.2% CAGR
To get more insights on this market click here to Request a Free Sample Report
Global image-guided therapy systems market is segmented by by product type, by application, by procedure type, by end user, by technology, by mobility and region. Based on by product type, the market is segmented into X-ray-guided Therapy Systems, Ultrasound-guided Therapy Systems, CT-guided Therapy Systems, MRI-guided Therapy Systems, Nuclear Imaging-guided Therapy Systems and Hybrid Image-guided Therapy Systems. Based on by application, the market is segmented into Cardiology Procedures, Oncology Procedures, Neurology Procedures, Orthopedic Procedures, Urology Procedures, Gastroenterology Procedures and Others. Based on by procedure type, the market is segmented into Minimally Invasive Surgery, Interventional Radiology, Radiation Therapy, Ablation Therapy, Biopsy Procedures and Others. Based on by end user, the market is segmented into Hospitals, Ambulatory Surgical Centers, Specialty Clinics, Academic & Research Institutes and Others. Based on by technology, the market is segmented into 2D Imaging-guided Systems, 3D Imaging-guided Systems, AI-enabled Image-guided Systems and Robotic-assisted Image-guided Systems. Based on by mobility, the market is segmented into Fixed Systems and Mobile Systems. Based on region, the market is segmented into North America, Europe, Asia Pacific, Latin America and Middle East & Africa.
As per the image-guided therapy systems market analysis, the MRI-guided Therapy Systems currently lead the segment, because MRI delivers better soft tissue contrast, and the multipla nar viewing helps a lot with procedural accuracy. In practice, clinicians use MRI for interventions where accurate tissue differentiation and real-time feedback lower the chance of complications, so hospitals end up adopting it, and they even invest more. And there are ongoing upgrades too, like improved MR compatibility, smoother procedural workflows, and more clinical proof, which keeps reinforcing demand and also helps it blend deeper into these complex therapeutic suites over time.
However, the Hybrid Image-guided Therapy Systems are showing up as the most rapidly expanding part. They merge complementary modalities to handle what each one can’t do alone, and that also enables multimodal workflows. As they can pull in different imaging sources, they widen the number of procedural applications, support cross-disciplinary care pathways, and it really helps platform development move faster, so adoption grows, and it also opens up new opportunities both clinically and commercially, in parallel.
According to the image-guided therapy systems market forecast, the AI-enabled Image-guided Systems dominated the market, since advanced algorithms help with image reconstruction, they handle anomaly detection in a more automated way, and they provide real-time decision support that boosts diagnostic confidence as well as procedural precision. In other words, these systems reduce mental load, and they streamline the workflow by surfacing what matters first. They also support adaptive procedural planning, which then encourages institutional investment, and it drives continuous learning from clinical data, so performance gets refined and validated, and use cases keep expanding.
Whereas the Robotic-assisted Image-guided Systems category is predicted to lead and achieve the largest image-guided therapy systems market share, largely because they help deliver precise instrument control using imaging feedback. This expands how far minimally invasive and complex procedures can go. When robotics and imaging converge, reproducibility improves, outcome variability drops, and there’s more attraction from technology partnerships. So overall, it creates a fertile ground for new solutions, procedure standardization, and faster clinical adoption, even when things get complicated.
To get detailed segments analysis, Request a Free Sample Report
As per the image-guided therapy systems market regional forecast, North America's dominance comes from a convergence of advanced clinical infrastructure plus more concentrated innovation muscle, and commercial conditions that make image-guided therapy systems easier to take off. Big manufacturers, and also a dense web of specialty hospitals, set up a strong demand vibe for both incremental and disruptive types of technologies. At the same time, older reimbursement routes and supportive regulatory processes help turn plans into real market momentum, and eventually scale. Industry, universities, and clinical opinion leaders collaborate closely, which means evidence lands faster and product iterations keep happening, more or less, on a steady loop. There is also capital availability, plus a service ecosystem that is already mature for training, upkeep, and software integration, which all together help hold leadership. The regional emphasis on minimally invasive procedures and value based care models keeps pushing demand for unified imaging, navigation, and therapy platforms, because these tend to improve outcomes and operational efficiency, at the same time.
United States Image-guided Therapy Systems Market
The Image-guided Therapy Systems sector in the United States is shaped by a tight concentration of original equipment manufacturers, major academic medical centers, and high procedure volumes that encourage quick validation and adoption. The market gains momentum from deep clinical research networks and local innovation clusters, which help product development and early clinical uptake. Providers tend to favor platforms that tie together imaging, navigation, and data analytics to handle more complicated interventions, and collaborations between industry partners and clinical institutions help move concepts from prototype to everyday use.
Canada Image-guided Therapy Systems Market
The Image-guided Therapy Systems industry in Canada leans on a healthcare delivery style influenced by provincial procurement, along with coordinated adoption across top tertiary centers. Clinical uptake is backed by strong interventional radiology cardiology programs in academic hospitals, and somehow there’s this sense that the whole thing is not just theory, but practically moving forward. There also seems like a clear emphasis on fair access plus training that works for dispersed populations, even when logistics get awkward. Partnerships with international manufacturers, and regional health technology assessment activities, they end up shaping buying decisions too. Meanwhile, service and maintenance models are tuned for local geography and institutional constraints, so utilization stays consistent over time.
The fast expansion across Europe is powered by a blend of strong industrial capability, public and private investments in advanced care pathways, and research ecosystems that connect hospitals, manufacturers, and clinical communities. Procurement that leans on value, and the preference for minimally invasive interventions, encourages the adoption of image-guided therapy systems that can prove clinical benefit and efficiency gains. Cross-border clinical collaborations and broadly harmonized standards support evidence generation and market entry, while national innovation hubs and medical technology clusters keep pushing product refinement and local manufacturing. In addition, varied payer models and centralized purchasing structures in many countries open pathways for scaling deployment across tertiary and regional centers, and that keeps growth steady continent-wide.
Germany Image-guided Therapy Systems Market
The image-guided therapy systems market in Germany is anchored by a strong medical technology manufacturing base, plus a dense hospital landscape that together allow quick clinical evaluation and deployment. Strong ties between industry and research institutions support iterative innovation, and the existence of specialized centers of excellence boosts demand for advanced imaging and navigation platforms. Procurement routines, along with a general culture of clinical excellence, support investment in systems that enhance procedural accuracy and throughput, which reinforces Germany's position as a regional leader.
United Kingdom Image-guided Therapy Systems Market
In the United Kingdom, the Image guided Therapy Systems Market is seeing a quicker take up, mostly because there are nationwide efforts to modernize clinical pathways and boost process efficiency. Large clinical networks, along with centralized buying models, helps bring more of the already proven solutions out into everyday practice. On top of that, cooperation between academic centers and industry teams supports local trials, and it makes implementation studies happen more smoothly. The focus on cost-effectiveness and patient results supports the adoption of integrated imaging approaches across cardiology, oncology, and vascular services, which positions the market as a quick growth setting.
France Image-guided Therapy Systems Market
The Image-guided Therapy Systems Market in France is taking shape through focused investments in regional centers of excellence, combined with coordinated procurement strategies that tend to favor high-value interventions. National clinical networks and hospital groups are increasingly leaning toward minimally invasive methods that are supported by advanced imaging and navigation systems. Local manufacturing partnerships and an active medical research community add momentum to a growing interest in digital integration and procedural standardization. All of that supports broader market development, even if adoption patterns vary by region.
Asia Pacific is steadily growing its market standing by blending domestic know-how, careful healthcare funding and then a strategic handshake with global tech companies. A lot of local manufacturers are now rolling out competitive imaging and intervention platforms , and meanwhile international vendors are tweaking their offerings so they fit regional clinical routines, and also the usual procurement habits. On top of that, government programs meant to modernize hospital infrastructure and expand specialty services are pulling in more buyers in big urban areas , and clinical education tracks help interventionalists actually adopt the tools in practice. There’s also a heavy stress on digital connectivity and the linking of these platforms with hospital information systems, which is where a lot of the value comes from. Finally, export minded manufacturing hubs keep pushing the region toward higher visibility in the world supply chain for image guided therapy solutions.
Japan Image-guided Therapy Systems Market
The Image-guided Therapy Systems Market in Japan is backed by a solid industrial web focused on advanced imaging and precision engineering, where the players are often respected for system orchestration and day-to-day trustworthiness. Clinical sites tend to favor high clarity imaging platforms and the integration that works alongside surgical robotics and navigation solutions. In general, the market leans on long-range service readiness, as well as clinical proof. Industry relationships with medical centers are collaborative enough to allow iterative refinements, so adoption stays durable in specialty care environments.
South Korea Image-guided Therapy Systems Market
The Image-guided Therapy Systems Market in South Korea shows up as fast technological uptake, and strong electronic manufacturing strength, and ongoing cooperation between hospitals and the industry. Suppliers move quickly to adopt compact, high-performance imaging and navigation systems, all while keeping efficiency and patient flow targets in mind. Export focus also matters a lot, because innovation in imaging sensors and the software layer supports both local demand and cross-border competitiveness. At the same time, targeted government backing and industry partnerships speed up clinical verification and commercialization.
To know more about the market opportunities by region and country, click here to
Buy The Complete Report
Rising Demand For Minimally Invasive Procedures
Technological Advancements In Imaging
High Capital Investment Requirements
Complex Regulatory Compliance Requirements
Request Free Customization of this report to help us to meet your business objectives.
Competitive dynamics in the global image-guided therapy systems market feel like they move fast, mostly because regulatory-led product releases happen quickly, startups tend to merge into incumbents, and strategic collaborations help clinical uptake. Basically, companies push acquisitions and investor-backed scale-ups, but they also release newly cleared AI and robotics-driven platforms. A few more visible signals lately are Caranx pushing FDA-cleared intraoperative AI guidance and Mendaera getting their FDA 510k for a handheld robotic needle guidance system, and that shifts how vendors try to position themselves.
Top Player’s Company Profile
Recent Developments in the Image-Guided Therapy Systems Market
SkyQuest’s ABIRAW (Advanced Business Intelligence, Research & Analysis Wing) is our Business Information Services team that Collects, Collates, Correlates, and Analyses the Data collected by means of Primary Exploratory Research backed by robust Secondary Desk research.
As per SkyQuest analysis, the global image-guided therapy systems market is mainly being powered by the rising need for minimally invasive and precision procedures. As a secondary driver, rapid technological progress in multimodal imaging, AI-enabled guidance and robotic integration is also playing a big role. North America still leads, largely because of stronger clinical infrastructure, clearer reimbursement paths, and a dense cluster of innovation. Within that, MRI-guided therapy systems are the leading segment, mainly due to better soft tissue contrast and real-time feedback during procedures. A major limiter is the high capital spending needed for sophisticated platforms, infrastructure upgrades, and continuing maintenance. Even so, the momentum keeps tilting toward integrated, AI-enhanced, and hybrid systems that can widen clinical use-cases.
| Report Metric | Details |
|---|---|
| Market size value in 2024 | USD 6.1 Billion |
| Market size value in 2033 | USD 9.63 Billion |
| Growth Rate | 5.2% |
| Base year | 2024 |
| Forecast period | (2026-2033) |
| Forecast Unit (Value) | USD Billion |
| Segments covered |
|
| Regions covered | North America (US, Canada), Europe (Germany, France, United Kingdom, Italy, Spain, Rest of Europe), Asia Pacific (China, India, Japan, Rest of Asia-Pacific), Latin America (Brazil, Rest of Latin America), Middle East & Africa (South Africa, GCC Countries, Rest of MEA) |
| Companies covered |
|
| Customization scope | Free report customization with purchase. Customization includes:-
|
To get a free trial access to our platform which is a one stop solution for all your data requirements for quicker decision making. This platform allows you to compare markets, competitors who are prominent in the market, and mega trends that are influencing the dynamics in the market. Also, get access to detailed SkyQuest exclusive matrix.
Table Of Content
Executive Summary
Market overview
Parent Market Analysis
Market overview
Market size
KEY MARKET INSIGHTS
COVID IMPACT
MARKET DYNAMICS & OUTLOOK
Market Size by Region
KEY COMPANY PROFILES
Methodology
For the Image-guided Therapy Systems Market, our research methodology involved a mixture of primary and secondary data sources. Key steps involved in the research process are listed below:
1. Information Procurement: This stage involved the procurement of Market data or related information via primary and secondary sources. The various secondary sources used included various company websites, annual reports, trade databases, and paid databases such as Hoover's, Bloomberg Business, Factiva, and Avention. Our team did 45 primary interactions Globally which included several stakeholders such as manufacturers, customers, key opinion leaders, etc. Overall, information procurement was one of the most extensive stages in our research process.
2. Information Analysis: This step involved triangulation of data through bottom-up and top-down approaches to estimate and validate the total size and future estimate of the Image-guided Therapy Systems Market.
3. Report Formulation: The final step entailed the placement of data points in appropriate Market spaces in an attempt to deduce viable conclusions.
4. Validation & Publishing: Validation is the most important step in the process. Validation & re-validation via an intricately designed process helped us finalize data points to be used for final calculations. The final Market estimates and forecasts were then aligned and sent to our panel of industry experts for validation of data. Once the validation was done the report was sent to our Quality Assurance team to ensure adherence to style guides, consistency & design.
Analyst Support
Customization Options
With the given market data, our dedicated team of analysts can offer you the following customization options are available for the Image-guided Therapy Systems Market:
Product Analysis: Product matrix, which offers a detailed comparison of the product portfolio of companies.
Regional Analysis: Further analysis of the Image-guided Therapy Systems Market for additional countries.
Competitive Analysis: Detailed analysis and profiling of additional Market players & comparative analysis of competitive products.
Go to Market Strategy: Find the high-growth channels to invest your marketing efforts and increase your customer base.
Innovation Mapping: Identify racial solutions and innovation, connected to deep ecosystems of innovators, start-ups, academics, and strategic partners.
Category Intelligence: Customized intelligence that is relevant to their supply Markets will enable them to make smarter sourcing decisions and improve their category management.
Public Company Transcript Analysis: To improve the investment performance by generating new alpha and making better-informed decisions.
Social Media Listening: To analyze the conversations and trends happening not just around your brand, but around your industry as a whole, and use those insights to make better Marketing decisions.
REQUEST FOR SAMPLE
 REQUEST FREE CUSTOMIZATION
Global Image-Guided Therapy Systems Market size was valued at USD 6.1 Billion in 2024 and is poised to grow from USD 6.42 Billion in 2025 to USD 9.63 Billion by 2033, growing at a CAGR of 5.2% during the forecast period (2026-2033).
Competitive dynamics in the global image guided therapy systems market are driven by rapid regulatory led product rollouts, startup to incumbent consolidation, and strategic partnerships that accelerate clinical adoption. Companies pursue acquisitions and investor backed scale ups while launching cleared AI and robotics enabled platforms. Recent examples include Caranx advancing FDA cleared intraoperative AI guidance and Mendaera's FDA 510k for a handheld robotic needle guidance system, reshaping vendor positioning. 'Siemens Healthineers', 'GE HealthCare', 'Philips Healthcare', 'Canon Medical Systems', 'Fujifilm Holdings', 'Medtronic', 'Stryker', 'Brainlab', 'Varian Medical Systems', 'Elekta', 'Olympus Corporation', 'Johnson & Johnson', 'Zimmer Biomet', 'Intuitive Surgical', 'Hitachi Healthcare', 'Shimadzu Corporation', 'Ziehm Imaging', 'Hologic', 'Boston Scientific', 'Karl Storz'
The growing preference for minimally invasive procedures has prompted healthcare providers to prioritize technologies that enhance precision and reduce patient trauma, leading to greater adoption of image-guided therapy systems. Clinicians seek tools that improve visualization and enable accurate targeting, which supports better clinical outcomes and reduces procedure variability. Hospitals and surgical centers view these systems as integral to expanding service lines and maintaining competitive quality of care, motivating investment in equipment and training that directly fuels market demand for advanced image-guided therapy solutions.
Ai-Enabled Procedural Precision: Integration of advanced computational imaging and decision support is driving more precise, adaptive intraoperative guidance. Systems increasingly combine machine learning with multimodal imaging to enhance visualization, automate routine tasks, and support clinician judgment, improving procedural consistency and enabling personalized approaches. Interoperability efforts and partnerships among device makers, software vendors, and hospital IT teams streamline workflows, reduce cognitive load, and foster continuous algorithm refinement based on clinical feedback, positioning intelligent image guidance as a central enabler of quality care across specialties.
Why does North America Dominate the Global Image-guided Therapy Systems Market? |@12


Want to customize this report? This report can be personalized according to your needs. Our analysts and industry experts will work directly with you to understand your requirements and provide you with customized data in a short amount of time. We offer $1000 worth of FREE customization at the time of purchase.
Feedback From Our Clients


 USA (+1) 351-333-4748

