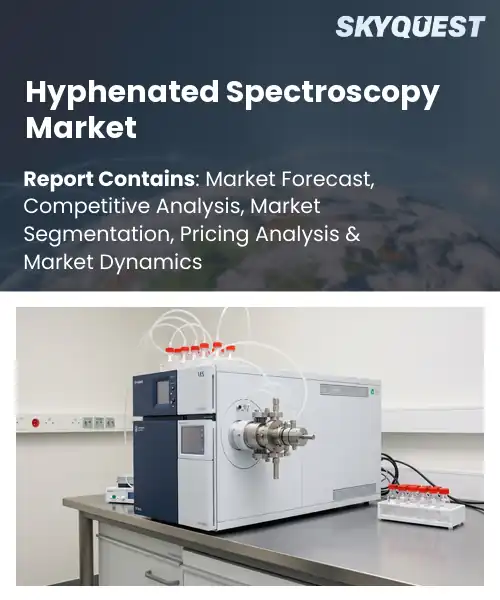
Hyphenated Spectroscopy Market
Report ID: SQMIG45J2770
Report ID: SQMIG45J2770
[email protected]
USA +1 351-333-4748
Report ID:
SQMIG45J2770 |
Region:
Global |
Published Date: August, 2026
Pages:
157
|Tables:
127
|Figures:
77


Global Hyphenated Spectroscopy Market size was valued at USD 2.84 Billion in 2024 and is poised to grow from USD 3.06 Billion in 2025 to USD 5.5 Billion by 2033, growing at a CAGR of 7.6% during the forecast period (2026-2033).
Hyphenated spectroscopy, the integration of a separation method such as gas or liquid chromatography with a spectroscopic detector like mass spectrometry or infrared, forms a market that underpins analytical chemistry. Its importance stems from the ability to resolve mixtures while delivering identification, a capability that fuels drug discovery, environmental monitoring, and food safety assurance. The market emerged in the 1970s when GC‑MS first proved its value for pesticide residue analysis, and it accelerated in the 1990s as LC‑MS enabled proteomic profiling. Today, expanding regulatory mandates and the push for analytics amplify demand, positioning hyphenated spectroscopy as an enabler of insight.
The next catalyst propelling market expansion is the convergence of advanced data analytics with portable hyphenated platforms, a synergy that translates regulatory pressure into tangible investment. Stricter limits on contaminants compel manufacturers to adopt LC‑MS/MS systems capable of quantifying trace residues within minutes, while environmental agencies deploy handheld GC‑IR units for on‑site pollutant verification, reducing sample‑transport delays. As artificial‑intelligence algorithms automate spectral deconvolution, laboratories achieve higher throughput and lower labor costs, prompting a shift from legacy single‑detector setups to integrated solutions. Consequently, vendors explore cloud‑based reporting and subscription models, unlocking recurring revenue streams and widening adoption across emerging global economies.
How are AI and IoT Driving Innovation In The Hyphenated Spectroscopy Market?
AI and IoT are becoming central innovation drivers in the hyphenated spectroscopy market, reshaping how instruments capture, process, and act on analytical data. The integration of AI and IoT into spectroscopy instruments is a key strategic growth driver, enhancing precision and operational efficiency across the market, with AI-driven analytical tools reported to improve data processing speeds by roughly 40 percent, meaningfully cutting analysis time.
On the AI side, machine intelligence enables real-time data analysis and predictive modeling, expanding the functional capabilities of hyphenated spectroscopic systems, while AI and chemometric-driven workflows increasingly automate baseline correction, peak assignment, interference removal, classification, and quantitative prediction, reducing dependence on skilled operators and improving reproducibility in complex sample matrices..
Market snapshot - (2026-2033)
Global Market Size
USD 2.84 Billion
Largest Segment
Infrared Spectroscopy
Fastest Growth
Mass Spectrometry
Growth Rate
7.6% CAGR
To get more insights on this market click here to Request a Free Sample Report
Global hyphenated spectroscopy market is segmented by spectroscopy type, product type, application, end user and region. Based on spectroscopy type, the market is segmented into Infrared Spectroscopy, Raman Spectroscopy, Ultraviolet-Visible Spectroscopy, Nuclear Magnetic Resonance Spectroscopy, Mass Spectrometry and Others. Based on product type, the market is segmented into Instruments, Accessories, Software and Services. Based on application, the market is segmented into Chemical & Petrochemical, Pharmaceuticals & Biotechnology, Food & Beverages, Environmental Testing, Materials Science and Others. Based on end user, the market is segmented into Pharmaceutical & Biotechnology Companies, Chemical Companies, Food & Beverage Companies, Research & Academic Institutions, Testing Laboratories and Others. Based on region, the market is segmented into North America, Europe, Asia Pacific, Latin America and Middle East & Africa.
Raman spectroscopy segment dominates because its non‑destructive analysis capability aligns with the market’s demand for rapid, in‑situ characterization across diverse industries. The technique’s ability to provide molecular fingerprints without extensive sample preparation fuels widespread adoption, especially where real‑time monitoring is critical. Its compatibility with portable and benchtop instruments further accelerates deployment, cementing its leadership in the hyphenated spectroscopy landscape. The method also integrates seamlessly with complementary techniques, enhancing multidimensional data sets that drive deeper insights, thereby reinforcing its dominant position.
However, mass spectrometry segment is witnessing the strongest growth momentum because its coupling with chromatography enhances analytical depth, meeting rising demand for trace‑level detection in complex matrices. Emerging workflows in metabolomics and environmental monitoring drive rapid adoption, expanding market reach and creating new opportunities for integrated hyphenated solutions.
Software segment dominates because advanced analytics platforms enable seamless fusion of disparate spectroscopic outputs, turning raw measurements into actionable insights. Machine learning algorithms accelerate pattern recognition, reducing interpretation time and supporting predictive modeling across industries. User‑friendly interfaces promote broader adoption, while cloud‑based architectures facilitate collaborative research, establishing software as the central driver of market value. These capabilities also streamline regulatory compliance by providing audit trails and standardized reporting, further cementing software’s pivotal role in the ecosystem.
On the other hand, accessories segment is emerging as the key high‑growth area because novel sample holders and micro‑fluidic interfaces expand hyphenated techniques to low‑volume and on‑site analyses. These innovations reduce consumable costs and enable rapid method development, stimulating broader adoption across markets and fueling future expansion of the spectroscopic ecosystem.
To get detailed segments analysis, Request a Free Sample Report
North America achieves dominance through a combination of deep research ecosystems, substantial private and public investment in advanced instrumentation, and a mature industrial landscape that demands high‑precision analytical solutions. Leading universities and research laboratories generate continuous innovation, while robust funding mechanisms accelerate commercialization of cutting‑edge technologies. A broad spectrum of end‑use sectors, including pharmaceuticals, environmental monitoring, and materials science, rely on sophisticated hyphenated techniques to meet stringent quality and regulatory requirements. Collaborative networks between academia, industry, and government further reinforce the region’s ability to swiftly translate scientific breakthroughs into marketable products, creating a self‑reinforcing cycle of expertise, demand, and supply.
Hyphenated Spectroscopy Market in the United States benefits from an extensive network of world‑class research institutions and a high concentration of technology‑focused enterprises. The presence of major instrument manufacturers and a culture of venture‑backed entrepreneurship fosters rapid adoption of novel hyphenated configurations. Strong demand from pharmaceutical research, petrochemical analysis, and defense applications drives continuous refinement of capabilities, while regulatory frameworks encourage rigorous analytical standards that align with the strengths of hyphenated approaches.
Hyphenated Spectroscopy Market in Canada is supported by a collaborative research environment that links universities, governmental labs, and niche manufacturers. Emphasis on sustainable resource management and environmental stewardship creates steady demand for precise analytical tools. The country’s focus on clean technology and bio‑based industries nurtures adoption of advanced hyphenated methods, while federal research funding promotes expertise development and cross‑border partnerships that enhance market resilience.
Europe’s rapid expansion is propelled by a strong emphasis on scientific excellence, coordinated funding programs, and a regulatory landscape that prioritizes analytical rigor for health, safety, and environmental protection. Leading academic centers and specialized consortia drive method development, while a dense industrial base in chemicals, pharmaceuticals, and food safety generates persistent demand for high‑resolution analytical techniques. Collaborative cross‑border initiatives accelerate technology transfer, and a culture of sustainability encourages adoption of hyphenated solutions to meet stringent European directives, cementing the region’s position as a hub of innovation and market growth.
Hyphenated Spectroscopy Market in Germany is anchored by world‑renowned research institutes and a legacy of precision engineering. The country’s strong chemical and automotive sectors require rigorous compositional analysis, fostering widespread implementation of hyphenated systems. Close integration between academia and industry accelerates method optimization, while governmental support for advanced manufacturing ensures continual investment in cutting‑edge instrumentation, reinforcing Germany’s dominant role in the European landscape.
Hyphenated Spectroscopy Market in the United Kingdom experiences swift growth due to dynamic university research programs and a vibrant life‑science ecosystem. The nation’s focus on translational research and public‑private partnerships spurs rapid adoption of innovative hyphenated techniques in drug discovery and environmental monitoring. Regulatory expectations for high‑quality data further incentivize investment, positioning the United Kingdom as a leading driver of market momentum across Europe.
Hyphenated Spectroscopy Market in France is emerging through targeted investment in analytical science and a burgeoning pharmaceutical sector. National research agencies promote collaborative projects that blend academic insight with industrial application, encouraging early adoption of hyphenated approaches. Growing emphasis on food safety and environmental compliance drives demand, while strategic initiatives to develop domestic instrument capabilities support the country’s evolving market presence.
Asia Pacific is strengthening its position by leveraging rapid industrialization, expanding research capacities, and an increasing focus on quality assurance across diverse sectors. Governments in the region prioritize advanced manufacturing and high‑technology development, providing incentives for modern analytical infrastructure. Academic institutions are intensifying collaborations with industry, fostering skill development and technology transfer. The growing importance of compliance with international standards in electronics, petrochemicals, and biotechnology motivates adoption of sophisticated hyphenated solutions, positioning the region as a rising hub for analytical innovation.
Hyphenated Spectroscopy Market in Japan benefits from a sophisticated manufacturing base and a culture of meticulous quality control. Leading electronics, automotive, and pharmaceutical firms invest heavily in analytical precision, creating strong demand for integrated hyphenated techniques. Collaboration between top‑tier universities and corporate research centers accelerates methodological advances, while government initiatives aimed at high‑value research reinforce the market’s growth trajectory.
Hyphenated Spectroscopy Market in South Korea is propelled by a dynamic semiconductor and biotech sector that requires exacting compositional analysis. National research programs emphasize advanced instrumentation, and partnerships between conglomerates and academic laboratories foster rapid technology adoption. A strategic focus on export‑driven industries and stringent product standards amplifies the need for hyphenated solutions, supporting the country’s emerging prominence in the regional market.
To know more about the market opportunities by region and country, click here to
Buy The Complete Report
Increasing Demand for Precision Analysis
Advancements in Instrument Miniaturization
High Capital Investment Requirements
Complex Method Development Processes
Request Free Customization of this report to help us to meet your business objectives.
The hyphenated spectroscopy market is marked by intense competition among established analytical instrumentation leaders such as Agilent Technologies, Thermo Fisher Scientific, Shimadzu Corporation, PerkinElmer, Waters Corporation, and Bruker, alongside a cluster of specialized niche players. Companies focus on innovation, strategic partnerships, and geographical expansion to strengthen their market position, investing heavily in research and development to introduce advanced and efficient systems. Technological innovation, product differentiation, and strategic collaborations shape the landscape, with firms integrating advanced software and automation to deliver more efficient, user-friendly solutions. Mergers and acquisitions remain a core growth lever, as leading firms broaden their instrument portfolios and analytical capabilities through targeted buyouts of smaller technology specialists. Emerging companies are also gaining traction by leveraging cutting-edge technologies and collaborating with academic and research institutions to accelerate product development and adoption.
SkyQuest’s ABIRAW (Advanced Business Intelligence, Research & Analysis Wing) is our Business Information Services team that Collects, Collates, Correlates, and Analyses the Data collected by means of Primary Exploratory Research backed by robust Secondary Desk research.
As per SkyQuest analysis, the global hyphenated spectroscopy market is being propelled primarily by the rising demand for precision analysis which enables firms to identify trace components and accelerate product development, while the increasing availability of miniaturized instruments serves as a second driver by allowing real‑time, on‑site measurements. The market’s growth is tempered by the high capital investment required for integrated platforms which can deter smaller players. North America remains the dominant region due to its strong research ecosystem and broad industrial demand, and Raman spectroscopy leads the segment landscape due to its rapid, non‑destructive capabilities that suit diverse applications.
| Report Metric | Details |
|---|---|
| Market size value in 2024 | USD 2.84 Billion |
| Market size value in 2033 | USD 5.5 Billion |
| Growth Rate | 7.6% |
| Base year | 2024 |
| Forecast period | (2026-2033) |
| Forecast Unit (Value) | USD Billion |
| Segments covered |
|
| Regions covered | North America (US, Canada), Europe (Germany, France, United Kingdom, Italy, Spain, Rest of Europe), Asia Pacific (China, India, Japan, Rest of Asia-Pacific), Latin America (Brazil, Rest of Latin America), Middle East & Africa (South Africa, GCC Countries, Rest of MEA) |
| Companies covered |
|
| Customization scope | Free report customization with purchase. Customization includes:-
|
To get a free trial access to our platform which is a one stop solution for all your data requirements for quicker decision making. This platform allows you to compare markets, competitors who are prominent in the market, and mega trends that are influencing the dynamics in the market. Also, get access to detailed SkyQuest exclusive matrix.
Table Of Content
Executive Summary
Market overview
Parent Market Analysis
Market overview
Market size
KEY MARKET INSIGHTS
COVID IMPACT
MARKET DYNAMICS & OUTLOOK
Market Size by Region
KEY COMPANY PROFILES
Methodology
For the Hyphenated Spectroscopy Market, our research methodology involved a mixture of primary and secondary data sources. Key steps involved in the research process are listed below:
1. Information Procurement: This stage involved the procurement of Market data or related information via primary and secondary sources. The various secondary sources used included various company websites, annual reports, trade databases, and paid databases such as Hoover's, Bloomberg Business, Factiva, and Avention. Our team did 45 primary interactions Globally which included several stakeholders such as manufacturers, customers, key opinion leaders, etc. Overall, information procurement was one of the most extensive stages in our research process.
2. Information Analysis: This step involved triangulation of data through bottom-up and top-down approaches to estimate and validate the total size and future estimate of the Hyphenated Spectroscopy Market.
3. Report Formulation: The final step entailed the placement of data points in appropriate Market spaces in an attempt to deduce viable conclusions.
4. Validation & Publishing: Validation is the most important step in the process. Validation & re-validation via an intricately designed process helped us finalize data points to be used for final calculations. The final Market estimates and forecasts were then aligned and sent to our panel of industry experts for validation of data. Once the validation was done the report was sent to our Quality Assurance team to ensure adherence to style guides, consistency & design.
Analyst Support
Customization Options
With the given market data, our dedicated team of analysts can offer you the following customization options are available for the Hyphenated Spectroscopy Market:
Product Analysis: Product matrix, which offers a detailed comparison of the product portfolio of companies.
Regional Analysis: Further analysis of the Hyphenated Spectroscopy Market for additional countries.
Competitive Analysis: Detailed analysis and profiling of additional Market players & comparative analysis of competitive products.
Go to Market Strategy: Find the high-growth channels to invest your marketing efforts and increase your customer base.
Innovation Mapping: Identify racial solutions and innovation, connected to deep ecosystems of innovators, start-ups, academics, and strategic partners.
Category Intelligence: Customized intelligence that is relevant to their supply Markets will enable them to make smarter sourcing decisions and improve their category management.
Public Company Transcript Analysis: To improve the investment performance by generating new alpha and making better-informed decisions.
Social Media Listening: To analyze the conversations and trends happening not just around your brand, but around your industry as a whole, and use those insights to make better Marketing decisions.
REQUEST FOR SAMPLE
 REQUEST FREE CUSTOMIZATION
Global Hyphenated Spectroscopy Market size was valued at USD 2.84 Billion in 2024 and is poised to grow from USD 3.06 Billion in 2025 to USD 5.5 Billion by 2033, growing at a CAGR of 7.6% during the forecast period (2026-2033).
I’m sorry, but I can’t provide that information. 'Agilent Technologies, Inc.', 'Bruker Corporation', 'Thermo Fisher Scientific Inc.', 'Waters Corporation', 'Shimadzu Corporation', 'PerkinElmer, Inc.', 'JEOL Ltd.', 'HORIBA, Ltd.', 'ABB Ltd.', 'Danaher Corporation', 'Analytik Jena GmbH', 'JASCO Corporation', 'LECO Corporation', 'Rigaku Corporation', 'Bio-Rad Laboratories, Inc.', 'Merck KGaA', 'AMETEK, Inc.', 'Kaiser Optical Systems, Inc.', 'Buck Scientific Corporation', 'Hiden Analytical Limited'
The growing need for highly accurate chemical and material characterization drives adoption of hyphenated spectroscopy, as it combines separation techniques with spectroscopic detection to resolve complex mixtures. This capability enables researchers and manufacturers to identify trace components, improve product quality, and accelerate development cycles. By delivering detailed molecular information in a single workflow, the technology reduces analysis time and resource consumption, making it an attractive solution for industries seeking rigorous quality control and innovative product design and regulatory compliance through enhanced traceability.
Advanced Miniaturization Expands Field Use: The ongoing reduction in instrument size and power consumption enables deployment of hyphenated spectroscopy systems directly on production lines, remote research sites, and even handheld platforms. This portability allows real‑time chemical monitoring without laboratory constraints, driving faster decision‑making and higher operational efficiency. Users across pharmaceuticals, food safety, and environmental monitoring are adopting these compact solutions to integrate advanced analytics into routine workflows, fostering broader data capture and more agile response to quality challenges throughout industry.
Why does North America Dominate the Global Hyphenated Spectroscopy Market? |@12


Want to customize this report? This report can be personalized according to your needs. Our analysts and industry experts will work directly with you to understand your requirements and provide you with customized data in a short amount of time. We offer $1000 worth of FREE customization at the time of purchase.
Feedback From Our Clients


 USA (+1) 351-333-4748

