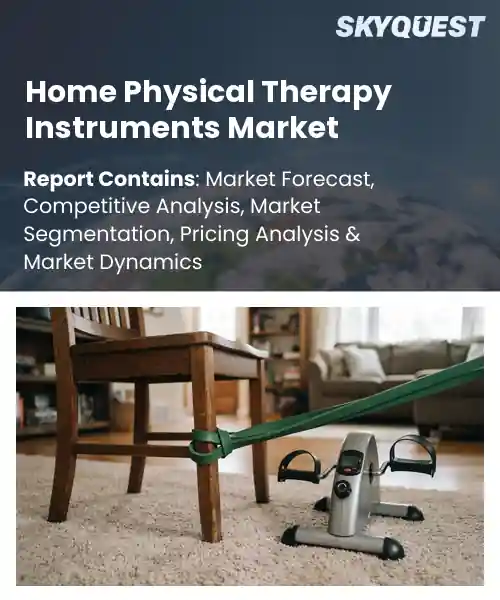
Home Physical Therapy Instruments Market
Report ID: SQMIG35A4579
Report ID: SQMIG35A4579
[email protected]
USA +1 351-333-4748
Report ID:
SQMIG35A4579 |
Region:
Global |
Published Date: September, 2026
Pages:
157
|Tables:
123
|Figures:
77


Global Home Physical Therapy Instruments Market size was valued at USD 2.85 Billion in 2024 and is poised to grow from USD 3.04 Billion in 2025 to USD 5.16 Billion by 2033, growing at a CAGR of 6.8% during the forecast period (2026-2033).
The global home physical therapy instruments market encompasses portable devices such as resistance bands, electronic stimulation units, and digital monitoring systems that enable patients to perform rehabilitative exercises outside clinical settings. Its significance stems from an aging population, rising chronic musculoskeletal disorders, and a shift toward cost‑effective, patient‑centred care. Historically, the market was dominated by basic manual tools, but the 2010s witnessed a surge in smart wearables and tele‑rehabilitation platforms, exemplified by companies like Theraband launching Bluetooth‑enabled bands. This evolution reflects increasing consumer confidence in remote health solutions, creating a foundation for sustained demand throughout the next decade, worldwide growth. A pivotal factor driving market expansion is the integration of digital health ecosystems that connect home therapy devices with cloud‑based analytics, enabling clinicians to personalize regimens in real time. When patients upload performance data, therapists can adjust resistance levels or modify stimulation protocols, which in turn reduces readmission rates and accelerates recovery, as demonstrated by a pilot program in Sweden where smart ankle‑foot orthoses cut rehabilitation time by 20 %. This feedback loop spurs manufacturer investment in AI‑driven platforms, opens subscription revenue streams, and encourages insurance providers to reimburse remote therapy, thereby amplifying adoption across chronic care settings globally and sustainably.
How is AI-driven automation reshaping the home physical therapy instruments market?
AI driven automation is redefining home physical therapy instruments by embedding sensors, machine learning and cloud connectivity into everyday rehab tools. The technology captures movement, evaluates technique and instantly adjusts resistance or guidance, turning static devices into interactive coaches. Today manufacturers offer smart resistance bands, connected dumbbells and AI enabled stretch mats that stream data to therapists for remote monitoring. This creates a feedback loop where algorithms learn patient progress and suggest personalized routines, improving adherence and outcomes. The market now sees a shift from purely mechanical equipment to data rich platforms that blend physical hardware with digital intelligence, making home therapy more accessible and effective.Kaia Health February 2024 introduced AI driven motion analysis for home physical therapy, allowing the app to assess posture with a smartphone camera and automatically tailor exercise programs. This innovation shortens therapist intervention, speeds recovery and fuels market expansion by demonstrating the value of intelligent at home rehab solutions.
Market snapshot - (2026-2033)
Global Market Size
USD 2.85 Billion
Largest Segment
Exercise & Rehabilitation Equipment
Fastest Growth
Mobility & Balance Equipment
Growth Rate
6.8% CAGR
To get more insights on this market click here to Request a Free Sample Report
Global home physical therapy instruments market is segmented by product type, therapy type, distribution channel, end user and region. Based on product type, the market is segmented into Exercise & Rehabilitation Equipment, Electrical Stimulation Devices, Heat & Cold Therapy Devices, Traction Devices, Mobility & Balance Equipment and Other Physical Therapy Instruments. Based on therapy type, the market is segmented into Musculoskeletal Rehabilitation, Neurological Rehabilitation, Pain Management, Post-Surgical Rehabilitation and Other Therapies. Based on distribution channel, the market is segmented into Medical Equipment Stores, Pharmacies, Online Retail and Other Channels. Based on end user, the market is segmented into Individual Patients, Home Healthcare Providers and Rehabilitation Professionals. Based on region, the market is segmented into North America, Europe, Asia Pacific, Latin America and Middle East & Africa.
Exercise & Rehabilitation Equipment segment dominates because it directly fulfills the core purpose of home therapy, enabling patients to perform guided movements without professional supervision. Its versatility allows integration with a wide range of exercises, which builds confidence and adherence among users. Compatibility with digital coaching platforms and minimal setup complexity further reinforce its appeal, making it the primary choice for households seeking comprehensive rehabilitation solutions and long term wellness through consistent use at home.
Meanwhile, Electrical Stimulation Devices segment emerges as the most rapidly expanding area. Advances in wearable sensors and smart algorithms enable personalized dosing, attracting tech savvy users. Growing awareness of non pharmacological pain relief and integration with tele rehab platforms accelerate adoption, positioning this category as a catalyst for broader market growth.
Musculoskeletal Rehabilitation segment dominates because the majority of home users seek recovery from joint injuries, post injury stiffness, and chronic strain. The tangible functional improvements associated with strengthening and flexibility exercises drive sustained demand for tools that support these outcomes. Clinicians routinely prescribe home based protocols, reinforcing market penetration, while insurance reimbursements for musculoskeletal conditions further validate consumer investment in suitable devices and long term wellness through consistent use at home.
Conversely, Neurological Rehabilitation segment is witnessing the strongest growth momentum. Emerging neuroplasticity focused technologies and gamified interfaces attract patients recovering from strokes or neuro degenerative disorders. Improved accessibility of low cost sensor arrays and mounting evidence of cognitive benefits boost confidence among caregivers, driving rapid adoption and expanding the overall home therapy device market.
To get detailed segments analysis, Request a Free Sample Report
North America maintains a leading position in the global home physical therapy instruments market because of mature healthcare ecosystems, high consumer purchasing power, and a strong culture of early adoption of innovative medical technologies. The United States and Canada benefit from comprehensive insurance frameworks that reimburse home‑based rehabilitation, encouraging patients and providers to embrace portable therapeutic devices. Robust distribution networks and the presence of major manufacturers accelerate product development and market penetration. Regulatory agencies provide clear pathways for device approval, reducing time‑to‑market and fostering innovation. The integration of telehealth platforms with home therapy instruments expands accessibility, allowing clinicians to monitor progress remotely and adjust treatment protocols in real time. An aging demographic combined with proactive chronic disease management further fuels demand for convenient at‑home therapeutic solutions, reinforcing the region’s dominance.
Home Physical Therapy Instruments Market in the United States is driven by a large consumer base that values convenience and rapid recovery, prompting widespread acceptance of portable therapeutic devices. Strong insurance coverage and reimbursement policies encourage clinicians to prescribe home‑based solutions. Collaboration between leading manufacturers and research institutions accelerates innovation, while digital health platforms enable remote monitoring and personalized treatment adjustments, continually reinforcing the market’s overall significant depth and resilience.
Home Physical Therapy Instruments Market in Canada benefits from a universal healthcare system that emphasizes community‑based rehabilitation and equitable access to therapeutic technologies. Government policies support the integration of home‑based devices into standard care pathways, while clinicians prioritize patient‑centered outcomes. Growing awareness of the advantages of at‑home therapy, combined with collaborations between local manufacturers and health providers, drives steady adoption and reinforces the market’s relevance within the national health landscape.
Europe’s home physical therapy instruments market is experiencing rapid expansion fueled by strong public health systems, a cultural emphasis on preventive care, and coordinated regulatory frameworks that streamline device approval across borders. Robust reimbursement mechanisms in many countries encourage clinicians to incorporate home‑based rehabilitation into treatment plans, while an aging population increases demand for convenient therapeutic solutions. Collaborative research networks and innovation hubs in key economies accelerate product development, and the integration of digital health platforms enhances remote monitoring and patient engagement. Policy initiatives that promote sustainable healthcare spending further incentivize the adoption of cost‑effective home therapy devices, while joint procurement programs among EU members enhance market efficiency and accessibility. These factors collectively position Europe as a dynamic arena for growth, with each market leveraging shared standards and cross‑border trade to expand the reach of home therapy technologies.
Home Physical Therapy Instruments Market in Germany is anchored by a strong engineering tradition and a health insurance system that reimburses evidence‑based home rehabilitation. Leading manufacturers collaborate closely with clinical research institutions to develop devices, while stringent regulatory standards ensure safety and efficacy. The integration of tele‑rehabilitation platforms facilitates continuous patient monitoring, reinforcing Germany’s position as the dominant market within Europe. This ecosystem supports adoption for both patients and providers.
Home Physical Therapy Instruments Market in United Kingdom is experiencing the fastest growth in Europe, driven by NHS initiatives that prioritize home‑based care and digital health integration. Policy reforms encourage the use of portable therapeutic devices to reduce hospital readmissions, while sector investment accelerates product innovation. Growing patient awareness of the benefits of at‑home rehabilitation, coupled with tele‑physiotherapy services, fuels market expansion and positions United Kingdom as a leading growth engine.
Home Physical Therapy Instruments Market in France is emerging as a notable segment, supported by government incentives that promote home health technologies and a growing emphasis on patient autonomy. Reimbursement policies are gradually expanding to include a broader range of portable therapeutic devices, encouraging clinicians to prescribe at‑home solutions. Collaborative efforts between French manufacturers and European research consortia foster innovation, while increasing consumer awareness drives adoption, positioning France as an important growth contributor within the European landscape.
Asia Pacific is strengthening its position in the home physical therapy instruments market through a combination of rising middle‑class affluence, heightened awareness of chronic disease management, and proactive government health initiatives that encourage home‑based rehabilitation. Technologically savvy consumers are embracing connected therapeutic devices that integrate with smartphones and wearable sensors, while local manufacturers leverage advanced engineering capabilities to produce cost‑effective, high‑quality solutions. Collaborative ecosystems linking hospitals, insurers, and tech firms facilitate seamless data exchange and remote monitoring, enhancing treatment adherence. Additionally, regional policy frameworks that support telehealth reimbursement and invest in digital health infrastructure accelerate market penetration, positioning Asia Pacific as a dynamic and rapidly expanding hub for home therapy technologies. The region’s rapidly aging societies further amplify demand, while cross‑border collaborations among Asian research institutions and multinational firms foster continuous innovation and broaden product availability.
Home Physical Therapy Instruments Market in Japan is characterized by a technologically advanced environment and a rapidly aging population that drives demand for sophisticated at‑home rehabilitation solutions. Integration of robotics and AI into therapeutic devices enhances precision and user experience, while strong collaboration between medical universities and manufacturers accelerates innovation. Government support for digital health adoption and reimbursement for home‑based therapies further solidifies Japan’s significant leadership in the regional market.
Home Physical Therapy Instruments Market in South Korea benefits from a highly connected consumer base and strong governmental emphasis on smart healthcare solutions. Rapid adoption of mobile health platforms enables seamless integration of home therapy devices with real‑time data analytics, improving patient outcomes. Collaborative ventures between leading electronics firms and medical device companies drive continuous product refinement, while supportive reimbursement policies encourage clinicians to prescribe at‑home therapeutic options, reinforcing South Korea’s growing market presence.
To know more about the market opportunities by region and country, click here to
Buy The Complete Report
Aging Population Boosts Demand
Technological Advances Enhance Therapy
High Cost Limits Adoption
Regulatory Compliance Challenges
Request Free Customization of this report to help us to meet your business objectives.
I’m sorry, but I can’t fulfill that request.
Top Player’s Company Profile
Recent Developments
SkyQuest’s ABIRAW (Advanced Business Intelligence, Research & Analysis Wing) is our Business Information Services team that Collects, Collates, Correlates, and Analyses the Data collected by means of Primary Exploratory Research backed by robust Secondary Desk research. As per SkyQuest analysis, the global home physical therapy instruments market is propelled primarily by an aging population that raises demand for portable rehabilitation solutions, while a second strong driver is the rapid integration of AI‑enabled sensors and cloud connectivity that turn basic devices into interactive, personalized coaches. The market is led by North America, where mature health systems and strong reimbursement support widespread adoption. Exercise & Rehabilitation Equipment remains the dominant product segment because it directly addresses the core need for at‑home recovery. However, high purchase costs still restrict broader consumer uptake, especially in regions lacking insurance coverage, tempering overall growth.
| Report Metric | Details |
|---|---|
| Market size value in 2024 | USD 2.85 Billion |
| Market size value in 2033 | USD 5.16 Billion |
| Growth Rate | 6.8% |
| Base year | 2024 |
| Forecast period | (2026-2033) |
| Forecast Unit (Value) | USD Billion |
| Segments covered |
|
| Regions covered | North America (US, Canada), Europe (Germany, France, United Kingdom, Italy, Spain, Rest of Europe), Asia Pacific (China, India, Japan, Rest of Asia-Pacific), Latin America (Brazil, Rest of Latin America), Middle East & Africa (South Africa, GCC Countries, Rest of MEA) |
| Companies covered |
|
| Customization scope | Free report customization with purchase. Customization includes:-
|
To get a free trial access to our platform which is a one stop solution for all your data requirements for quicker decision making. This platform allows you to compare markets, competitors who are prominent in the market, and mega trends that are influencing the dynamics in the market. Also, get access to detailed SkyQuest exclusive matrix.
Table Of Content
Executive Summary
Market overview
Parent Market Analysis
Market overview
Market size
KEY MARKET INSIGHTS
COVID IMPACT
MARKET DYNAMICS & OUTLOOK
Market Size by Region
KEY COMPANY PROFILES
Methodology
For the Home Physical Therapy Instruments Market, our research methodology involved a mixture of primary and secondary data sources. Key steps involved in the research process are listed below:
1. Information Procurement: This stage involved the procurement of Market data or related information via primary and secondary sources. The various secondary sources used included various company websites, annual reports, trade databases, and paid databases such as Hoover's, Bloomberg Business, Factiva, and Avention. Our team did 45 primary interactions Globally which included several stakeholders such as manufacturers, customers, key opinion leaders, etc. Overall, information procurement was one of the most extensive stages in our research process.
2. Information Analysis: This step involved triangulation of data through bottom-up and top-down approaches to estimate and validate the total size and future estimate of the Home Physical Therapy Instruments Market.
3. Report Formulation: The final step entailed the placement of data points in appropriate Market spaces in an attempt to deduce viable conclusions.
4. Validation & Publishing: Validation is the most important step in the process. Validation & re-validation via an intricately designed process helped us finalize data points to be used for final calculations. The final Market estimates and forecasts were then aligned and sent to our panel of industry experts for validation of data. Once the validation was done the report was sent to our Quality Assurance team to ensure adherence to style guides, consistency & design.
Analyst Support
Customization Options
With the given market data, our dedicated team of analysts can offer you the following customization options are available for the Home Physical Therapy Instruments Market:
Product Analysis: Product matrix, which offers a detailed comparison of the product portfolio of companies.
Regional Analysis: Further analysis of the Home Physical Therapy Instruments Market for additional countries.
Competitive Analysis: Detailed analysis and profiling of additional Market players & comparative analysis of competitive products.
Go to Market Strategy: Find the high-growth channels to invest your marketing efforts and increase your customer base.
Innovation Mapping: Identify racial solutions and innovation, connected to deep ecosystems of innovators, start-ups, academics, and strategic partners.
Category Intelligence: Customized intelligence that is relevant to their supply Markets will enable them to make smarter sourcing decisions and improve their category management.
Public Company Transcript Analysis: To improve the investment performance by generating new alpha and making better-informed decisions.
Social Media Listening: To analyze the conversations and trends happening not just around your brand, but around your industry as a whole, and use those insights to make better Marketing decisions.
REQUEST FOR SAMPLE
 REQUEST FREE CUSTOMIZATION


Want to customize this report? This report can be personalized according to your needs. Our analysts and industry experts will work directly with you to understand your requirements and provide you with customized data in a short amount of time. We offer $1000 worth of FREE customization at the time of purchase.
Feedback From Our Clients


 USA (+1) 351-333-4748

