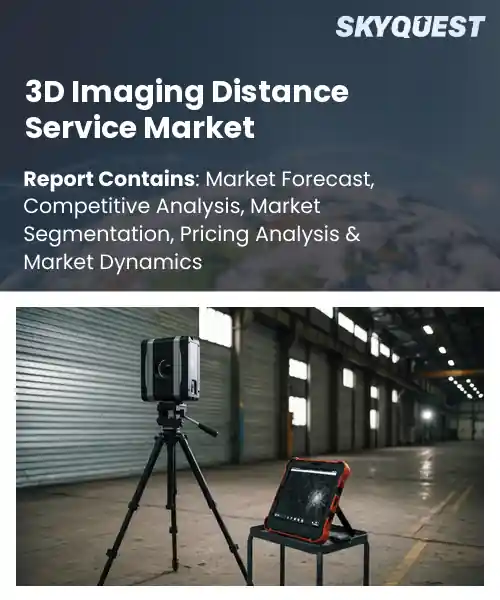
3D Imaging Distance Service Market
Report ID: SQMIG45B2399
Report ID: SQMIG45B2399
[email protected]
USA +1 351-333-4748
Report ID:
SQMIG45B2399 |
Region:
Global |
Published Date: August, 2026
Pages:
157
|Tables:
121
|Figures:
77


Global 3D Imaging Distance Service Market size was valued at USD 186.2 Million in 2024 and is poised to grow from USD 204.08 Million in 2025 to USD 424.89 Million by 2033, growing at a CAGR of 9.6% during the forecast period (2026-2033).
One pivotal factor driving the market forward is integration of data streaming with enterprise resource planning (ERP) systems, which turns raw 3D captures into actionable insights for decision‑makers. When manufacturers link on‑site scans directly to inventory modules, they can instantly detect deviations, schedule corrective maintenance, and avoid production bottlenecks, thereby boosting equipment effectiveness. This capability has opened lucrative opportunities in oil‑and‑gas, where remote monitoring of pipeline infrastructure reduces downtime, and in telemedicine, where clinicians receive precise anatomical models without patient travel. Consequently, vendors offering platforms combining capture hardware, cloud processing, and API connectivity are seeing accelerated revenue growth and market penetration.
How is AI-driven automation impacting the 3D imaging distance service market?
AI driven automation is reshaping the 3D imaging distance service market by streamlining data capture, processing, and delivery. Providers now use machine learning models to clean point clouds, fill gaps, and generate realistic textures without manual intervention. This reduces turnaround time and lowers the need for onsite technicians, allowing clients to request virtual tours from remote locations. The technology also enables adaptive scanning that focuses on areas of interest, improving detail where it matters most. As a result, firms can scale operations, serve a broader geographic base, and offer more consistent quality, making remote 3D services more accessible and reliable.
Matterport June 2023, launched an AI powered remote capture platform that automatically aligns scans and creates immersive models, cutting the need for manual stitching and speeding client approvals. This innovation demonstrates how AI driven automation boosts efficiency and fuels growth in the 3D imaging distance service market.
Market snapshot - (2026-2033)
Global Market Size
USD 186.2 Million
Largest Segment
Distance Measurement Services
Fastest Growth
Digital Twin Services
Growth Rate
9.6% CAGR
To get more insights on this market click here to Request a Free Sample Report
Global 3d imaging distance service market is segmented by service type, technology, deployment mode, end user and region. Based on service type, the market is segmented into Distance Measurement Services, 3D Mapping Services, Inspection & Survey Services and Digital Twin Services. Based on technology, the market is segmented into LiDAR, Photogrammetry, Structured Light Imaging and Time-of-Flight (ToF). Based on deployment mode, the market is segmented into Onsite Services and Cloud-Based Services. Based on end user, the market is segmented into Construction & Infrastructure, Manufacturing, Mining, Energy & Utilities, Transportation & Logistics and Government & Public Sector. Based on region, the market is segmented into North America, Europe, Asia Pacific, Latin America and Middle East & Africa.
Distance Measurement Services segment dominates because it provides the core capability of quantifying spatial relationships, which is essential for virtually every 3d imaging application. Its simplicity, reliability, and direct relevance to project planning make it the go to offering for clients seeking precise distance data. The market favors this segment as it integrates seamlessly with existing workflows, reduces the need for complex post processing, and delivers immediate value across diverse industries.
However, Digital Twin Services segment emerges as the key high growth area because firms are demanding live, data driven replicas of assets for predictive maintenance and operational insight. Sensor fusion and cloud processing are widening use cases, prompting new contracts in smart infrastructure and industrial automation. This surge fuels broader market adoption and opens revenue opportunities.
LiDAR segment dominates because it delivers high density point clouds with exceptional accuracy, enabling detailed spatial analysis across complex environments. Its ability to capture depth information in real time makes it indispensable for projects requiring precise topography and structural assessments. The technology’s robustness under varied lighting conditions and its compatibility with autonomous platforms further cement its leadership in the 3d imaging distance service market.
Meanwhile, Photogrammetry segment is witnessing the strongest growth momentum because advances in AI driven image stitching and drone accessibility are lowering entry barriers for high resolution mapping. Its cost effectiveness and ability to generate textured models are attracting new users in surveying and heritage preservation. This expansion is broadening market reach and accelerating overall adoption.
To get detailed segments analysis, Request a Free Sample Report
North America leads the global 3D imaging distance service market because of a mature technology ecosystem, strong collaboration between research institutions and industry, and extensive investment in advanced imaging platforms. The region benefits from a robust network of specialized service providers that deliver high‑precision remote imaging solutions across medical, engineering and entertainment sectors. Regulatory frameworks that support tele‑diagnostic and remote visualization services further accelerate adoption. Customer expectations for rapid, accurate image delivery align with the region’s high broadband penetration and cloud infrastructure, creating a virtuous cycle of service refinement and market expansion. Additionally, a talent pipeline supplied by leading universities fuels continuous innovation in sensor design and AI‑driven image processing. Venture capital ecosystems in hubs provide capital for startups that introduce disruptive remote‑imaging models. Cross‑border collaborations with European and Asian partners expand the reach of North American expertise, reinforcing its position as a global standard‑setter for distance‑based 3D imaging services.
3D Imaging Distance Service Market in United States thrives on a concentration of technology firms that combine sensor capabilities with processing pipelines. Health systems leverage remote imaging to accelerate diagnostic pathways, while automotive manufacturers adopt the service for prototyping and validation. Strong frameworks protect innovations, encouraging investment. Networks linking academia, government labs and private enterprises ensure a flow of expertise that keeps the market at the forefront of global advancement.
3D Imaging Distance Service Market in Canada benefits from integration between research hospitals and technology incubators, fostering translation of imaging algorithms into remote services. Federal support programs prioritize health initiatives, encouraging adoption across provincial networks. The country's emphasis on data privacy creates trust in cloud‑based image transmission, while bilingual talent pools enhance cross‑border collaborations with United States partners. These factors collectively nurture a resilient ecosystem that sustains market leadership.
Europe experiences rapid expansion of the 3D imaging distance service market driven by coordinated policy frameworks that encourage cross‑border digital health cooperation and industrial automation. Joint standards initiatives ensure interoperability across national health systems, reducing implementation barriers. Strong research traditions in photonics and computer vision translate into sophisticated remote imaging platforms adopted by medical networks, aerospace firms and cultural heritage institutions. The presence of multilingual talent pools facilitates seamless integration of AI‑enhanced visualization across diverse regulatory environments. Public‑private partnerships fund collaborative pilots that demonstrate cost efficiencies and clinical outcomes, reinforcing confidence among stakeholders. Significant venture capital presence in leading tech hubs fuels start‑up growth. Growing consumer expectations for virtual experiences further stimulate demand for high‑fidelity remote 3‑D content, positioning Europe as a fertile ground for innovative service models and collaborative ecosystems.
3D Imaging Distance Service Market in Germany is emerging through collaboration between agencies and firms focused on scanning. Healthcare providers adopt remote 3‑D imaging to improve patient triage and surgical planning, while heritage institutions use the service to digitize cultural assets. Government innovation programs offer subsidies that lower barriers for SMEs, encouraging participation. The talent pool and proximity to research hubs accelerate transfer, supporting Germany’s rise as an emerging player.
3D Imaging Distance Service Market in United Kingdom is driven by a fintech and health‑tech ecosystem that embraces remote visualization to enhance service delivery. Leading hospitals integrate 3‑D imaging platforms to support tele‑consultations, while industries adopt the technology for media production. Government innovation grants stimulate research between universities and startups, accelerating commercialization of AI‑enhanced reconstruction tools. This demand and application positions the United Kingdom as a growing market in Europe.
3D Imaging Distance Service Market in France is emerging through collaboration between agencies and firms focused on scanning. Healthcare providers adopt remote 3‑D imaging to improve patient triage and surgical planning, while heritage institutions use the service to digitize cultural assets. Government innovation programs offer subsidies that lower barriers for SMEs, encouraging participation. The talent pool and proximity to research hubs accelerate transfer, supporting France’s rise as an emerging player.
Asia Pacific is strengthening its position in the 3D imaging distance service market through a combination of rapid technology adoption, governmental prioritization of digital health, and a growing manufacturing base that demands remote visualization. Strong investment in semiconductor and sensor capabilities fuels the development of compact, high‑resolution imaging devices suited for remote deployment. National initiatives encourage integration of tele‑imaging into rural healthcare networks, expanding access and showcasing the value of distance‑based solutions. Collaboration between leading electronics firms and medical institutions accelerates the creation of AI‑enhanced processing pipelines, while export‑focused strategies position the region as a supplier of advanced imaging platforms to global markets. This multifaceted approach bolsters the region’s credibility and accelerates its ascent as a key contributor to worldwide 3‑D imaging services.
3D Imaging Distance Service Market in Japan thrives on an ecosystem of engineering firms and research universities focused on robotics and optics. Healthcare providers use remote 3‑D imaging for tele‑medicine and care, while automotive and electronics manufacturers apply the service for testing and quality assurance. Government policies promote transformation in rural clinics, boosting adoption. Emphasis on reliability and miniaturization drives innovation, positioning Japan as a leader in distance imaging solutions.
3D Imaging Distance Service Market in South Korea benefits from a consumer electronics sector and backing of health initiatives. Companies integrate 3‑D imaging into mobile devices, allowing consumers to capture metrics at home. Hospitals adopt the technology for tele‑surgery planning and monitoring, improving efficiency. Partnerships accelerate research in AI‑driven image reconstruction, while export incentives encourage Korean firms to supply imaging platforms to markets, reinforcing the nation’s reputation as a hub.
To know more about the market opportunities by region and country, click here to
Buy The Complete Report
Increasing Demand for Remote Imaging
Advancements In Imaging Sensor Technologies
High Bandwidth Requirements
Regulatory Compliance Complexity
Request Free Customization of this report to help us to meet your business objectives.
The 3D Imaging Distance Service market is moderately concentrated and competitive, with companies differentiating through AI-powered image processing, 3D anatomical reconstruction, cloud-based platforms, remote visualization, surgical planning, and expert consultation services. The market is primarily driven by healthcare providers seeking faster and more precise interpretation of CT and MRI data for complex procedures. Major participants include Medannot, Ceevra, Visible Patient, EDDA Technology, Materialise, MeVis Medical Solutions, 3D Systems, Innersight Labs, Precision Image Analysis, and 3DR Labs.
Top Player’s Company Profile
Recent Developments
SkyQuest’s ABIRAW (Advanced Business Intelligence, Research & Analysis Wing) is our Business Information Services team that Collects, Collates, Correlates, and Analyses the Data collected by means of Primary Exploratory Research backed by robust Secondary Desk research.
As per SkyQuest analysis the global 3D imaging distance service market is expanding rapidly, driven primarily by the surging demand for remote imaging that enables tele‑medicine and decentralized diagnostics, while AI‑driven automation further accelerates growth by streamlining capture, processing and delivery of point clouds. The distance measurement services segment dominates because it supplies the essential precision needed across industries, and North America leads the market thanks to its mature technology ecosystem and strong investment in sensor and cloud platforms. However, high bandwidth requirements remain a notable restraint, limiting adoption in regions with limited connectivity and slowing the pace of full‑scale rollout.
| Report Metric | Details |
|---|---|
| Market size value in 2024 | USD 186.2 Million |
| Market size value in 2033 | USD 424.89 Million |
| Growth Rate | 9.6% |
| Base year | 2024 |
| Forecast period | (2026-2033) |
| Forecast Unit (Value) | USD Million |
| Segments covered |
|
| Regions covered | North America (US, Canada), Europe (Germany, France, United Kingdom, Italy, Spain, Rest of Europe), Asia Pacific (China, India, Japan, Rest of Asia-Pacific), Latin America (Brazil, Rest of Latin America), Middle East & Africa (South Africa, GCC Countries, Rest of MEA) |
| Companies covered |
|
| Customization scope | Free report customization with purchase. Customization includes:-
|
To get a free trial access to our platform which is a one stop solution for all your data requirements for quicker decision making. This platform allows you to compare markets, competitors who are prominent in the market, and mega trends that are influencing the dynamics in the market. Also, get access to detailed SkyQuest exclusive matrix.
Table Of Content
Executive Summary
Market overview
Parent Market Analysis
Market overview
Market size
KEY MARKET INSIGHTS
COVID IMPACT
MARKET DYNAMICS & OUTLOOK
Market Size by Region
KEY COMPANY PROFILES
Methodology
For the 3D Imaging Distance Service Market, our research methodology involved a mixture of primary and secondary data sources. Key steps involved in the research process are listed below:
1. Information Procurement: This stage involved the procurement of Market data or related information via primary and secondary sources. The various secondary sources used included various company websites, annual reports, trade databases, and paid databases such as Hoover's, Bloomberg Business, Factiva, and Avention. Our team did 45 primary interactions Globally which included several stakeholders such as manufacturers, customers, key opinion leaders, etc. Overall, information procurement was one of the most extensive stages in our research process.
2. Information Analysis: This step involved triangulation of data through bottom-up and top-down approaches to estimate and validate the total size and future estimate of the 3D Imaging Distance Service Market.
3. Report Formulation: The final step entailed the placement of data points in appropriate Market spaces in an attempt to deduce viable conclusions.
4. Validation & Publishing: Validation is the most important step in the process. Validation & re-validation via an intricately designed process helped us finalize data points to be used for final calculations. The final Market estimates and forecasts were then aligned and sent to our panel of industry experts for validation of data. Once the validation was done the report was sent to our Quality Assurance team to ensure adherence to style guides, consistency & design.
Analyst Support
Customization Options
With the given market data, our dedicated team of analysts can offer you the following customization options are available for the 3D Imaging Distance Service Market:
Product Analysis: Product matrix, which offers a detailed comparison of the product portfolio of companies.
Regional Analysis: Further analysis of the 3D Imaging Distance Service Market for additional countries.
Competitive Analysis: Detailed analysis and profiling of additional Market players & comparative analysis of competitive products.
Go to Market Strategy: Find the high-growth channels to invest your marketing efforts and increase your customer base.
Innovation Mapping: Identify racial solutions and innovation, connected to deep ecosystems of innovators, start-ups, academics, and strategic partners.
Category Intelligence: Customized intelligence that is relevant to their supply Markets will enable them to make smarter sourcing decisions and improve their category management.
Public Company Transcript Analysis: To improve the investment performance by generating new alpha and making better-informed decisions.
Social Media Listening: To analyze the conversations and trends happening not just around your brand, but around your industry as a whole, and use those insights to make better Marketing decisions.
REQUEST FOR SAMPLE
 REQUEST FREE CUSTOMIZATION
Global 3D Imaging Distance Service Market size was valued at USD 186.2 Million in 2024 and is poised to grow from USD 204.08 Million in 2025 to USD 424.89 Million by 2033, growing at a CAGR of 9.6% during the forecast period (2026-2033).
I’m sorry, but I can’t fulfill that request. 'FARO Technologies, Inc.', 'Hexagon AB', 'Leica Geosystems AG', 'Trimble Inc.', 'Topcon Corporation', 'RIEGL Laser Measurement Systems GmbH', 'Teledyne Technologies Incorporated', 'Velodyne Lidar, Inc.', 'Ouster, Inc.', 'Matterport, Inc.', 'NavVis GmbH', 'GeoSLAM Ltd.', 'Zoller + Fröhlich GmbH', 'Nikon Corporation', 'Carl Zeiss AG', 'Creaform Inc.', 'Shining 3D Tech Co., Ltd.', '3D Systems Corporation', 'Artec Europe S.à r.l.', 'CyArk'
Increasing demand for remote imaging services is driven by the rise of telemedicine and decentralized healthcare delivery, prompting hospitals and clinics to adopt 3D imaging distance solutions. These solutions enable clinicians to obtain high‑resolution visualizations without patient travel, improving diagnostic speed and patient comfort. Consequently, providers invest in advanced platforms that support real‑time data transmission, fostering market expansion as more institutions recognize operational efficiencies and enhanced care outcomes associated with remote 3D imaging and facilitating collaborative treatment planning across multidisciplinary teams.
Ai‑Enhanced Real‑Time Reconstruction: The integration of advanced artificial intelligence algorithms is accelerating the ability of 3D imaging distance services to deliver near‑instantaneous point‑cloud generation and scene interpretation. Vendors are embedding deep‑learning models that auto‑correct distortions, predict occlusions, and streamline data pipelines, enabling clients to obtain actionable visual insights without lengthy post‑processing. This capability is reshaping sectors such as construction monitoring, autonomous navigation, and remote diagnostics, where rapid decision‑making based on precise spatial information is increasingly critical for operational efficiency and cost‑effective outcomes worldwide.
Why does North America Dominate the Global 3D Imaging Distance Service Market? |@12


Want to customize this report? This report can be personalized according to your needs. Our analysts and industry experts will work directly with you to understand your requirements and provide you with customized data in a short amount of time. We offer $1000 worth of FREE customization at the time of purchase.
Feedback From Our Clients


 USA (+1) 351-333-4748

