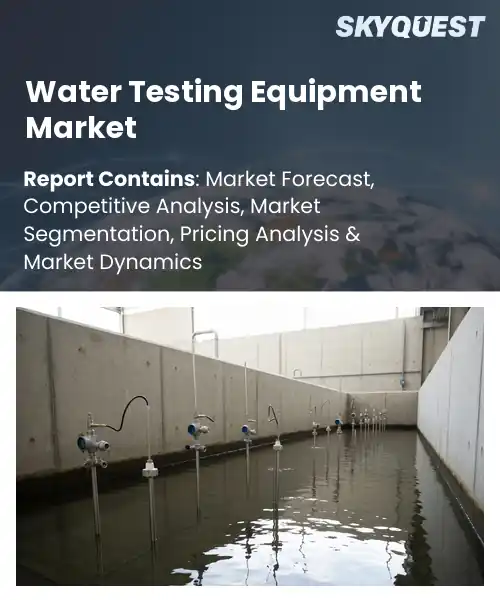
Water Testing Equipment Market
Report ID: SQMIG20I3017
Report ID: SQMIG20I3017
[email protected]
USA +1 351-333-4748
Report ID:
SQMIG20I3017 |
Region:
Global |
Published Date: May, 2026
Pages:
157
|Tables:
180
|Figures:
79


Global Water Testing Equipment Market size was valued at USD 5.3 Billion in 2024 and is poised to grow from USD 5.66 Billion in 2025 to USD 9.58 Billion by 2033, growing at a CAGR of 6.8% during the forecast period (2026-2033).
Regulatory tightening and public health concerns serve as the primary driver shaping the water testing equipment market, as stricter standards force utilities and industries to upgrade monitoring capabilities to demonstrate compliance. The market covers instruments and services that measure chemical, biological and physical water parameters across municipal, industrial and environmental applications, and it matters because safe water underpins health, economic productivity and ecological resilience. Over the past decade the sector shifted from laboratory colorimetric kits to portable sensors, automated analyzers and cloud-connected platforms; for example, many utilities moved from manual grab sampling to continuous online monitoring after high-profile contamination events.
A central factor accelerating global market growth is the rapid deployment of real-time, networked sensors because constant data reduces response times and lowers compliance costs, which encourages further investment in instrumentation and analytics. As sensor miniaturization and cloud connectivity have driven unit costs down, utilities and manufacturers increasingly replace periodic sampling with continuous monitoring, producing large data streams that create demand for software, calibration services and managed monitoring contracts. In practice this causes faster contaminant detection in municipal systems, tighter process control in food and beverage plants, and optimized discharge management in mining, thereby unlocking recurring revenue models for vendors.
How is AI improving accuracy in water testing equipment?
AI improves accuracy in water testing equipment by combining smarter sensors with machine learning that cleans noisy readings, detects anomalies and adapts calibration over time. Key aspects are sensor fusion, physics informed models and edge analytics that deliver near real time, lab grade insight in the field. The current state shows vendors integrating AI to reduce false alarms and to predict instrument drift while keeping operations continuous. Market demand from utilities and industrial users for continuous compliance monitoring and faster incident response is pushing wider adoption. Examples range from anomaly detection models that distinguish true contamination from sensor faults to cloud assisted analytics that guide maintenance decisions.
Ecolab April 2026, announced Water Navigator IQ, an AI enabled platform that links monitoring data with enterprise insights and expert services. This development improves in situ accuracy by refining sensor outputs and speeding actionable diagnostics, which supports market efficiency and reduces reliance on slow manual laboratory testing.
Market snapshot - (2026-2033)
Global Market Size
USD 5.3 Billion
Largest Segment
pH Meters
Fastest Growth
Water Testing Kits
Growth Rate
6.8% CAGR
To get more insights on this market click here to Request a Free Sample Report
Global water testing equipment market is segmented by product type, technology, application, parameter tested, end user, distribution channel and region. Based on product type, the market is segmented into pH Meters, Conductivity Meters, Turbidity Meters, Dissolved Oxygen Meters, Spectrophotometers, Water Testing Kits and Others. Based on technology, the market is segmented into Portable Testing Equipment, Benchtop Testing Equipment and Online Monitoring Systems. Based on application, the market is segmented into Drinking Water Testing, Wastewater Testing, Industrial Water Testing, Environmental Monitoring, Aquaculture Water Testing and Others. Based on parameter tested, the market is segmented into Chemical Parameters, Biological Parameters and Physical Parameters. Based on end user, the market is segmented into Municipal Authorities, Industrial Facilities, Environmental Agencies, Laboratories and Others. Based on distribution channel, the market is segmented into Direct Sales, Distributors and Online Sales. Based on region, the market is segmented into North America, Europe, Asia Pacific, Latin America and Middle East & Africa.
Spectrophotometers segment dominates because spectrophotometers offer comprehensive, high sensitivity chemical analysis that aligns with stringent regulatory and laboratory needs. Their versatility in measuring multiple parameters and adaptability to standardized protocols encourages institutional procurement and long term supplier relationships. This drives investment in advanced optics and automation, reinforcing their central role through improved data reliability, method validation, and integration with laboratory workflows, thereby maintaining preference among professional users.
However, Water Testing Kits segment is witnessing the strongest growth due to rising demand for portable, user friendly field diagnostics. Improvements in test simplicity, smartphone compatibility, and accessible pricing accelerate uptake across utilities and consumer channels. This growth spurs product innovation, expands distribution, and creates recurring revenue through consumables and ancillary services.
Online Monitoring Systems segment leads because continuous real time data delivery fundamentally changes how water quality is managed across operations. Persistent measurement enables early detection of anomalies, facilitates automated controls, and aligns with regulatory requirements for continuous reporting. Integration with cloud analytics and asset management tools promotes predictive maintenance and operational efficiency, encouraging capital investment and long term deployments by utilities and industrial users seeking reduced downtime and improved compliance.
However, Portable Testing Equipment segment is witnessing the strongest growth driven by demand for flexible on site diagnostics and rapid field decision making. Improvements in miniaturization, battery life, and smartphone connectivity increase accuracy and usability. This expands adoption across utilities, environmental monitoring, and aquaculture, opening avenues for recurring services and decentralized testing models.
To get detailed segments analysis, Request a Free Sample Report
North America dominates owing to a combination of regulatory rigor, advanced infrastructure, and a mature industrial and municipal testing ecosystem that collectively sustain high demand for sophisticated equipment and services. Established manufacturers and well developed distribution and aftermarket networks enable rapid adoption of emerging technologies, while deep R&D capabilities and close ties between industry and academic institutions drive continuous innovation. Strong emphasis on public health and environmental compliance, combined with comprehensive monitoring programs and private sector investment, underpins market depth and diversity. Integrated solutions that pair hardware with data management and service offerings further reinforce market leadership by addressing end user needs across municipal, industrial, and environmental testing applications.
Water Testing Equipment Market benefits from concentrated technical expertise, extensive laboratory networks, and a culture of innovation that drives adoption of advanced analytical instruments and digital monitoring platforms. Strong industry collaboration with academic centers and established aftermarket support underpin market maturity. Demand spans municipal water agencies, industrial operators, and environmental consultancies, supporting a diverse product landscape and continuous refinement of testing protocols and service offerings emphasis on workforce training programs.
Water Testing Equipment Market in Canada is shaped by widespread institutional support, focus on remote and rural water monitoring, and collaborative initiatives between provincial agencies and private laboratories. Emphasis on portability, maintenance services, and field deployable instruments meets diverse geographic challenges. Strong ties to research institutions and export oriented manufacturers foster innovation in sample preparation and analytical methods, while training and service networks improve deployment and long term reliability capabilities.
Europe is experiencing rapid expansion driven by stringent regulatory frameworks, harmonized standards, and a broad prioritization of environmental and public health objectives that collectively elevate demand for reliable testing technologies. Investment in infrastructure upgrades, combined with heightened scrutiny of industrial discharges, creates sustained need for diverse analytical instruments and portable testing solutions. A robust community of specialized manufacturers and accredited laboratories shortens development and certification pathways, while public procurement and cross border collaboration encourage wider market uptake. Increasing focus on digital data integration, remote monitoring, and turnkey service offerings enables providers to deliver comprehensive packages that address municipal, industrial, and environmental monitoring needs, reinforcing market growth and technological advancement across the region.
Water Testing Equipment Market in Germany benefits from a deep industrial manufacturing tradition, precision engineering competencies, and well established laboratory infrastructure. Demand is driven by industrial process control, municipal water utilities, and a dense network of environmental consultancies that value high accuracy instrumentation and robust service contracts. Strong export orientation supports innovation in sensor technologies and automation integration, while certification pathways and industry collaborations ensure reliability and performance across applications.
Water Testing Equipment Market in United Kingdom is marked by rapid adoption of portable and digital testing solutions, strong private investment, and a robust consulting ecosystem. Decentralized water management encourages flexible monitoring and service models. Vendor operator collaboration accelerates field deployment and data integration, improving responsiveness to contamination risks while enhancing operational efficiency and service innovation Market participants prioritize friendly interfaces, interoperability scalable offerings that meet municipal and industrial needs
Water Testing Equipment Market in France is emerging through targeted initiatives in urban water management, increased focus on environmental monitoring, and growing engagement from local manufacturers and research centers. Demand for low energy sensors, integrated sampling solutions, and maintenance services supports market development. Partnerships between municipal utilities, consultancies, and technology startups foster pilot projects and scale up. Emphasis on certification, field validation, and training enhances deployment readiness across diverse applications.
Asia Pacific is strengthening its position through coordinated investments in manufacturing capacity, research and development, and regional collaboration that accelerate technology diffusion and local capability building. Policymakers and industrial stakeholders emphasize water security and operational efficiency, leading to adoption of advanced sensing technologies, portable analyzers, and automated laboratory solutions. Well developed electronics and component supply chains in key economies support rapid prototyping and scaling of precision instruments. Cross border partnerships and knowledge transfer from established markets bolster validation, calibration, and service networks. Tailoring cost effective, ruggedized equipment to diverse climatic and geographic conditions facilitates broader deployment across municipal, industrial, and agricultural use cases, while increasing digital integration enables real time monitoring and more proactive asset management.
Water Testing Equipment Market in Japan emphasizes precision engineering, strong electronics industry synergies, and reliable instrumentation for industrial and municipal use. Suppliers focus on miniaturization, automation, and integration with digital monitoring platforms. Collaboration among manufacturers, research institutions, and service providers strengthens validation and calibration capabilities. Demand favors advanced analyzers and sensor networks that support quality control and operational stability across water management applications and export oriented manufacturing enhances international reach.
Water Testing Equipment Market in South Korea is driven by rapid technology adoption, strong electronics manufacturing, and demand from advanced industrial sectors. Suppliers emphasize compact, high sensitivity sensors and cloud enabled data platforms for real time monitoring. Collaboration between startups, universities, and incumbent firms speeds commercialization of innovative testing solutions. Focus on interoperability, fast deployment, and smart city integration supports municipal and industrial water quality management and export growth initiatives
To know more about the market opportunities by region and country, click here to
Buy The Complete Report
Regulatory Emphasis on Water Quality
Industrialization and Urban Population Growth
High Capital and Operational Costs
Data Complexity and Interpretation Challenges
Request Free Customization of this report to help us to meet your business objectives.
Competitive landscape is shaped by consolidation through targeted M&A and public and private partnerships, and by rapid product innovation from startups. For example, Halma’s Palintest business uses acquisitions and a WaterAid partnership to expand distribution, while data platform players such as mWater and sensor focused startups like Nucleic Sensing Systems push autonomous and IoT enabled monitoring, creating pressure on incumbents to pursue acquisitions, alliances and sensor analytics rollouts.
SkyQuest’s ABIRAW (Advanced Business Intelligence, Research & Analysis Wing) is our Business Information Services team that Collects, Collates, Correlates, and Analyses the Data collected by means of Primary Exploratory Research backed by robust Secondary Desk research.
As per SkyQuest analysis, the global water testing equipment market is being driven primarily by tightening regulations and public health concerns that compel utilities and industries to upgrade monitoring, and a second major driver is the rapid deployment of real time, networked sensors which enable continuous compliance and lower response times. Growth is tempered by high capital and operational costs that can restrict adoption among smaller utilities and emerging market buyers. North America remains the dominant region thanks to mature infrastructure, rigorous standards and strong R&D, while spectrophotometers lead the product mix due to their laboratory grade chemical analysis and institutional preference, sustaining procurement and innovation across professional users.
| Report Metric | Details |
|---|---|
| Market size value in 2024 | USD 5.3 Billion |
| Market size value in 2033 | USD 9.58 Billion |
| Growth Rate | 6.8% |
| Base year | 2024 |
| Forecast period | (2026-2033) |
| Forecast Unit (Value) | USD Billion |
| Segments covered |
|
| Regions covered | North America (US, Canada), Europe (Germany, France, United Kingdom, Italy, Spain, Rest of Europe), Asia Pacific (China, India, Japan, Rest of Asia-Pacific), Latin America (Brazil, Rest of Latin America), Middle East & Africa (South Africa, GCC Countries, Rest of MEA) |
| Companies covered |
|
| Customization scope | Free report customization with purchase. Customization includes:-
|
To get a free trial access to our platform which is a one stop solution for all your data requirements for quicker decision making. This platform allows you to compare markets, competitors who are prominent in the market, and mega trends that are influencing the dynamics in the market. Also, get access to detailed SkyQuest exclusive matrix.
Table Of Content
Executive Summary
Market overview
Parent Market Analysis
Market overview
Market size
KEY MARKET INSIGHTS
COVID IMPACT
MARKET DYNAMICS & OUTLOOK
Market Size by Region
KEY COMPANY PROFILES
Methodology
For the Water Testing Equipment Market, our research methodology involved a mixture of primary and secondary data sources. Key steps involved in the research process are listed below:
1. Information Procurement: This stage involved the procurement of Market data or related information via primary and secondary sources. The various secondary sources used included various company websites, annual reports, trade databases, and paid databases such as Hoover's, Bloomberg Business, Factiva, and Avention. Our team did 45 primary interactions Globally which included several stakeholders such as manufacturers, customers, key opinion leaders, etc. Overall, information procurement was one of the most extensive stages in our research process.
2. Information Analysis: This step involved triangulation of data through bottom-up and top-down approaches to estimate and validate the total size and future estimate of the Water Testing Equipment Market.
3. Report Formulation: The final step entailed the placement of data points in appropriate Market spaces in an attempt to deduce viable conclusions.
4. Validation & Publishing: Validation is the most important step in the process. Validation & re-validation via an intricately designed process helped us finalize data points to be used for final calculations. The final Market estimates and forecasts were then aligned and sent to our panel of industry experts for validation of data. Once the validation was done the report was sent to our Quality Assurance team to ensure adherence to style guides, consistency & design.
Analyst Support
Customization Options
With the given market data, our dedicated team of analysts can offer you the following customization options are available for the Water Testing Equipment Market:
Product Analysis: Product matrix, which offers a detailed comparison of the product portfolio of companies.
Regional Analysis: Further analysis of the Water Testing Equipment Market for additional countries.
Competitive Analysis: Detailed analysis and profiling of additional Market players & comparative analysis of competitive products.
Go to Market Strategy: Find the high-growth channels to invest your marketing efforts and increase your customer base.
Innovation Mapping: Identify racial solutions and innovation, connected to deep ecosystems of innovators, start-ups, academics, and strategic partners.
Category Intelligence: Customized intelligence that is relevant to their supply Markets will enable them to make smarter sourcing decisions and improve their category management.
Public Company Transcript Analysis: To improve the investment performance by generating new alpha and making better-informed decisions.
Social Media Listening: To analyze the conversations and trends happening not just around your brand, but around your industry as a whole, and use those insights to make better Marketing decisions.
REQUEST FOR SAMPLE
 REQUEST FREE CUSTOMIZATION
Global Water Testing Equipment Market size was valued at USD 5.3 Billion in 2024 and is poised to grow from USD 5.66 Billion in 2025 to USD 9.58 Billion by 2033, growing at a CAGR of 6.8% during the forecast period (2026-2033).
Competitive landscape is shaped by consolidation through targeted M&A and public and private partnerships, and by rapid product innovation from startups. For example, Halma’s Palintest business uses acquisitions and a WaterAid partnership to expand distribution, while data platform players such as mWater and sensor focused startups like Nucleic Sensing Systems push autonomous and IoT enabled monitoring, creating pressure on incumbents to pursue acquisitions, alliances and sensor analytics rollouts. 'Thermo Fisher Scientific', 'Danaher Corporation', 'Xylem', 'Horiba', 'Agilent Technologies', 'Shimadzu Corporation', 'Mettler Toledo', 'Hach', 'Endress+Hauser', 'ABB', 'Emerson Electric', 'Yokogawa Electric Corporation', 'Tintometer Group', 'Palintest', 'LaMotte Company', 'Hanna Instruments', 'Eurofins Scientific', 'Waters Corporation', 'PerkinElmer', 'Merck KGaA'
Regulatory frameworks demanding improved water safety compel utilities, industrial operators, and laboratories to expand monitoring programs and invest in advanced testing equipment. As regulators prioritize contaminant detection and reporting, organizations seek reliable analytical instruments and point of use sensors to demonstrate compliance and mitigate liability. This regulatory pressure stimulates procurement, supports market entrants, and incentivizes manufacturers to develop compliant solutions, driving adoption across public and private sectors. The requirement for documented water quality assurance fosters ongoing demand for equipment, calibration services, and associated maintenance offerings.
Decentralized Monitoring Adoption: Decentralized monitoring of water quality is gaining traction as utilities, industrial sites, and communities seek localized, real-time insight. Smaller, networked sensors and handheld analyzers enable targeted interventions and reduce reliance on centralized testing. This shift emphasizes ease of deployment, remote accessibility, and rapid response to contamination events, fostering greater stakeholder engagement and operational agility. Vendors are prioritizing interoperable platforms and user-friendly interfaces to support distributed monitoring, maintenance workflows, and regulatory reporting while aligning offerings with field conditions and resource constraints.
Why does North America Dominate the Global Water Testing Equipment Market? |@12


Want to customize this report? This report can be personalized according to your needs. Our analysts and industry experts will work directly with you to understand your requirements and provide you with customized data in a short amount of time. We offer $1000 worth of FREE customization at the time of purchase.
Feedback From Our Clients


 USA (+1) 351-333-4748

