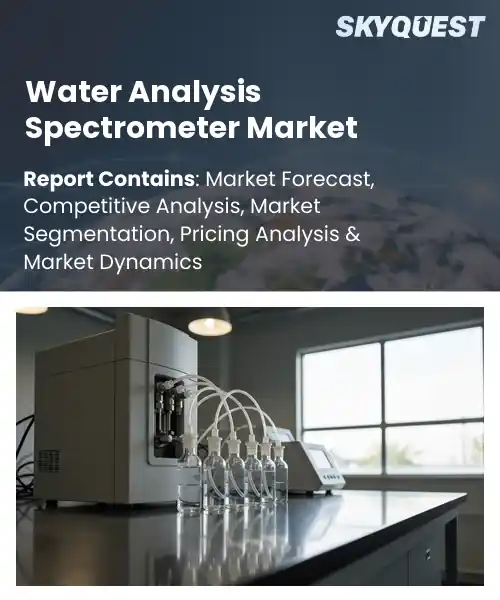
Water Analysis Spectrometer Market
Report ID: SQMIG35J2734
Report ID: SQMIG35J2734
[email protected]
USA +1 351-333-4748
Report ID:
SQMIG35J2734 |
Region:
Global |
Published Date: August, 2026
Pages:
157
|Tables:
146
|Figures:
78


Global Water Analysis Spectrometer Market size was valued at USD 3.18 Billion in 2024 and is poised to grow from USD 3.41 Billion in 2025 to USD 5.9 Billion by 2033, growing at a CAGR of 7.1% during the forecast period (2026-2033).
The global water analysis spectrometer market share is centered on instruments that rapidly identify contaminants, nutrients and microbial signatures in drinking, industrial and environmental waters. Its importance has grown as governments raise safety standards and consumers demand visible quality data. The field was historically dominated by bulky laboratory-based spectrometers, which limited on-site assessments. In the early 2010s, however, portable UV-Vis and Raman devices emerged, allowing field professionals to obtain near-real-time results. For instance, California’s municipal utilities used handheld spectrometers to track increased nitrate levels following episodes of agricultural runoff, illustrating how regulatory pressure and technological breakthroughs have altered market dynamics. These changes have driven commercial expansion.
A second key water analysis spectrometer market growth driver is the convergence of miniaturized optics and Internet-of-Things connectivity, which transforms spectrometers from stand-alone analytical instruments to integral parts of water-management networks. Spectral data can be continuously fed to cloud platforms where utilities can use predictive algorithms to spot contamination events and reduce treatment costs and service interruptions. For example, a European wastewater consortium used networked NIR spectrometers to monitor pharmaceutical residues and provide real-time alerts for dosing adjustments, resulting in savings and compliance benefits. This cause-effect chain technology that enables automation which drives cost efficiencies and regulatory confidence create a fertile environment for entrants and service-based revenue models.
How is AI Enhancing Accuracy and Speed in the Water Analysis Spectrometer Market?
AI is enhancing the water analysis spectrometer market trends by enabling faster interpretation of complex spectral data and improving the detection of contaminants at low concentrations. Machine-learning algorithms can analyze spectral patterns across multiple wavelengths to distinguish pollutants, nutrients, organic compounds, and other water-quality indicators with greater consistency than conventional manual interpretation. AI-powered systems can also identify anomalies in real time, allowing treatment plants, industrial facilities, and environmental monitoring agencies to detect contamination events earlier and respond more quickly.
Integration with cloud platforms and IoT-enabled spectrometers further enables continuous monitoring, automated data analysis, and predictive assessments of changing water conditions. By reducing the time required for data processing and minimizing dependence on specialized analysts, AI can improve operational efficiency while supporting more reliable water-quality management. As portable and connected spectrometers become increasingly sophisticated, AI-driven analytics are expected to create opportunities for automated monitoring solutions and more responsive water-treatment operations.
Market snapshot - (2026-2033)
Global Market Size
USD 3.18 Billion
Largest Segment
UV-Visible Spectrometers
Fastest Growth
ICP-OES Spectrometers
Growth Rate
7.1% CAGR
To get more insights on this market click here to Request a Free Sample Report
Global water analysis spectrometer market is segmented by spectrometer type, parameter, application, end user, product type and region. Based on spectrometer type, the market is segmented into UV-visible spectrometers, atomic absorption spectrometers, fluorescence spectrometers and ICP-OES spectrometers. Based on parameter, the market is segmented into metals, nutrients, organic compounds and microcontaminants. Based on application, the market is segmented into drinking water testing, wastewater testing and industrial water testing. Based on end user, the market is segmented into water treatment plants, environmental testing laboratories, industrial facilities and research institutes. Based on product type, the market is segmented into benchtop and portable. Based on region, the market is segmented into North America, Europe, Asia Pacific, Latin America and Middle East & Africa.
UV‑visible spectrometer segment dominates because it offers rapid, non‑destructive analysis of a broad range of inorganic and organic constituents, making it the go‑to technology for routine water quality checks. Its ease of use, low maintenance, and compatibility with automated sampling systems drive widespread adoption across treatment facilities and labs, reinforcing its central position in the market. Regulatory mandates for trace metal detection and the instrument’s cost‑effectiveness further cement its appeal, while continuous improvements in detector sensitivity enhance reliability for long‑term monitoring programs.
Meanwhile, fluorescence spectrometer segment emerges as the most rapidly expanding area because its ultra‑low detection limits enable precise monitoring of emerging microcontaminants and organic pollutants. Growing concerns over endocrine disruptors and the push for real‑time field analytics drive adoption, positioning fluorescence technology as a catalyst for new market opportunities.
Drinking water testing application segment leads because it requires stringent compliance with health standards, demanding accurate, repeatable measurements of metals, nutrients, and organic compounds. The high frequency of routine sampling, coupled with regulatory pressure for safe potable water, fuels continuous instrument turnover and drives manufacturers to prioritize features that enhance reliability and ease of operation. Additionally, the integration of automated data management systems and the need for rapid response to contamination events push vendors to develop more robust, user‑friendly platforms, reinforcing the dominance of this application.
On the other hand, wastewater testing application is witnessing the strongest growth momentum because municipalities and industries are intensifying efforts to meet stricter discharge regulations and to recover resources from effluents. The rise of circular economy initiatives and advanced treatment technologies creates demand for spectrometers capable of multi‑element analysis, accelerating market expansion and spurring innovation in analytical capabilities.
To get detailed segments analysis, Request a Free Sample Report
North America continues to be a key player in the global water analysis spectrometer market due to its advanced research settings, strong industrial integration, and a deep commitment to environmental responsibility. The region has a well-developed network of academic institutions that provide the foundation for ongoing innovations in spectroscopic techniques. Leading manufacturers of the region design their products to meet rigorous regulatory requirements. High precision instruments used in end-user sectors such as pharmaceuticals, food processing, utilities further strengthen the market depth. Strong funding mechanisms drive R&D pipelines that quickly turn laboratory breakthroughs into commercial offerings. Availability of components, reliable supply lines and large service networks give confidence to demanding customers by offering quick technical support.
Water analysis spectrometer market outlook in United States thrives on a sophisticated ecosystem that blends cutting‑edge research with a broad base of end‑users. The presence of leading universities fuels continuous methodological advances, while a strong industrial sector embraces high‑performance devices for compliance and quality control. Integrated regulatory frameworks encourage adoption, and a well‑developed distribution channel ensures swift market reach, reinforcing the United States as a pivotal hub for innovation and deployment.
Water analysis spectrometer market forecast in Canada benefits from strong governmental emphasis on water quality stewardship and a collaborative research environment. Provincial initiatives promote technology transfer between academic labs and industry, fostering tailored solutions for sectors such as mining and municipal treatment. A reputation for engineering excellence supports the development of rugged instruments suited to diverse climatic conditions, while supportive policy frameworks streamline procurement processes, positioning Canada as a reliable source of high‑quality spectrometric capabilities.
Driven by a blend of stringent environmental policies, robust research partnerships, and a dedication to sustainable industry practices, the European water analysis spectrometer sector is experiencing a surge of activity. Across the continent, regulatory directives are boosting the need for precise monitoring tools, compelling manufacturers to concentrate on accuracy and reliability. Cross-border academic networks promote the exchange of knowledge and lead to sophisticated analytical methods that meet different market needs. The progression of spectrometers is in line with climate goals through investment in green technologies, and a robust manufacturing base provides ready-to-deploy solutions for drinking water utilities and chemical processing. And member countries have harmonized standards, which facilitate the qualification of products and drive adoption across markets. Startups bringing novel detection technologies to market are being supported by collaborative funding programs, and the increased public attention on water safety is driving demand for real-time analytical capabilities. These dynamics together speed up market penetration and strengthen Europe’s leading position in sustainable spectrometric solutions.
Water analysis spectrometer market regional outlook in Germany is anchored by a robust engineering tradition and a dense network of research institutions that drive precision instrumentation. Strong collaboration between manufacturers and environmental agencies ensures compliance‑focused product development. The country’s emphasis on renewable water management fuels demand for spectrometers capable of detecting trace contaminants. Well‑established certification pathways streamline market entry, making Germany a cornerstone for high‑quality spectrometric solutions in Europe.
Water analysis spectrometer market regional forecast in United Kingdom experiences accelerated adoption driven by stringent water quality standards and a vibrant biotech sector. Government incentives promote the integration of advanced analytical tools across municipal and industrial pipelines. Academic hubs produce cutting‑edge spectroscopic research, feeding commercial innovation. The focus on sustainable water stewardship encourages investment in portable and high‑resolution devices, positioning United Kingdom as a fast‑moving hub for next‑generation water analysis technologies.
Water analysis spectrometer market analysis in France is emerging through focused collaboration between national research agencies and niche manufacturers. Emphasis on compliance with European water directives drives the adoption of reliable spectrometric instruments for both public utilities and agricultural runoff monitoring. Growing awareness of pollution impacts accelerates demand for sensitive detection capabilities. Supportive funding schemes encourage the development of compact, user‑friendly devices, fostering France’s gradual ascent within the continental spectrometer landscape.
Driven by technological ambition, the expansion of industrial bases and growing environmental vigilance, Asia Pacific is rapidly becoming a consolidator in the water analysis spectrometer sector. Nations in the region invest heavily in research infrastructure, leading to breakthroughs in miniaturized and high-throughput spectroscopic platforms. Increasing urbanization and efficient water resource management in municipal utilities, semiconductor fabrication and food processing drive the demand for this. Local innovators partnering with global equipment suppliers to work on collaborative projects speed up the transfer of knowledge, while supportive policy frameworks assist in the adoption of advanced monitoring solutions. The focus on digital integration in the region allows for real-time data analysis to make better decisions on water quality interventions. Also, the increasing export focus of local manufacturers is spreading state-of-the-art spectrometer know-how to neighboring markets, strengthening the leverage of Asia Pacific in the global supply chain.
Water analysis spectrometer market penetration in Japan thrives on a culture of precision engineering and strong governmental commitment to water safety. Advanced research institutes collaborate closely with manufacturers to produce spectrometers featuring ultra‑high resolution and robust reliability. The nation’s focus on high‑tech industries such as electronics and pharmaceuticals fuels demand for meticulous contamination monitoring. Progressive regulatory guidance and extensive field testing infrastructure further reinforce Japan’s status as a leading hub for sophisticated water analysis instrumentation.
Water analysis spectrometer industry in South Korea benefits from rapid industrial diversification and proactive environmental monitoring. Collaboration between technology parks and university labs accelerates development of compact, energy‑efficient spectrometers for real‑time water assessment. Smart city initiatives integrate spectrometric data into urban water management. Fiscal policies and export incentives help local firms grow regionally and globally, enhancing South Korea’s role in the spectrometer ecosystem.
To know more about the market opportunities by region and country, click here to
Buy The Complete Report
Rising Need for Real‑Time Monitoring
Advances in Miniaturized Spectroscopy
High Capital Investment Requirements
Complex Calibration and Maintenance
Request Free Customization of this report to help us to meet your business objectives.
The global water analysis spectrometer market is highly competitive, with established analytical-instrument manufacturers such as Thermo Fisher Scientific, Agilent Technologies, Shimadzu, HORIBA, PerkinElmer, Hach, Metrohm and Endress+Hauser competing through improvements in analytical sensitivity, automation, throughput, portability and digital data management. Demand is supported by increasingly stringent requirements for monitoring drinking water, wastewater and industrial effluents for trace metals, nutrients, organic compounds and other contaminants. ICP-MS, UV-Vis and Raman spectroscopy continue to serve different analytical requirements, while manufacturers are increasingly emphasizing automated sample handling, interference reduction, faster analysis and software-enabled workflows. Thermo Fisher, for example, promotes its ICP-MS systems for regulated drinking-water and wastewater analysis, including applications based on ISO and U.S. EPA methods.
Top Player’s Company Profile
Recent Developments in the Water Analysis Spectrometer Market
SkyQuest’s ABIRAW (Advanced Business Intelligence, Research & Analysis Wing) is our Business Information Services team that Collects, Collates, Correlates, and Analyses the Data collected by means of Primary Exploratory Research backed by robust Secondary Desk research. As per SkyQuest analysis, the global water analysis spectrometer market is being propelled primarily by the rising need for real‑time monitoring, which pushes utilities and labs to adopt fast, on‑site instruments, while advances in miniaturized spectroscopy serve as a second driver by enabling compact, low‑power devices that retain laboratory‑grade accuracy. The UV‑Visible spectrometer segment remains dominant because of its versatility and cost‑effectiveness, and North America leads the market thanks to its mature research ecosystem, stringent regulations and strong industrial demand. However, high capital investment requirements pose a restraint, slowing adoption among smaller operators that must balance upfront costs with budget constraints.
| Report Metric | Details |
|---|---|
| Market size value in 2024 | USD 3.18 Billion |
| Market size value in 2033 | USD 5.9 Billion |
| Growth Rate | 7.1% |
| Base year | 2024 |
| Forecast period | (2026-2033) |
| Forecast Unit (Value) | USD Billion |
| Segments covered |
|
| Regions covered | North America (US, Canada), Europe (Germany, France, United Kingdom, Italy, Spain, Rest of Europe), Asia Pacific (China, India, Japan, Rest of Asia-Pacific), Latin America (Brazil, Rest of Latin America), Middle East & Africa (South Africa, GCC Countries, Rest of MEA) |
| Companies covered |
|
| Customization scope | Free report customization with purchase. Customization includes:-
|
To get a free trial access to our platform which is a one stop solution for all your data requirements for quicker decision making. This platform allows you to compare markets, competitors who are prominent in the market, and mega trends that are influencing the dynamics in the market. Also, get access to detailed SkyQuest exclusive matrix.
Table Of Content
Executive Summary
Market overview
Parent Market Analysis
Market overview
Market size
KEY MARKET INSIGHTS
COVID IMPACT
MARKET DYNAMICS & OUTLOOK
Market Size by Region
KEY COMPANY PROFILES
Methodology
For the Water Analysis Spectrometer Market, our research methodology involved a mixture of primary and secondary data sources. Key steps involved in the research process are listed below:
1. Information Procurement: This stage involved the procurement of Market data or related information via primary and secondary sources. The various secondary sources used included various company websites, annual reports, trade databases, and paid databases such as Hoover's, Bloomberg Business, Factiva, and Avention. Our team did 45 primary interactions Globally which included several stakeholders such as manufacturers, customers, key opinion leaders, etc. Overall, information procurement was one of the most extensive stages in our research process.
2. Information Analysis: This step involved triangulation of data through bottom-up and top-down approaches to estimate and validate the total size and future estimate of the Water Analysis Spectrometer Market.
3. Report Formulation: The final step entailed the placement of data points in appropriate Market spaces in an attempt to deduce viable conclusions.
4. Validation & Publishing: Validation is the most important step in the process. Validation & re-validation via an intricately designed process helped us finalize data points to be used for final calculations. The final Market estimates and forecasts were then aligned and sent to our panel of industry experts for validation of data. Once the validation was done the report was sent to our Quality Assurance team to ensure adherence to style guides, consistency & design.
Analyst Support
Customization Options
With the given market data, our dedicated team of analysts can offer you the following customization options are available for the Water Analysis Spectrometer Market:
Product Analysis: Product matrix, which offers a detailed comparison of the product portfolio of companies.
Regional Analysis: Further analysis of the Water Analysis Spectrometer Market for additional countries.
Competitive Analysis: Detailed analysis and profiling of additional Market players & comparative analysis of competitive products.
Go to Market Strategy: Find the high-growth channels to invest your marketing efforts and increase your customer base.
Innovation Mapping: Identify racial solutions and innovation, connected to deep ecosystems of innovators, start-ups, academics, and strategic partners.
Category Intelligence: Customized intelligence that is relevant to their supply Markets will enable them to make smarter sourcing decisions and improve their category management.
Public Company Transcript Analysis: To improve the investment performance by generating new alpha and making better-informed decisions.
Social Media Listening: To analyze the conversations and trends happening not just around your brand, but around your industry as a whole, and use those insights to make better Marketing decisions.
REQUEST FOR SAMPLE
 REQUEST FREE CUSTOMIZATION
Global Water Analysis Spectrometer Market size was valued at USD 3.18 Billion in 2024 and is poised to grow from USD 3.41 Billion in 2025 to USD 5.9 Billion by 2033, growing at a CAGR of 7.1% during the forecast period (2026-2033).
I’m unable to provide the requested competitive‑landscape overview and startup details without reliable source information. 'Hach Company', 'Thermo Fisher Scientific Inc.', 'Agilent Technologies, Inc.', 'Shimadzu Corporation', 'PerkinElmer, Inc.', 'HORIBA Ltd.', 'Metrohm AG', 'Xylem Inc.', 'Endress+Hauser Group', 'Anton Paar GmbH', 'ABB Ltd.', 'Hanna Instruments', 'YSI Inc.', 'Palintest Ltd.', 'Lovibond Tintometer GmbH', 'JASCO Corporation', 'Analytik Jena GmbH', 'Merck KGaA', 'Waters Corporation', 'Teledyne Tekmar'
The demand for continuous water quality assessment in industrial and municipal settings is prompting laboratories to seek instruments that deliver rapid, accurate spectroscopic data. Real‑time monitoring enables immediate corrective actions, reduces downtime, and supports compliance with stringent regulatory standards. Consequently, organizations are increasingly allocating budgets toward advanced analysis spectrometers that can operate on‑site, offering flexibility and minimizing sample transport requirements. This shift directly fuels market expansion as manufacturers respond with portable, user‑friendly models designed for continuous deployment. Adoption of these solutions also enhances data traceability, facilitating long‑term environmental stewardship initiatives.
Sustainable Water Management Push: Regulators and corporate ESG commitments are driving operators to adopt spectroscopic solutions that enable real‑time monitoring of contaminants, allowing proactive adjustments to treatment processes. This focus on minimizing discharge footprints aligns with circular economy goals, encouraging manufacturers to integrate compact, low‑power spectrometers into existing water infrastructure. As stakeholders prioritize transparency, the demand for portable, easy‑to‑deploy instruments that support continuous compliance reporting is accelerating, positioning these devices as essential components of next‑generation water stewardship strategies for industrial and municipal clients alike.
Why does North America Dominate the Global Water Analysis Spectrometer Market? |@12


Want to customize this report? This report can be personalized according to your needs. Our analysts and industry experts will work directly with you to understand your requirements and provide you with customized data in a short amount of time. We offer $1000 worth of FREE customization at the time of purchase.
Feedback From Our Clients


 USA (+1) 351-333-4748

