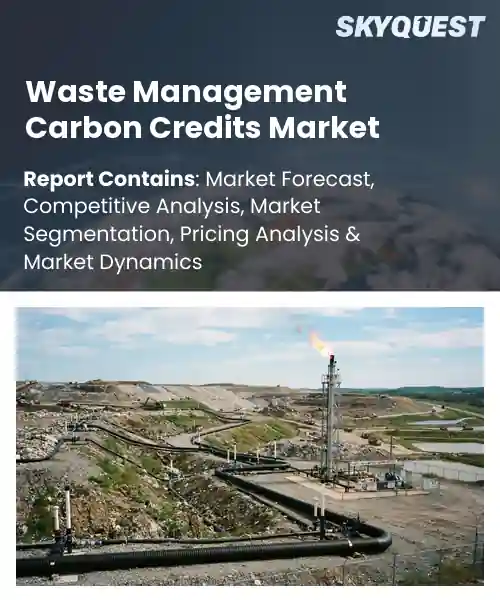
Waste Management Carbon Credits Market
Report ID: SQMIG20L2129
Report ID: SQMIG20L2129
[email protected]
USA +1 351-333-4748
Report ID:
SQMIG20L2129 |
Region:
Global |
Published Date: September, 2026
Pages:
157
|Tables:
119
|Figures:
77


Global Waste Management Carbon Credits Market size was valued at USD 1.65 Billion in 2024 and is poised to grow from USD 1.95 Billion in 2025 to USD 7.55 Billion by 2033, growing at a CAGR of 18.4% during the forecast period (2026-2033).
The primary driver of the waste‑management carbon‑credits market is the landscape that forces municipalities and firms to monetize emissions reductions from waste treatment. The market consists of tradable certificates issued when landfill gas capture, composting, or anaerobic digestion lowers greenhouse‑gas output below a baseline, converting performance into revenue and spurring investment in waste‑processing infrastructure. Market emerged after Kyoto Protocol’s Clean Development Mechanism recognized landfill methane avoidance projects; by 2021 EU Emissions Trading Scheme allocations for waste facilities had doubled, illustrating rapid growth. Sweden’s Alva‑Mälaren landfill earned credits for a 30 % methane capture improvement, showing how compliance can generate profit.One key factor driving the waste‑management carbon‑credits market is the surge in corporate net‑zero commitments, which push companies to offset emissions via verified waste projects. As firms set Science‑Based Targets, demand for credits tied to landfill‑gas capture and organic‑waste valorisation rises, encouraging investors to fund anaerobic‑digestion plants that produce renewable gas and generate offset credits. This financing lowers project costs, allowing scale‑up in emerging economies reliant on open‑dumping. A Brazilian food‑processing group partnered with a local digester, securing EU‑registered credits that offset its supply‑chain emissions while supplying biogas to nearby factories, showing how regulatory pressure, financial incentives, and technology together expand market opportunities.
How is AI improving verification of waste management carbon credits?
AI is reshaping how waste‑derived carbon credits are verified by automating data capture, analysis and reporting. Sensors on landfill sites feed real‑time gas measurements into machine‑learning models that estimate emissions reductions with far greater consistency than manual sampling. Satellite imagery adds an independent view, allowing algorithms to cross‑check landfill expansion and methane capture rates. These tools reduce the time needed to certify credits and lower the risk of fraud, giving buyers confidence that each credit reflects genuine climate benefit. As regulators tighten standards, the market is seeing faster transaction cycles and broader participation from firms that can demonstrate transparent, data‑driven verification.In March 2024 a leading waste management firm introduced an AI‑driven verification platform, streamlining the audit process and boosting confidence in carbon credit transactions, which supports market growth and operational efficiency.
Market snapshot - (2026-2033)
Global Market Size
USD 1.65 Billion
Largest Segment
Avoidance Credits
Fastest Growth
Removal Credits
Growth Rate
18.4% CAGR
To get more insights on this market click here to Request a Free Sample Report
Global waste management carbon credits market is segmented by credit type, waste management activity, market type, buyer type and region. Based on credit type, the market is segmented into Avoidance Credits and Removal Credits. Based on waste management activity, the market is segmented into Landfill Gas Capture, Waste-to-Energy, Recycling, Composting & Organic Waste Management, Wastewater Treatment and Other Waste Management Activities. Based on market type, the market is segmented into Compliance Carbon Market and Voluntary Carbon Market. Based on buyer type, the market is segmented into Corporations, Governments & Public Entities, Financial Institutions and Other Buyers. Based on region, the market is segmented into North America, Europe, Asia Pacific, Latin America and Middle East & Africa.
Landfill gas capture segment dominates because it provides the most direct and measurable source of methane avoidance, which translates into credible carbon credits. Captured gas can be flared or converted to electricity, delivering immediate emissions reductions that buyers trust. This reliability aligns with stringent verification standards, encouraging project developers to prioritize landfill interventions. Consequently, investors and regulators favor these projects, reinforcing their market leadership within the global market.
However, composting & organic waste management segment is witnessing the strongest growth momentum as circular economy policies incentivize carbon sequestration through soil amendment. Innovative feedstock preprocessing and certification schemes boost credit generation, attracting buyers seeking nature based solutions. This expanding pipeline diversifies pipelines and amplifies market breadth, creating investment avenues.
Avoidance credits segment dominates because it leverages direct methane suppression, a well understood pathway that aligns with existing verification protocols. Stakeholders trust the quantifiable emission reductions achieved by diverting waste emissions, making project financing more straightforward. The maturity of avoidance methodologies reduces uncertainty and accelerates registry approvals, encouraging developers to prioritize these projects. This confidence fuels sustained demand from buyers focused on immediate compliance and credibility within the global market.
Meanwhile, removal credits segment is emerging as the key high growth area as advances in biochar production and waste derived feedstock for carbon sequestration gain traction. Emerging certification frameworks legitimize storage claims, attracting impact focused investors. This innovation expands the credit supply pipeline, promising new revenue streams and stimulating broader market participation.
To get detailed segments analysis, Request a Free Sample Report
North America’s dominance stems from a confluence of mature regulatory frameworks, substantial investment in advanced waste processing technologies, and a deep integration of carbon accounting into corporate sustainability strategies. Robust financial markets provide liquidity for carbon credit transactions, while strong public‑private partnerships accelerate the deployment of waste‑to‑energy projects. The region benefits from extensive research institutions that drive innovation in recycling and emissions reduction, creating a virtuous cycle of credibility and demand for verified carbon credits. Additionally, consumer awareness and corporate commitments to net‑zero targets reinforce market depth, positioning North America as the benchmark for scalable and credible carbon credit solutions in waste management.
Waste Management Carbon Credits Market in the United States is propelled by a sophisticated ecosystem of regulatory incentives, corporate emissions reporting, and a thriving market for renewable energy credits. The country’s extensive landfill gas capture programs and large‑scale recycling initiatives generate high‑quality credits that attract multinational participants. Innovation hubs across the nation foster new technologies for waste conversion, reinforcing a pipeline of credible projects. Stakeholder collaboration between government agencies, NGOs, and private sector players ensures transparency and fosters confidence in credit integrity.
Waste Management Carbon Credits Market in Canada is distinguished by strong provincial policies that encourage diversion of organic waste and support for low‑carbon technologies. The nation’s emphasis on circular economy principles drives investment in composting and anaerobic digestion facilities, creating a steady flow of verified emissions reductions. Collaborative research networks link academic expertise with industry pilots, enhancing the credibility of credit generation. Market participants benefit from a reputation for rigorous verification standards, positioning Canada as a trusted source of high‑integrity carbon credits.
Europe’s rapid expansion is fueled by ambitious climate legislation that embeds carbon pricing and waste reduction targets into national agendas. The region’s emphasis on circular economy principles encourages high‑value recycling and innovative waste‑to‑resource projects, generating robust credit supplies. Strong governance structures and standardized verification protocols boost market confidence, attracting diverse investors seeking credible offsets. Collaborative cross‑border initiatives enable scaling of best practices, while corporate commitments to decarbonization amplify demand for transparent and traceable waste‑related carbon credits. This integrated approach positions Europe as a leader in both policy and practice for waste‑based climate solutions.
Waste Management Carbon Credits Market in Germany is anchored by rigorous waste separation mandates and a well‑established infrastructure for energy recovery from residual streams. The country’s focus on renewable energy integration ensures that captured landfill gas and biogas projects meet high environmental standards, producing credible credits. Collaborative platforms among industry, research institutes, and regulators facilitate continuous improvement of methodologies, reinforcing Germany’s role as a dominant source of high‑quality waste‑related carbon offsets.
Waste Management Carbon Credits Market in the United Kingdom is experiencing accelerated growth through supportive policy frameworks that incentivize organic waste diversion and carbon capture initiatives. The nation’s commitment to net‑zero objectives drives corporate participation in credit markets, while innovative financing mechanisms unlock new project pipelines. Strong emphasis on transparent reporting and third‑party verification enhances market credibility, positioning the United Kingdom as a fast‑moving hub for credible waste‑derived carbon credits.
Waste Management Carbon Credits Market in France is emerging as a dynamic segment, propelled by national strategies that prioritize waste minimization and renewable energy generation from waste streams. Emerging projects in anaerobic digestion and municipal solid waste valorization contribute to a growing pool of verified emissions reductions. Collaborative efforts between governmental agencies and local enterprises foster innovation, while an increasing corporate focus on sustainable sourcing amplifies demand for French‑origin waste carbon credits.
Asia Pacific is strengthening its position by harnessing rapid urbanization and heightened environmental awareness to expand waste‑derived carbon credit activities. Governments across the region are introducing favorable policy mechanisms that support waste diversion, energy recovery, and carbon accounting integration. Investment in modern waste processing facilities and emerging technologies, such as advanced composting and bioenergy conversion, creates a pipeline of credible credits. Regional cooperation among trade blocs and standard‑setting bodies enhances market transparency, while multinational corporations seek Asian credits to diversify their offset portfolios, collectively elevating the region’s stature in the global market.
Waste Management Carbon Credits Market in Japan is driven by stringent waste management regulations and a cultural emphasis on resource efficiency. Advanced technologies for waste heat recovery and landfill gas utilization generate high‑integrity emissions reductions. Collaborative research initiatives between universities and industry accelerate the development of innovative carbon credit projects. The market benefits from a strong reputation for meticulous verification, positioning Japan as a reliable source of waste‑based carbon offsets in the Asia Pacific landscape.
Waste Management Carbon Credits Market in South Korea is bolstered by proactive government policies that encourage circular economy practices and renewable energy from waste streams. Investments in cutting‑edge anaerobic digestion and waste‑to‑energy plants generate a growing supply of verified carbon credits. Strong corporate sustainability agendas drive demand for locally sourced offsets, while rigorous certification processes ensure market credibility. This combination of policy support and technological advancement enhances South Korea’s emerging role in the regional carbon credit ecosystem.
To know more about the market opportunities by region and country, click here to
Buy The Complete Report
Increasing Corporate Sustainability Commitment
Regulatory Incentives Promoting Carbon Accounting
Limited Standardization of Credit Verification
High Capital Requirements for Advanced Facilities
Request Free Customization of this report to help us to meet your business objectives.
Intense rivalry among global waste managers drives rapid adoption of carbon‑credit solutions, with firms leveraging M&A, strategic alliances and digital tools to secure verified offsets. In 2022 Veolia formed a joint venture with Carbios to commercialise enzymatic plastic recycling and generate carbon credits, while Waste Management launched a blockchain‑based carbon‑credit marketplace in 2023 to streamline verification. Suez’s 2021 partnership with Carbon Trust further exemplifies the push for credible waste‑derived credits.
Top Player’s Company Profile
Recent Developments
SkyQuest’s ABIRAW (Advanced Business Intelligence, Research & Analysis Wing) is our Business Information Services team that Collects, Collates, Correlates, and Analyses the Data collected by means of Primary Exploratory Research backed by robust Secondary Desk research. As per SkyQuest analysis the global waste‑management carbon‑credits market is being propelled primarily by the surge in corporate sustainability commitments that push firms to offset emissions through verified landfill‑gas projects, making the segment for landfill gas capture the clear market leader. A second important driver is the growing suite of regulatory incentives that embed carbon accounting into waste‑management operations, further expanding credit generation. The market is still led by North America, where mature policies and strong financing ecosystems support large‑scale projects. However, progress is hampered by the limited standardisation of verification methodologies, which creates uncertainty for buyers and slows broader adoption. Overall the market is set for rapid growth as these forces converge.
| Report Metric | Details |
|---|---|
| Market size value in 2024 | USD 1.65 Billion |
| Market size value in 2033 | USD 7.55 Billion |
| Growth Rate | 18.4% |
| Base year | 2024 |
| Forecast period | (2026-2033) |
| Forecast Unit (Value) | USD Billion |
| Segments covered |
|
| Regions covered | North America (US, Canada), Europe (Germany, France, United Kingdom, Italy, Spain, Rest of Europe), Asia Pacific (China, India, Japan, Rest of Asia-Pacific), Latin America (Brazil, Rest of Latin America), Middle East & Africa (South Africa, GCC Countries, Rest of MEA) |
| Companies covered |
|
| Customization scope | Free report customization with purchase. Customization includes:-
|
To get a free trial access to our platform which is a one stop solution for all your data requirements for quicker decision making. This platform allows you to compare markets, competitors who are prominent in the market, and mega trends that are influencing the dynamics in the market. Also, get access to detailed SkyQuest exclusive matrix.
Table Of Content
Executive Summary
Market overview
Parent Market Analysis
Market overview
Market size
KEY MARKET INSIGHTS
COVID IMPACT
MARKET DYNAMICS & OUTLOOK
Market Size by Region
KEY COMPANY PROFILES
Methodology
For the Waste Management Carbon Credits Market, our research methodology involved a mixture of primary and secondary data sources. Key steps involved in the research process are listed below:
1. Information Procurement: This stage involved the procurement of Market data or related information via primary and secondary sources. The various secondary sources used included various company websites, annual reports, trade databases, and paid databases such as Hoover's, Bloomberg Business, Factiva, and Avention. Our team did 45 primary interactions Globally which included several stakeholders such as manufacturers, customers, key opinion leaders, etc. Overall, information procurement was one of the most extensive stages in our research process.
2. Information Analysis: This step involved triangulation of data through bottom-up and top-down approaches to estimate and validate the total size and future estimate of the Waste Management Carbon Credits Market.
3. Report Formulation: The final step entailed the placement of data points in appropriate Market spaces in an attempt to deduce viable conclusions.
4. Validation & Publishing: Validation is the most important step in the process. Validation & re-validation via an intricately designed process helped us finalize data points to be used for final calculations. The final Market estimates and forecasts were then aligned and sent to our panel of industry experts for validation of data. Once the validation was done the report was sent to our Quality Assurance team to ensure adherence to style guides, consistency & design.
Analyst Support
Customization Options
With the given market data, our dedicated team of analysts can offer you the following customization options are available for the Waste Management Carbon Credits Market:
Product Analysis: Product matrix, which offers a detailed comparison of the product portfolio of companies.
Regional Analysis: Further analysis of the Waste Management Carbon Credits Market for additional countries.
Competitive Analysis: Detailed analysis and profiling of additional Market players & comparative analysis of competitive products.
Go to Market Strategy: Find the high-growth channels to invest your marketing efforts and increase your customer base.
Innovation Mapping: Identify racial solutions and innovation, connected to deep ecosystems of innovators, start-ups, academics, and strategic partners.
Category Intelligence: Customized intelligence that is relevant to their supply Markets will enable them to make smarter sourcing decisions and improve their category management.
Public Company Transcript Analysis: To improve the investment performance by generating new alpha and making better-informed decisions.
Social Media Listening: To analyze the conversations and trends happening not just around your brand, but around your industry as a whole, and use those insights to make better Marketing decisions.
REQUEST FOR SAMPLE
 REQUEST FREE CUSTOMIZATION


Want to customize this report? This report can be personalized according to your needs. Our analysts and industry experts will work directly with you to understand your requirements and provide you with customized data in a short amount of time. We offer $1000 worth of FREE customization at the time of purchase.
Feedback From Our Clients


 USA (+1) 351-333-4748

