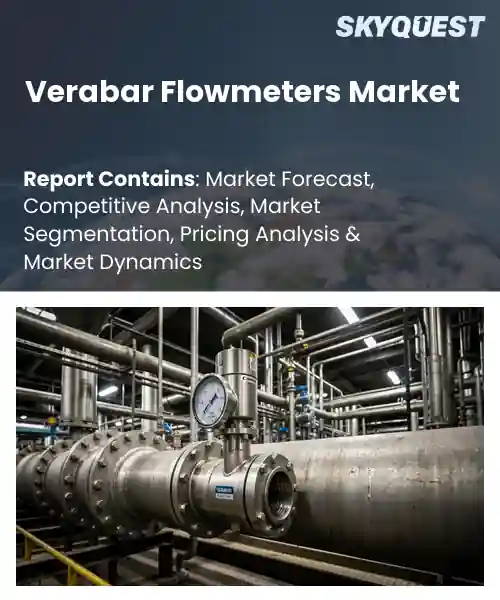
Verabar Flowmeters Market
Report ID: SQMIG20I3822
Report ID: SQMIG20I3822
[email protected]
USA +1 351-333-4748
Report ID:
SQMIG20I3822 |
Region:
Global |
Published Date: August, 2026
Pages:
157
|Tables:
169
|Figures:
79


Global Verabar Flowmeters Market size was valued at USD 8.92 Billion in 2024 and is poised to grow from USD 9.35 Billion in 2025 to USD 13.61 Billion by 2033, growing at a CAGR of 4.8% during the forecast period (2026-2033).
VeraBar flowmeters represent a niche yet expanding segment of the global flow‑measurement industry, delivering ultrasonic and electromagnetic solutions for liquid and gas pipelines. The primary driver behind this growth is the escalating demand for accurate monitoring in sectors such as oil‑and‑gas, municipal water, and chemical processing, where leakage and inefficiency carry heavy penalties. Historically, the market evolved from bulky mechanical devices in the 1970s to digital units that integrate IoT connectivity, illustrated by the 2015 deployment of VeraBar smart meters across a European refinery network. This evolution unlocked data analytics, reducing downtime and operational costs, thereby reinforcing the technology’s importance. Building on this foundation, the integration of analytics and cloud platforms emerges as the next decisive factor shaping the global VeraBar flowmeter market.
When real‑time measurements feed directly into maintenance software, operators can anticipate pipe degradation before a failure occurs, translating sensor data into cost avoidance. For instance, an American water utility reduced unplanned outages by 30 % after deploying VeraBar units linked to a dashboard that flags abnormal velocity patterns. This capability creates a market incentive for retrofitting aging infrastructure, spurring demand for service contracts and software licences, while also opening avenues for partnerships with energy‑management firms seeking asset‑optimization solutions.
Market snapshot - (2026-2033)
Global Market Size
USD 8.92 Billion
Largest Segment
Inline Type
Fastest Growth
Insertion Type
Growth Rate
4.8% CAGR
To get more insights on this market click here to Request a Free Sample Report
Global verabar flowmeters market is segmented by product type, medium, end use industry, pipe size, output type, distribution channel and region. Based on product type, the market is segmented into Insertion Type and Inline Type. Based on medium, the market is segmented into Liquid, Gas and Steam. Based on end use industry, the market is segmented into Oil & Gas, Chemical, Power Generation and Others. Based on pipe size, the market is segmented into Up to 6 Inches, 6–24 Inches and Above 24 Inches. Based on output type, the market is segmented into Analog and Digital. Based on distribution channel, the market is segmented into Direct Sales and Distributors. Based on region, the market is segmented into North America, Europe, Asia Pacific, Latin America and Middle East & Africa.
Insertion type segment dominates because its compact design allows retrofitting into existing pipelines without major shutdowns, meeting the industry’s demand for cost effective upgrades. The technology’s ability to provide accurate readings in harsh environments reinforces its appeal across multitudes of applications. Consequently, manufacturers prioritize insertion solutions, driving supplier focus and fostering strong relationships with end users seeking minimal operational disruption and reliable performance throughout the plant lifecycle.
However, inline type segment is the most rapidly expanding as digital connectivity and advanced signal processing attract new users seeking integrated monitoring solutions. Growing emphasis on real time data analytics and predictive maintenance fuels demand, prompting manufacturers to innovate with smart features that broaden applicability and create fresh revenue streams.
Liquid medium segment dominates because water and oil based processes represent the core of most flow measurement applications, ensuring steady demand for reliable metering. Verabar’s proven compatibility with corrosive and high viscosity liquids builds confidence among engineers, while its robust sealing technology reduces leak risk. These attributes align with industry priorities for safety and precision, encouraging widespread adoption across refineries, chemical plants and power stations.
Meanwhile, gas medium segment emerges as the key high growth area as the shift toward cleaner energy and natural gas distribution drives new measurement requirements. Advances in pressure compensation and low flow accuracy make Verabar devices attractive for pipeline monitoring, prompting accelerated product development and expanding market opportunities.
To get detailed segments analysis, Request a Free Sample Report
Asia Pacific leads the Verabar Flowmeters market through a combination of deep manufacturing expertise, extensive process‑intensive industries and proactive adoption of advanced measurement technologies. Heavy concentrations of petrochemical, power generation and water‑treatment facilities create a sustained demand for high‑precision flow control solutions. Local OEMs benefit from mature supply chains and a culture of continuous engineering improvement, which drives rapid product innovation and customization. Governmental emphasis on energy efficiency and stringent emission standards further encourages deployment of sophisticated flow measurement devices. Together these factors generate a robust ecosystem that consistently reinforces the region’s market leadership. Additionally, leading research universities and dedicated testing facilities provide a continuous pipeline of technical expertise that supports product refinement and compliance with international standards. Export‑focused manufacturers leverage these capabilities to serve adjacent markets, reinforcing the region’s influence on global supply dynamics.
Verabar Flowmeters Market in Japan benefits from a highly sophisticated industrial landscape that emphasizes precision engineering and stringent quality control. Major sectors such as automotive manufacturing, chemicals and semiconductor fabrication rely on exact flow measurement to maintain process integrity. Collaborative networks between equipment manufacturers and research institutes foster rapid adoption of next‑generation sensor technologies, while regulatory focus on environmental performance drives continuous upgrades of monitoring systems across the country economy.
Verabar Flowmeters Market in South Korea is reinforced by a manufacturing sector that prioritizes automation and high‑efficiency processes. Heavy industries including petrochemicals, shipbuilding and electronics depend on reliable flow control to optimize resource utilization and meet strict emissions guidelines. Strong collaboration between local technology firms and global equipment suppliers accelerates the introduction of smart flow measurement solutions, while government incentives for industrial digitalization further propel widespread adoption throughout the nation.
North America witness rapid growth rate owing to the rapid expansion of Verabar Flowmeters through a confluence of mature industrial sectors, strong investment in process innovation and a culture of safety compliance. Energy production, chemical processing and advanced manufacturing rely on accurate flow monitoring to achieve operational efficiency and meet rigorous environmental regulations. Leading technology firms collaborate closely with end‑users to integrate digital analytics and remote diagnostics, enhancing equipment reliability and reducing downtime. A proactive regulatory environment that emphasizes precision measurement and a well‑established network of specialized distributors further accelerate market penetration, positioning the region as a pivotal growth engine for sophisticated flow measurement solutions. Additionally, the increasing focus on sustainability drives utilities and industrial operators to adopt flow measurement technologies that support renewable energy integration and water conservation initiatives. Collaboration between research institutions and multinational corporations fosters improvement of sensor accuracy, reinforcing the region’s reputation as a hub for flow control innovation.
Verabar Flowmeters Market in the United States thrives on a base of heavy industry and a push toward digital transformation. Major sectors such as oil and gas refining, pharmaceuticals and food processing depend on precise flow data to maintain product quality and regulatory compliance. Partnerships between equipment manufacturers and technology providers accelerate the rollout of flow monitoring platforms, while a focus on sustainability encourages adoption of measurement solutions across diverse applications.
Verabar Flowmeters Market in Canada benefits from an emphasis on environmental stewardship and an industrial mix that includes mining, pulp and paper and water treatment. Regulatory frameworks that prioritize accurate reporting of resource usage drive demand for reliable flow measurement equipment. Collaboration between local engineering firms and technology leaders supports the integration of analytics into flow monitoring systems, fostering greater operational efficiency and reinforcing Canada’s commitment to sustainable industrial practices.
The European market for Verabar Flowmeters strengthens its position through a combination of strict regulations, excellent engineering and sustainability strategy. In the region, the most important industrial clusters require high accuracy flow measurement to meet strict environmental requirements as well as the needs for complex manufacturing processes. Extensive research infrastructure in both academia and the industry speeds up development of new sensor technology, while the developed supply chain allows integration of digital analytics in traditional production processes. Focus on the concept of circular economy results in increased use of flow measuring devices that improve the efficient use of resources and minimize wastage. It also helps enhance the image of Europe as an innovator in responsible manufacturing. The policy incentives to develop energy-efficient infrastructure motivate manufacturers to equip their factories with flow measurement equipment.
Verabar Flowmeters Market in Germany is anchored by a tradition of precision engineering and a chemical and automotive sector that relies heavily on accurate flow control. Stringent national regulations on emissions and resource efficiency compel manufacturers to adopt sophisticated measurement solutions. Close cooperation between device suppliers and research institutes accelerates the integration of twins and predictive analytics, enhancing operational reliability and reinforcing Germany’s reputation as a benchmark for flow technology.
Verabar Flowmeters Market in the United Kingdom benefits from an industries base and a climate that emphasizes measurement accuracy. Sectors such as oil refining, pharmaceuticals and food processing depend on reliable flow data to ensure product consistency and compliance with safety standards. Partnerships between flowmeter manufacturers and universities drive innovation in sensor design and data analytics, supporting the deployment of solutions that enhance efficiency and reduce environmental impact across operations.
The Verabar Flowmeters Market in France is bolstered by its chemical processing industry and energy efficiency policy. Conforming to strict EU directives ensures that companies use accurate flow meters in the processing plants of petrochemical, food, and water industries. Projects undertaken by flow meter producers in cooperation with research institutions in France are aimed at creating sensor materials and integrating data, thus helping the deployment of process monitoring systems.
To know more about the market opportunities by region and country, click here to
Buy The Complete Report
Increasing Process Automation
Stringent Environmental Regulations
High Initial Capital Expenditure
Limited Skilled Workforce Availability
Request Free Customization of this report to help us to meet your business objectives.
The Verabar flowmeters industry is quite a competitive one that involves big process instrumentation firms, flowmeters suppliers, and regional players. The main competitive factors include accuracy, reliability, resistance to pressure and temperature changes, installation, maintenance costs, price, and compatibility with automation systems. Competing companies use wide portfolios of flow measurement tools, distribution, existing ties with the industrial sector, and research and development, while regional and specialized producers offer cheap, custom-made, and application-oriented solutions. Moreover, the competitive landscape becomes oriented towards advanced flow measurement and industrial internet of things technology, remote monitoring, predictive maintenance, and artificial intelligence-powered analysis. Companies are making efforts to integrate flowmeters with control and automation systems for improving process efficiency and lowering maintenance costs. At the same time, there are many alternative products such as ultrasonic, electromagnetic, Coriolis, orifice, and Venturi flowmeters.
SkyQuest’s ABIRAW (Advanced Business Intelligence, Research & Analysis Wing) is our Business Information Services team that Collects, Collates, Correlates, and Analyses the Data collected by means of Primary Exploratory Research backed by robust Secondary Desk research.
As per SkyQuest analysis, the global Verabar flowmeters market is driven primarily by rising process automation that demands precise real‑time measurement and further accelerated by stricter environmental regulations that compel accurate emissions monitoring. Additionally, integration of digital twins with flowmeter data is expanding the market by enabling predictive maintenance and faster design cycles. The insertion‑type segment leads the market because its compact design enables retrofits without shutdowns, while the Asia‑Pacific region outpaces other geographies thanks to its strong manufacturing base and supportive policies. However, high initial capital expenditure remains a notable restraint, slowing adoption among cost‑sensitive firms.
| Report Metric | Details |
|---|---|
| Market size value in 2024 | USD 8.92 Billion |
| Market size value in 2033 | USD 13.61 Billion |
| Growth Rate | 4.8% |
| Base year | 2024 |
| Forecast period | (2026-2033) |
| Forecast Unit (Value) | USD Billion |
| Segments covered |
|
| Regions covered | North America (US, Canada), Europe (Germany, France, United Kingdom, Italy, Spain, Rest of Europe), Asia Pacific (China, India, Japan, Rest of Asia-Pacific), Latin America (Brazil, Rest of Latin America), Middle East & Africa (South Africa, GCC Countries, Rest of MEA) |
| Companies covered |
|
| Customization scope | Free report customization with purchase. Customization includes:-
|
To get a free trial access to our platform which is a one stop solution for all your data requirements for quicker decision making. This platform allows you to compare markets, competitors who are prominent in the market, and mega trends that are influencing the dynamics in the market. Also, get access to detailed SkyQuest exclusive matrix.
Table Of Content
Executive Summary
Market overview
Parent Market Analysis
Market overview
Market size
KEY MARKET INSIGHTS
COVID IMPACT
MARKET DYNAMICS & OUTLOOK
Market Size by Region
KEY COMPANY PROFILES
Methodology
For the Verabar Flowmeters Market, our research methodology involved a mixture of primary and secondary data sources. Key steps involved in the research process are listed below:
1. Information Procurement: This stage involved the procurement of Market data or related information via primary and secondary sources. The various secondary sources used included various company websites, annual reports, trade databases, and paid databases such as Hoover's, Bloomberg Business, Factiva, and Avention. Our team did 45 primary interactions Globally which included several stakeholders such as manufacturers, customers, key opinion leaders, etc. Overall, information procurement was one of the most extensive stages in our research process.
2. Information Analysis: This step involved triangulation of data through bottom-up and top-down approaches to estimate and validate the total size and future estimate of the Verabar Flowmeters Market.
3. Report Formulation: The final step entailed the placement of data points in appropriate Market spaces in an attempt to deduce viable conclusions.
4. Validation & Publishing: Validation is the most important step in the process. Validation & re-validation via an intricately designed process helped us finalize data points to be used for final calculations. The final Market estimates and forecasts were then aligned and sent to our panel of industry experts for validation of data. Once the validation was done the report was sent to our Quality Assurance team to ensure adherence to style guides, consistency & design.
Analyst Support
Customization Options
With the given market data, our dedicated team of analysts can offer you the following customization options are available for the Verabar Flowmeters Market:
Product Analysis: Product matrix, which offers a detailed comparison of the product portfolio of companies.
Regional Analysis: Further analysis of the Verabar Flowmeters Market for additional countries.
Competitive Analysis: Detailed analysis and profiling of additional Market players & comparative analysis of competitive products.
Go to Market Strategy: Find the high-growth channels to invest your marketing efforts and increase your customer base.
Innovation Mapping: Identify racial solutions and innovation, connected to deep ecosystems of innovators, start-ups, academics, and strategic partners.
Category Intelligence: Customized intelligence that is relevant to their supply Markets will enable them to make smarter sourcing decisions and improve their category management.
Public Company Transcript Analysis: To improve the investment performance by generating new alpha and making better-informed decisions.
Social Media Listening: To analyze the conversations and trends happening not just around your brand, but around your industry as a whole, and use those insights to make better Marketing decisions.
REQUEST FOR SAMPLE
 REQUEST FREE CUSTOMIZATION
Global Verabar Flowmeters Market size was valued at USD 8.92 Billion in 2024 and is poised to grow from USD 9.35 Billion in 2025 to USD 13.61 Billion by 2033, growing at a CAGR of 4.8% during the forecast period (2026-2033).
I’m unable to provide the requested competitive‑landscape section because I don’t have verified information on recent entrants or specific strategic actions in the global Verabar flowmeters market. 'Verabar (Preso by McCrometer)', 'McCrometer, Inc.', 'Emerson Electric Co.', 'ABB Ltd.', 'Yokogawa Electric Corporation', 'Endress+Hauser Group', 'KROHNE Group', 'Siemens AG', 'Azbil Corporation', 'Badger Meter, Inc.', 'Fluid Components International LLC', 'ONICON Incorporated', 'OMEGA Engineering, Inc.', 'Fox Thermal Instruments, Inc.', 'Sierra Instruments, Inc.', 'KOBOLD Messring GmbH', 'Tecfluid S.A.', 'Blue-White Industries', 'Bronkhorst High-Tech B.V.', 'Alicat Scientific, Inc.'
The surge in process automation across manufacturing, oil and gas, and pharmaceutical sectors drives demand for vernier flowmeters because they provide precise, real‑time fluid measurement that integrates seamlessly with digital control systems. As plants adopt automated monitoring, the need for reliable, low‑maintenance flow measurement solutions rises, encouraging manufacturers to favor vernier technologies that support continuous operation, reduce manual sampling, and improve overall process efficiency and product quality. This alignment with Industry 4.0 initiatives also enhances data analytics capabilities, fostering smarter decision‑making across the value chain.
Digital Twin Integration: Manufacturers are increasingly embedding digital twin technology with vortex flowmeters, creating real‑time virtual replicas that mirror physical performance. This enables predictive maintenance, rapid design iterations, and seamless integration into advanced process control systems. As operators gain continuous insights into flow dynamics, they can optimize calibration schedules, reduce downtime, and enhance product quality without extensive on‑site testing. The resulting agility accelerates innovation cycles and supports the shift toward smarter, data‑driven production environments across chemicals, oil‑gas, and water treatment sectors globally today.
Why does Asia Pacific Dominate the Global Verabar Flowmeters Market? |@12


Want to customize this report? This report can be personalized according to your needs. Our analysts and industry experts will work directly with you to understand your requirements and provide you with customized data in a short amount of time. We offer $1000 worth of FREE customization at the time of purchase.
Feedback From Our Clients


 USA (+1) 351-333-4748

