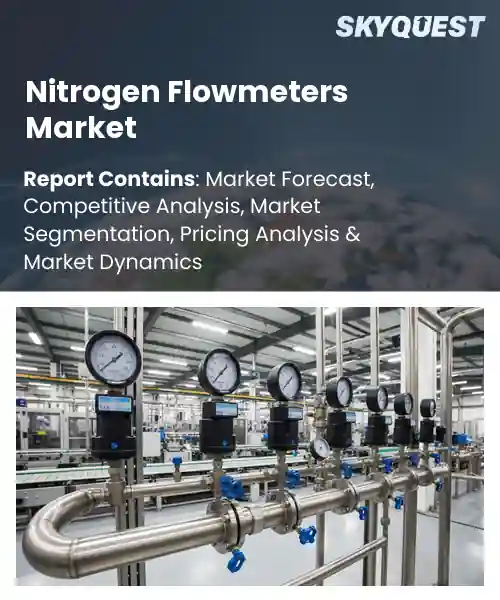
Nitrogen Flowmeters Market
Report ID: SQMIG45J2699
Report ID: SQMIG45J2699
[email protected]
USA +1 351-333-4748
Report ID:
SQMIG45J2699 |
Region:
Global |
Published Date: July, 2026
Pages:
157
|Tables:
147
|Figures:
78


Global Nitrogen Flowmeters Market size was valued at USD 1.2 Billion in 2024 and is poised to grow from USD 1.26 Billion in 2025 to USD 1.86 Billion by 2033, growing at a CAGR of 5.0% during the forecast period (2026-2033).
Nitrogen flowmeters constitute a segment of process instrumentation that measures the volumetric or mass flow of nitrogen gas across industrial applications. Their importance derives from nitrogen’s role as an inert purge and blanketing agent in petrochemical refining, food packaging, and semiconductor manufacturing. Historically, the market emerged in the 1990s when tighter emissions standards forced refineries to implement precise nitrogen injection for hydro‑desulfurization; later, the rise of high‑purity nitrogen demand in electronics spurred adoption of digital thermal mass flow sensors. The transition from mechanical rotameters to advanced ultrasonic systems demonstrates technological advancements and growing regulatory needs which make flow measurement necessary.
The key trend driving the global nitrogen flowmeters sector is the acceleration of digitalization within process industries, which amplifies demand for data analytics and monitoring. The rise of Industrial Internet of Things (IIoT) technology with regards to manufacturing calls into question the need for the use of flowmeters that can perform calibrated measurements without wired connections. Manufacturers also realize their responsibility of equipping flowmeters with troubleshooting and maintenance algorithms. For example, a company, engaged in the production of chemicals, managed to lower the level of nitrogen consumption by 12 % due to the installation of ultrasonic flowmeters integrated into the unified monitoring system. Thus, vendors become able to offer a bigger number of service contracts while users get lower operating costs and improved compliance with legal requirements.
How is AI-Driven Automation Impacting the Accuracy and Adoption of Nitrogen Flowmeters in Industrial Applications?
With the advancement of AI-enabled technology, the performance of nitrogen flow meters is changing, as real-time analytics, predictive diagnostics, and processes of self-calibration are being included into the system. Now, sensors send signals to control systems, which leads to the possibility of immediate correction of drift and temperature effect and thus improves measurement accuracy. The reduced feedback cycle allows for a decrease in required manual adjustment and shorter period of maintenance which makes the appliances more suitable for continuous processes, for example, chemical synthesis and food packaging. While companies are interested in increasing efficiency of their plants, the simple connection with digital twins and cloud-based systems is also facilitating the spread of nitrogen flow meters throughout all industries with the need for precise flow measurement.
In June 2026, Honeywell International Inc. expanded its Forge AI industrial platform with AI-powered predictive analytics and intelligent process optimization for process industries. The solution integrates with smart flow measurement systems, including nitrogen flowmeters, enabling real-time monitoring, predictive maintenance, improved measurement accuracy, reduced downtime, and higher operational efficiency across industrial gas applications.
Market snapshot - (2026-2033)
Global Market Size
USD 1.2 Billion
Largest Segment
Thermal Mass Flowmeters
Fastest Growth
Ultrasonic Flowmeters
Growth Rate
5.0% CAGR
To get more insights on this market click here to Request a Free Sample Report
Global nitrogen flowmeters market is segmented by product type, display type, application, end user, portability and region. Based on product type, the market is segmented into variable area flowmeters, thermal mass flowmeters, differential pressure flowmeters and ultrasonic flowmeters. Based on display type, the market is segmented into analog and digital. Based on application, the market is segmented into industrial gas distribution, laboratory, medical gas supply, semiconductor manufacturing and others. Based on end user, the market is segmented into healthcare, chemical & petrochemical, electronics & semiconductor, food & beverage and others. Based on portability, the market is segmented into fixed and portable. Based on region, the market is segmented into North America, Europe, Asia Pacific, Latin America and Middle East & Africa.
Based on the global nitrogen flowmeters market growth, ultrasonic flowmeters segment dominates because they provide nonintrusive measurement, high accuracy, and low pressure drop, which align with the stringent purity requirements of nitrogen handling. Being able to function without contact prevents the risk of contamination, which is why they are ideal choices for many important operations. Furthermore, the simplicity of their implementation into digital control systems makes them widely used in various industries, semiconductor applications, and pharmaceutical processes.
However, thermal mass flowmeters are witnessing the strongest growth momentum because their direct measurement principle delivers exceptional accuracy for low flow rates, which is crucial in emerging nitrogen‑based precision processes. New developments in the miniaturization of sensors and their integration into IoT platforms will lead to growing application in small systems and hence faster market growth.
Industrial Gas Distribution segment dominates because nitrogen flowmeters are essential for controlling bulk supply, ensuring consistent pressure and purity across pipelines. The high throughput nature of distribution networks requires effective and continuous monitoring which increases the demand for effective measurement solutions. Furthermore, stringent regulations for gas quality and safety increase the need for accurate measuring instruments thus making this application the main driver of the market volume and long-term performance.
Meanwhile, semiconductor manufacturing is emerging as the key high growth area because nitrogen flowmeters enable clean environments required for wafer processing. Consequently, the development of compact nodes and huge yields makes it necessary to use accurate flow control and advanced monitoring technologies leading to easier integration of flowmeter instruments. Such increased demand fosters market development and brings new chances for flowmeter applications.
To get detailed segments analysis, Request a Free Sample Report
As per the global nitrogen flowmeters market share, North America maintains leadership through a combination of deep industrial expertise, extensive research and development capabilities, and a highly integrated supply chain that spans raw material sourcing to end‑user service. Precision nitrogen flow control is essential to the major sectors of the region, including aerospace, oil and gas, food processing, and semiconductor manufacturing, leading to a strong need for sophisticated measurement solutions. World-famous manufacturers stimulate the development of advanced technology of measurement devices. Additionally, strong after-sales networks guarantee reliable calibration and support of products. The regulatory environment emphasizes safety, environment protection, and efficiency of operations, which also leads to widespread use of nitrogen measuring devices. Collaboration between universities, research institutes, and industries, as well as huge investments in modernizing production facilities contribute to the position of North America in this field of science.
Nitrogen flowmeters market in United States is propelled by extensive deployment across petrochemical refining, food processing, and high‑tech manufacturing. The presence of equipment manufacturers and the wide distribution networks enable quick acceptance of new sensor technology. The priority of the customers is given to accurate and compliant devices, which also leads to the demand for calibration services. The focus on automation and advanced digital integration enhance the status of the USA as a center for complex technologies in measuring nitrogen flow.
Nitrogen flowmeters market in Canada benefits from a diversified industrial base that includes natural resource extraction, forestry, and food safety sectors. Domestic companies are working with research laboratories to develop specific flow measuring devices for use where harsh environmental conditions are present. The focus on environmental legislation and efficient functioning leads companies to invest in exact monitoring of nitrogen. The efficient logistics network and qualified skilled labor guarantee timely service and repair and put Canada at the forefront of the larger North American market.
Based on global nitrogen flowmeters regional forecast, Europe experiences accelerated growth due to stringent environmental directives, a strong focus on energy efficiency, and mature manufacturing ecosystems that demand high precision instrumentation. The industries of chemicals, pharmaceuticals, and nutrition make nitrogen flow control their main priority in their work, in order to accomplish quality requirements and lower emissions. Because of this, the need for trustworthy meters is quite big. The present network of R&D institutions and OEMs guarantees continuous modernization in this field, indicated mainly by developments in smart technologies and wireless transmission of data. Simplified regulatory framework among the member states facilitates the entrance to the market and promotes cross-border adoption among the manufacturers.
Nitrogen flowmeters market in Germany benefits from deep engineering expertise and a robust chemical production sector. Prominent producers work together with research centers to introduce intelligent diagnostics into devices that are used for measuring flow. The necessity for accuracy and adherence to strict European regulations contributes to the implementation of smart devices in automotive, aerospace, and food safety applications. Continuous investment in digital twins and predictive analytics strengthens the market’s competitive edge.
Nitrogen flowmeters market in United Kingdom experiences rapid adoption driven by a vibrant life sciences and food processing landscape that requires exact nitrogen dosing. The joint efforts between research institutions and equipment manufacturers expedite the adoption of smart flow measurement systems. The need for improving environmental friendliness and minimizing waste has made the transition to accurate measurement systems inevitable. The increasing focus on data integration in MES drives the growth of the demand for solutions capable of transmitting key performance indicators in real time, making the UK one of the most dynamic segments in Europe.
Nitrogen flowmeters market in France is emerging as a noteworthy market thanks to expanding agro‑food processing and renewable energy initiatives that rely on precise nitrogen handling. Local companies concentrate on tailoring the flowmeter to the individual process parameters while ensuring compliance with the safety requirements established in Europe. Collaboration with globally recognized technology suppliers enables obtaining cutting-edge sensors. The country's dedication to the principles of the circular economy is stimulating interest in efficient nitrogen usage.
As per global nitrogen flowmeters regional outlook, Asia Pacific is solidifying its role through rapid industrial expansion, heightened emphasis on quality control, and strategic investment in advanced manufacturing capabilities. Major economies are developing petrochemical facilities, semiconductor plants and automobile factories that require precise nitrogen flow measurement for product quality control and safety. Government programs supporting smart factories involve integration of advanced flow measuring devices with process automation systems. Partnership of global manufacturers and regional technical centers speeds up the development of technologies while decreasing the time and the cost of innovations. The heightened interest in environmental issues pushes forward the adaptation of precise nitrogen measurement technology to lower emissions and pollution and improve the competitiveness of the region.
Nitrogen flowmeters market in Japan leverages its reputation for precision engineering and strong electronics manufacturing base to drive demand for high‑performance flow measurement solutions. Local manufacturers collaborate closely with semiconductor and automotive suppliers in order to create meters that achieve high levels of precision. Focus on reliability in compliance with high quality standards makes it possible for meters to be widely used in the food-packaging and pharmaceutical sectors. In addition, effective cooperation with universities aids the accuracy of sensors and ensures their ability to connect with the IoT network, thus consolidating Japan's position on the market.
Nitrogen flowmeters market in South Korea benefits from a dynamic petrochemical and display panel industry that relies on meticulous nitrogen flow control. Domestic manufacturers of equipment emphasize on compact and efficient designs suitable for high-volume production. Government incentives for high-tech and digital transformation speed up the introduction of smart meters connected with real-time analytics platforms. Collaborations with international technology companies help with technology transfer and quick implementation of innovations sharpening South Korea’s position as a provider of advanced technological solutions in the sphere of nitrogen flow measurement.
To know more about the market opportunities by region and country, click here to
Buy The Complete Report
Increasing Industrial Automation Adoption
Stringent Environmental Regulations driving Demand
High Capital Investment Required
Limited Compatibility with Legacy Systems
Request Free Customization of this report to help us to meet your business objectives.
The competitive landscape in the global nitrogen flowmeters market outlook is shaped by intense rivalry among established manufacturers and emerging innovators, driving rapid product differentiation and strategic collaborations. Companies are accelerating M&A activity to expand technology portfolios, forging partnerships with industrial gas suppliers to integrate smart monitoring solutions, and investing heavily in digital sensor advancements to improve accuracy and reduce maintenance costs.
Top Player’s Company Profile
Recent Developments
SkyQuest’s ABIRAW (Advanced Business Intelligence, Research & Analysis Wing) is our Business Information Services team that Collects, Collates, Correlates, and Analyses the Data collected by means of Primary Exploratory Research backed by robust Secondary Desk research.
As per SkyQuest analysis, the global nitrogen flowmeters industry is being propelled primarily by the rapid adoption of industrial automation, which pushes demand for smart, interoperable meters that boost accuracy and throughput. A second strong driver is tightening environmental regulations that require precise nitrogen control to meet emissions standards. The market is led by North America, where mature supply chains and heavy investment in high‑tech industries sustain growth. Ultrasonic flowmeters dominate the product segment thanks to their non‑intrusive, high‑accuracy measurement and easy digital integration. Nonetheless, the significant capital investment required for modern devices continues to be a main inhibition to adoption by operators who are price sensitive.
| Report Metric | Details |
|---|---|
| Market size value in 2024 | USD 1.2 Billion |
| Market size value in 2033 | USD 1.86 Billion |
| Growth Rate | 5.0% |
| Base year | 2024 |
| Forecast period | (2026-2033) |
| Forecast Unit (Value) | USD Billion |
| Segments covered |
|
| Regions covered | North America (US, Canada), Europe (Germany, France, United Kingdom, Italy, Spain, Rest of Europe), Asia Pacific (China, India, Japan, Rest of Asia-Pacific), Latin America (Brazil, Rest of Latin America), Middle East & Africa (South Africa, GCC Countries, Rest of MEA) |
| Companies covered |
|
| Customization scope | Free report customization with purchase. Customization includes:-
|
To get a free trial access to our platform which is a one stop solution for all your data requirements for quicker decision making. This platform allows you to compare markets, competitors who are prominent in the market, and mega trends that are influencing the dynamics in the market. Also, get access to detailed SkyQuest exclusive matrix.
Table Of Content
Executive Summary
Market overview
Parent Market Analysis
Market overview
Market size
KEY MARKET INSIGHTS
COVID IMPACT
MARKET DYNAMICS & OUTLOOK
Market Size by Region
KEY COMPANY PROFILES
Methodology
For the Nitrogen Flowmeters Market, our research methodology involved a mixture of primary and secondary data sources. Key steps involved in the research process are listed below:
1. Information Procurement: This stage involved the procurement of Market data or related information via primary and secondary sources. The various secondary sources used included various company websites, annual reports, trade databases, and paid databases such as Hoover's, Bloomberg Business, Factiva, and Avention. Our team did 45 primary interactions Globally which included several stakeholders such as manufacturers, customers, key opinion leaders, etc. Overall, information procurement was one of the most extensive stages in our research process.
2. Information Analysis: This step involved triangulation of data through bottom-up and top-down approaches to estimate and validate the total size and future estimate of the Nitrogen Flowmeters Market.
3. Report Formulation: The final step entailed the placement of data points in appropriate Market spaces in an attempt to deduce viable conclusions.
4. Validation & Publishing: Validation is the most important step in the process. Validation & re-validation via an intricately designed process helped us finalize data points to be used for final calculations. The final Market estimates and forecasts were then aligned and sent to our panel of industry experts for validation of data. Once the validation was done the report was sent to our Quality Assurance team to ensure adherence to style guides, consistency & design.
Analyst Support
Customization Options
With the given market data, our dedicated team of analysts can offer you the following customization options are available for the Nitrogen Flowmeters Market:
Product Analysis: Product matrix, which offers a detailed comparison of the product portfolio of companies.
Regional Analysis: Further analysis of the Nitrogen Flowmeters Market for additional countries.
Competitive Analysis: Detailed analysis and profiling of additional Market players & comparative analysis of competitive products.
Go to Market Strategy: Find the high-growth channels to invest your marketing efforts and increase your customer base.
Innovation Mapping: Identify racial solutions and innovation, connected to deep ecosystems of innovators, start-ups, academics, and strategic partners.
Category Intelligence: Customized intelligence that is relevant to their supply Markets will enable them to make smarter sourcing decisions and improve their category management.
Public Company Transcript Analysis: To improve the investment performance by generating new alpha and making better-informed decisions.
Social Media Listening: To analyze the conversations and trends happening not just around your brand, but around your industry as a whole, and use those insights to make better Marketing decisions.
REQUEST FOR SAMPLE
 REQUEST FREE CUSTOMIZATION
Global Nitrogen Flowmeters Market size was valued at USD 1.2 Billion in 2024 and is poised to grow from USD 1.26 Billion in 2025 to USD 1.86 Billion by 2033, growing at a CAGR of 5.0% during the forecast period (2026-2033).
The competitive landscape of the global nitrogen flowmeters market is shaped by intense rivalry among established manufacturers and emerging innovators, driving rapid product differentiation and strategic collaborations. Companies are accelerating M&A activity to expand technology portfolios, forging partnerships with industrial gas suppliers to integrate smart monitoring solutions, and investing heavily in digital sensor advancements to improve accuracy and reduce maintenance costs. 'Aalborg Instruments & Controls, Inc.', 'Brooks Instrument, LLC', 'Bronkhorst High-Tech B.V.', 'KROHNE Group', 'OMEGA Engineering, Inc.', 'Emerson Electric Co.', 'Yokogawa Electric Corporation', 'Azbil Corporation', 'Hitachi, Ltd.', 'Badger Meter, Inc.', 'DwyerOmega', 'ABB Ltd.', 'Bürkert GmbH & Co. KG', 'Endress+Hauser Group', 'Siemens AG', 'HORIBA, Ltd.', 'Sierra Instruments, Inc.', 'Sensirion AG', 'TOKYO KEISO CO., LTD.', 'Alicat Scientific, Inc.'
The rapid integration of nitrogen flowmeters into automated production lines enhances process accuracy and reduces manual intervention, enabling manufacturers to achieve higher throughput and consistent product quality. As automation technologies evolve, demand for precise flow measurement intensifies, prompting equipment suppliers to develop advanced, interoperable devices that meet stringent performance criteria, thereby stimulating market expansion across diverse industrial sectors. These improvements also foster greater operational safety by minimizing human exposure to hazardous nitrogen streams, which further encourages adoption by organizations prioritizing compliance and workforce wellbeing.
Sustainable Process Integration: Sustainability pressures are reshaping nitrogen flowmeter adoption as manufacturers embed energy‑efficient instrumentation into process lines. Clients prioritize devices that minimize leakages, reduce waste gas emissions, and support greener certification schemes. Vendors respond by offering flowmeters with low power draw, recyclable housings, and advanced diagnostics that enable proactive maintenance. This alignment with environmental, social and governance (ESG) objectives not only strengthens market credibility but also opens new procurement pathways with companies committed to carbon‑neutral operations and long‑term cost efficiency for operators.
Why does North America Dominate the Global Nitrogen Flowmeters Market? |@12


Want to customize this report? This report can be personalized according to your needs. Our analysts and industry experts will work directly with you to understand your requirements and provide you with customized data in a short amount of time. We offer $1000 worth of FREE customization at the time of purchase.
Feedback From Our Clients


 USA (+1) 351-333-4748

