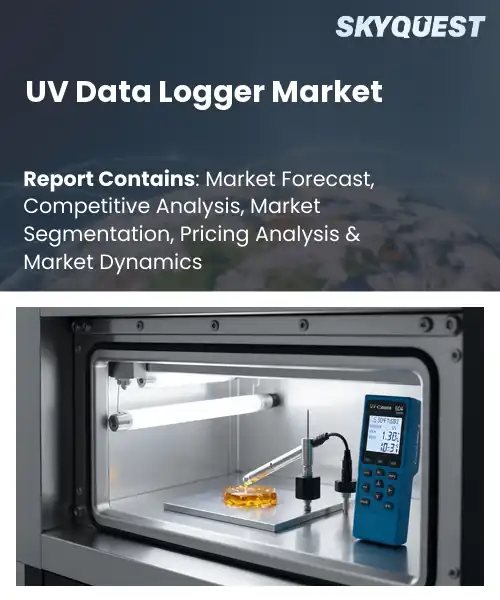
UV Data Logger Market
Report ID: SQMIG45J2687
Report ID: SQMIG45J2687
[email protected]
USA +1 351-333-4748
Report ID:
SQMIG45J2687 |
Region:
Global |
Published Date: July, 2026
Pages:
157
|Tables:
152
|Figures:
78


Global Uv Data Logger Market size was valued at USD 4.87 Billion in 2024 and is poised to grow from USD 5.96 Billion in 2025 to USD 30.04 Billion by 2033, growing at a CAGR of 22.4% during the forecast period (2026-2033).
UV data recorders are devices for recording the intensity of ultraviolet light over time and provide metrics for various industries such as solar energy and cosmetics. Its importance is due to the need to verify product safety, comply with regulations and optimize UV process performance.
Moreover, the global UV data logger market growth is driven by increasing operations and regulatory agencies turning their attention to UV exposure. Governments are tightening the permissible UV thresholds for outdoor workers, so companies have to track this, which drives the demand for compliance loggers immediately. Linking loggers to IoT systems can give solar farms access to analytics that allow them to adjust the tilt of panels based on logged UV flux, which at the time increased energy yield by 5%. Networked sensors enable public health organizations to map neighborhood UV risk, while wearable recorders help athletes obtain data on their performance. The potential for revenue increase motivates manufacturers to produce multi-parameter devices.
Market snapshot - (2026-2033)
Global Market Size
USD 4.87 Billion
Largest Segment
Portable UV Data Loggers
Fastest Growth
Wireless UV Data Loggers
Growth Rate
22.4% CAGR
To get more insights on this market click here to Request a Free Sample Report
The global UV data logger market is segmented by product type, connectivity, application, end user, distribution channel and region. Based on product type, the market is segmented into Portable UV Data Loggers, Fixed UV Data Loggers, Wireless UV Data Loggers and Others. Based on connectivity, the market is segmented into USB, Bluetooth, Wi-Fi, Cellular and Others. Based on application, the market is segmented into Pharmaceutical Monitoring, Laboratory Monitoring, Environmental Monitoring, UV Sterilization Validation and Others. Based on end user, the market is segmented into Pharmaceutical Companies, Research Laboratories, Healthcare Facilities, Environmental Agencies and Others. Based on distribution channel, the market is segmented into Direct Sales, Instrument Distributors, Online Sales and Others. Based on region, the market is segmented into North America, Europe, Asia Pacific, Latin America and Middle East & Africa.
As per the UV data logger market analysis, portable UV data loggers are the most common, mainly because they are easy to carry around and allow measurements right on site, so they satisfy that real-time observation of UV exposure in a mix of settings. Clients tend to like the battery based operation , also the fast, almost straight forward placement and the lower effort for setup , plus reduced labor costs. The general ease of use helps cross functional groups who need adaptable monitoring tools across the whole product life cycle, which in turn supports data integrity, and helps with compliance to regulatory requirements for proper, accurate documentation. Because of that, it is also driving broad adoption in different industries.
However, the strongest growth momentum in the Wireless UV Data Loggers sector is being driven by the emergence of IoT frameworks for smooth remote monitoring and real-time analytics. Manufacturers are also using cloud platforms to cut down on manual data collection and to facilitate predictive maintenance. This innovation is growing the market, creating new revenue streams and opening up new use cases for smart facilities.
According to the UV data logger market forecast, Wi-Fi connectivity is the industry leader with reliable, high-bandwidth connections that are great for continuous data streaming and instant access to UV exposure statistics. For the documentation to be consistent and for laboratory and pharmaceutical facilities to be able to do compliance checks stable local networks that sync up several devices are needed. Its ability to easily connect to existing IT infrastructure that reduces latency and improves traceability of workflows makes it even more attractive for end users across different operation zones.
Meanwhile, the cellular connectivity market is emerging as a major high-growth area as it supports remote deployments in locations without a reliable Wi-Fi infrastructure. Now, field teams can transmit environmental monitoring and sterilization validation data through cellular networks, so even in hard-to-reach areas, they can be tracked continuously. As producers develop cellular modules that are low power and long lasting, this capability expands market reach and the potential for adoption.
To get detailed segments analysis, Request a Free Sample Report
As per the UV data logger market regional forecast, North America dominates the market due to the presence of large industrial ecosystems, stringent regulatory regimes and strong technological expertise. Many businesses and research facilities in the US are constantly working on improving the accuracy of sensors and data analytics. A strong supply chain enables fast product availability and integration in industries such as aerospace, automotive, healthcare and environmental monitoring. Canada’s robust government support system for clean technology efforts and its skilled workforce are spurring uptake in renewable energy and agricultural applications. The region’s focus on quality standards and dependability can be relied upon by international clients, making it the region’s global hub for advanced UV monitoring systems.
United States UV Data Logger Market
The US UV data logger sector is being driven by the advanced research hubs that work closely with the industry leaders to enable quick prototyping and customisation. Established manufacturers can scale production, and strong funding mechanisms encourage innovators to explore niche applications. The connection to digital platforms allows for the easy transfer of data that satisfies the high standards of the outdoor equipment, medical research and aerospace industries. This environment feeds a cycle of ongoing development and market confidence.
Canada UV Data Logger Market
The UV data logger industry in Canada is driven by strong public-private collaborations in climate resilience and environmental responsibility. Government incentives for precision agriculture and renewable energy projects encourage adoption, where improved UV monitoring boosts yield and resource efficiency. Complex product development is supported by a highly educated technical team. Regional test facilities ensure safety regulations are strictly adhered to. These features together position Canada as a strategic hub for state-of-the-art UV measuring technologies.
The rapid UV data logger market penetration in Europe can be attributed to stringent environmental laws, substantial investment in R&D and collaborative industrial environment, among others. The United Kingdom accelerates growth with vibrant start-up ecosystems and strong academic connections, and Germany is the region’s bedrock with strong engineering skills and a tradition of precision instrumentation. In France, the trend is growing to couple UV surveillance with renewable energy and past conservation efforts. A common demand in the automotive, outdoor and aerospace industries is sustainability. Cross-border initiatives and standardized standards facilitate market access. “The blend of the depth of technical talent and the supportive policy environment combine to accelerate the adoption of leading-edge UV monitoring solutions across the continent.
Germany UV Data Logger Market
The market for UV data loggers in Germany is characterized by high-end engineering companies with expertise in rugged design and sensor accuracy. Universities and business work together closely to shorten innovation cycles and provide targeted solutions for scientific research, solar panel validation and automobile testing. The strong export focus and strict quality controls inspire confidence in international buyers. And the German attention to precision and reliability keeps it at the forefront of the European UV measurement scene.
UK UV Data Logger Market
The UK UV Data Logger market is expanding due to government innovation incentives and a strong start-up culture. Collaborative research clusters that link universities with aerospace and healthcare companies are accelerating the development of wireless and cloud-enabled loggers. Safety outdoors and occupational health are driving regulation priorities in sports equipment, environmental monitoring and building. In this fast-moving environment, the UK is leading growth in the European space.
France UV Data Logger Market
The French UV data logger market is growing, driven by the strategic integration of UV monitoring in renewable energy projects and cultural heritage protection. In partnership with niche manufacturers, research institutes are developing compact devices with high sensitivity for solar farms and historic site conservation. As more and more architects and conservationists demand these devices as awareness of UV-induced material degradation increases. This change of focus is turning France into a more relevant player in the fast-growing UV data logger ecosystem in Europe.
Asia Pacific is strengthening its position in the UV data logger market, with rapid technology adoption, improved manufacturing capabilities and growing awareness of environmental monitoring. Japan has a long tradition of precision electronics and a concern with quality control and this has resulted in the provision of state-of-the-art loggers for both industrial and scientific applications. South Korea is leveraging its cutting-edge semiconductor technologies and robust digital connectivity to develop highly integrated gadgets for smart-city and health-tech applications. Regional trade agreements and collaborative research initiatives promote knowledge exchange, and the increasing industrialisation along the Pacific rim is creating a range of application cases, from consumer wearables to agricultural improvement. Due to innovation, efficient production and consumer demand, Asia Pacific is playing a more significant role on the global scene.
Japan UV Data Logger Market
Japan UV Data Logger Market: Japan’s UV data logger market is marked by high degrees of reliability owing to the strong availability of components and the culture of precision engineering. Top electronics companies and universities are teaming up to speed up the development of small, energy-efficient devices for scientific research and outdoor gear. Testing is rigorous and quality standards are high, which increases the confidence of users at home and abroad. Such qualities continue to make Japan a world leader in the field of cutting-edge UV measurement technology.
South Korea UV Data Logger Market
UV Data Logger Market in South Korea is driven by the leading semiconductor technology and the rapidly expanding Internet of Things environment. The rapid connectivity of small sensor packages enables real-time delivery of UV data for smart city infrastructure and health monitoring applications. Government support is encouraging the use of digital transformation in consumer electronics, manufacturing and agriculture. South Korea is a dynamic player in the evolving UV data logger market with its focus on creative design and ability to produce on a large scale.
To know more about the market opportunities by region and country, click here to
Buy The Complete Report
Rising Demand For Real‑Time Monitoring
More and more companies are turning to continuous data from UV exposure to verify the integrity of their products and to meet safety requirements. Manufacturers are building sophisticated logger systems into their production lines. By providing the ability to detect anomalies, reduce waste and perform maintenance proactively, real-time monitoring enhances operational efficiency and builds customer trust. Therefore, end users across several industries are seeking sophisticated logging units, which is propelling the demand for more network-enabled units that are adaptable. Also suppliers are encouraged to expand their geographic reach and product portfolio in emerging markets and niche industries through strategic partnerships.
Expanding Applications In Healthcare Research
UV exposure monitoring is employed in medical research to assess sterilization efficiency, investigate photobiological effects, and verify the proper operation of protective equipment. Precise data logging allows regulatory compliance and repeatable experimental designs, making these devices important in clinical laboratories and biotech companies. As scientific study advances into the areas of dermatological treatments, vaccine stability studies and wound healing procedures, the need for reliable, high resolution UV data loggers is increasing. This expansion compels manufacturers to improve sensor sensitivity and data integration capabilities to attract new clients and increase market momentum.
High Initial Cost Of Equipment
Sophisticated loggers are prohibitively expensive for smaller businesses and research organizations with limited funds due to the complexity of the component, and the requirement for precise calibration to detect UV. The large capital expenditure often demands longer justification times, which slow down implementation and limit immediate market penetration. For the next 10 years, it may restrain the pace at which manufacturers can ramp up production capacity in different parts of emerging economies and in niche sectors, impede overall demand development, and lead potential adopters to choose less competent alternatives or postpone purchases.
Limited Standardization Across Regions
However, there is variation in measurement reliability between different geographic markets because there are no generally accepted calibration procedures and data interpretation guidelines for UV loggers. The need to make devices suitable for different regulations means that manufacturers face more complicated development and higher production costs. Often users have difficulty with compatibility problems when they try to integrate data into their existing quality management systems, making them reluctant to embrace new technology. Such fragmentation reduces incentives for suppliers to take part in wider distribution networks, limits cross-border cooperation and makes it difficult to enter new markets.
Request Free Customization of this report to help us to meet your business objectives.
The UV data logger market is a very competitive market with companies fighting over niche applications such as industrial applications, pharmaceutical storage and environmental monitoring. Many of the leaders are growing via strategic acquisitions of sensor technology companies, distribution partnerships with OEMs, investments in miniaturized IOT-enabled logger designs with real-time cloud analytics, as exemplified by recent joint ventures and product launches to track high-precision UV exposure.
Top Player’s Company Profile
Recent Developments in the UV Data Logger Market
July 2025: MadgeTech added to their line of data loggers with enhanced software for industrial and laboratory monitoring applications, increased battery life and faster wireless connection.
May 2025: Onset announced enhancements to its HOBO data logger platform, including improved cloud connectivity and data visualization for environmental monitoring applications such as UV exposure measurements.
January 2025: ELPRO announced the expansion of its portfolio to include cloud-connected environmental monitoring for improved UV and temperature data logging for laboratory and pharmaceutical purposes, to improve real-time monitoring and regulatory compliance.
SkyQuest’s ABIRAW (Advanced Business Intelligence, Research & Analysis Wing) is our Business Information Services team that Collects, Collates, Correlates, and Analyses the Data collected by means of Primary Exploratory Research backed by robust Secondary Desk research.
As per SkyQuest analysis, the global UV data logger market is further fueled by growing applications in healthcare research. But the high initial cost of equipment is a big barrier to adoption by lesser companies. North America holds the largest share of the market owing to its favorable legislation and strong technological base. However, the portable UV data logger segment holds the maximum share due to their flexibility and ease of deployment on-site. Combined, these factors offer a strong growth trajectory and new opportunities for entrepreneurs around the world.
| Report Metric | Details |
|---|---|
| Market size value in 2024 | USD 4.87 Billion |
| Market size value in 2033 | USD 30.04 Billion |
| Growth Rate | 22.4% |
| Base year | 2024 |
| Forecast period | (2026-2033) |
| Forecast Unit (Value) | USD Billion |
| Segments covered |
|
| Regions covered | North America (US, Canada), Europe (Germany, France, United Kingdom, Italy, Spain, Rest of Europe), Asia Pacific (China, India, Japan, Rest of Asia-Pacific), Latin America (Brazil, Rest of Latin America), Middle East & Africa (South Africa, GCC Countries, Rest of MEA) |
| Companies covered |
|
| Customization scope | Free report customization with purchase. Customization includes:-
|
To get a free trial access to our platform which is a one stop solution for all your data requirements for quicker decision making. This platform allows you to compare markets, competitors who are prominent in the market, and mega trends that are influencing the dynamics in the market. Also, get access to detailed SkyQuest exclusive matrix.
Table Of Content
Executive Summary
Market overview
Parent Market Analysis
Market overview
Market size
KEY MARKET INSIGHTS
COVID IMPACT
MARKET DYNAMICS & OUTLOOK
Market Size by Region
KEY COMPANY PROFILES
Methodology
For the UV Data Logger Market, our research methodology involved a mixture of primary and secondary data sources. Key steps involved in the research process are listed below:
1. Information Procurement: This stage involved the procurement of Market data or related information via primary and secondary sources. The various secondary sources used included various company websites, annual reports, trade databases, and paid databases such as Hoover's, Bloomberg Business, Factiva, and Avention. Our team did 45 primary interactions Globally which included several stakeholders such as manufacturers, customers, key opinion leaders, etc. Overall, information procurement was one of the most extensive stages in our research process.
2. Information Analysis: This step involved triangulation of data through bottom-up and top-down approaches to estimate and validate the total size and future estimate of the UV Data Logger Market.
3. Report Formulation: The final step entailed the placement of data points in appropriate Market spaces in an attempt to deduce viable conclusions.
4. Validation & Publishing: Validation is the most important step in the process. Validation & re-validation via an intricately designed process helped us finalize data points to be used for final calculations. The final Market estimates and forecasts were then aligned and sent to our panel of industry experts for validation of data. Once the validation was done the report was sent to our Quality Assurance team to ensure adherence to style guides, consistency & design.
Analyst Support
Customization Options
With the given market data, our dedicated team of analysts can offer you the following customization options are available for the UV Data Logger Market:
Product Analysis: Product matrix, which offers a detailed comparison of the product portfolio of companies.
Regional Analysis: Further analysis of the UV Data Logger Market for additional countries.
Competitive Analysis: Detailed analysis and profiling of additional Market players & comparative analysis of competitive products.
Go to Market Strategy: Find the high-growth channels to invest your marketing efforts and increase your customer base.
Innovation Mapping: Identify racial solutions and innovation, connected to deep ecosystems of innovators, start-ups, academics, and strategic partners.
Category Intelligence: Customized intelligence that is relevant to their supply Markets will enable them to make smarter sourcing decisions and improve their category management.
Public Company Transcript Analysis: To improve the investment performance by generating new alpha and making better-informed decisions.
Social Media Listening: To analyze the conversations and trends happening not just around your brand, but around your industry as a whole, and use those insights to make better Marketing decisions.
REQUEST FOR SAMPLE
 REQUEST FREE CUSTOMIZATION
Global Uv Data Logger Market size was valued at USD 4.87 Billion in 2024 and is poised to grow from USD 5.96 Billion in 2025 to USD 30.04 Billion by 2033, growing at a CAGR of 22.4% during the forecast period (2026-2033).
The UV data logger market is shaped by intense competition as firms race to secure niche applications in environmental monitoring, pharmaceutical storage, and industrial processes. Leaders are accelerating growth through strategic acquisitions of sensor technology firms, forming distribution partnerships with OEMs, and investing in miniaturized, IoT‑enabled logger designs that offer real‑time cloud analytics, exemplified by recent joint ventures and product rollouts targeting high‑precision UV exposure tracking. 'Onset Computer Corporation', 'Testo SE & Co. KGaA', 'Elitech Technology, Inc.', 'Lascar Electronics Ltd.', 'OMEGA Engineering, Inc.', 'Dickson Company', 'Temprecord International Ltd.', 'MadgeTech, Inc.', 'DeltaTrak, Inc.', 'T&D Corporation', 'Rotronic AG', 'Sensitech Inc.', 'Comark Instruments Ltd.', 'Hanwell Solutions Ltd.', 'ThermoWorks', 'Monnit Corporation', 'Signatrol Ltd.', 'CEM Instruments', 'PCE Instruments', 'MSR Electronics GmbH'
Companies increasingly rely on continuous UV exposure data to ensure product integrity and compliance with safety standards, prompting manufacturers to integrate advanced logger solutions into production lines. Real‑time monitoring enables immediate detection of anomalies, reduces waste, and supports proactive maintenance, which enhances operational efficiency and customer confidence. Consequently, end‑users across sectors seek sophisticated logging devices, driving demand for versatile, network‑enabled units and encouraging suppliers to expand portfolio breadth and geographic reach in emerging markets and niche industries through strategic collaborations.
Energy Efficiency Drives Adoption: As manufacturers and research facilities prioritize carbon‑neutral operations, UV data loggers are increasingly selected for their low power consumption and capability to support continuous, real‑time monitoring without frequent battery replacements. This sustainability focus accelerates adoption across pharmaceutical, food safety, and semiconductor sectors, where maintaining precise UV exposure while minimizing energy footprints aligns with corporate ESG objectives and regulatory expectations. Consequently, suppliers are emphasizing energy‑saving designs, renewable‑powered options, and longer‑life cycles to meet growing market demand for global growth and adoption.
Why does North America Dominate the Global UV Data Logger Market? |@12


Want to customize this report? This report can be personalized according to your needs. Our analysts and industry experts will work directly with you to understand your requirements and provide you with customized data in a short amount of time. We offer $1000 worth of FREE customization at the time of purchase.
Feedback From Our Clients


 USA (+1) 351-333-4748

