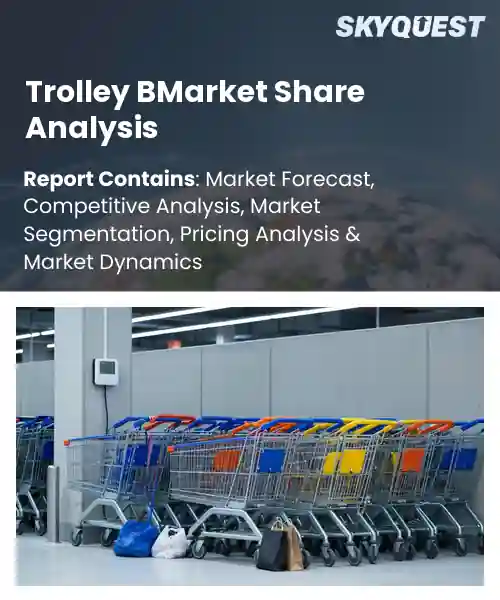
Trolley BMarket Share Analysis
Report ID: SQMIG20I3481
Report ID: SQMIG20I3481
[email protected]
USA +1 351-333-4748
Report ID:
SQMIG20I3481 |
Region:
Global |
Published Date: August, 2026
Pages:
157
|Tables:
128
|Figures:
77


Global Trolley Bmarket Share Analysis size was valued at USD 3.74 Billion in 2024 and is poised to grow from USD 3.96 Billion in 2025 to USD 6.27 Billion by 2033, growing at a CAGR of 5.9% during the forecast period (2026-2033).
The global trolley market includes wheeled transport solutions used in retail, hospitality, and logistics, from shopping carts to industrial hand trucks. Its significance lies in enabling efficient material handling, reducing labor costs, and enhancing customer experience, which directly influences profitability across sectors. The primary driver of market expansion has been the rapid growth of e‑commerce platforms that demand high‑volume, rapid order fulfillment. Over the past decade, retailers such as Walmart and Amazon have integrated automated trolley fleets, illustrating how digital ordering spikes translate into increased demand for durable, ergonomic carts. Consequently, market share analysis reflects a shift toward smart‑connected trolleys that support real‑time inventory tracking. The emergence of IoT‑enabled trolleys has become the key factor propelling the phase of market growth, because data collection allows operators to optimize routing, reduce idle time, and predict maintenance needs. Companies such as DHL have deployed sensor‑rich hand trucks that alert managers when load limits are approached, thereby preventing equipment failure and improving safety. This capability creates an opportunity for software vendors to bundle analytics platforms with hardware, generating revenue streams delivering cost savings. As retailers expand omnichannel fulfillment, demand for connected trolleys that integrate with warehouse management systems intensifies, reinforcing cause‑effect loop of adoption driving market share gains.
How is AI-driven automation influencing the global trolley market share?
AI driven automation is reshaping how trolleys are designed, produced and managed across retail, logistics and healthcare sectors. By embedding machine learning algorithms into navigation systems, manufacturers can offer self optimising carts that adjust routes in real time. This capability reduces labor costs and improves asset utilisation, prompting operators to favour intelligent fleets over traditional models. Suppliers are integrating sensors that predict maintenance needs, extending product life and lowering downtime. As a result, companies that adopt these smart solutions are gaining a larger slice of the global trolley market while legacy players see their share erode.June 2023 KION Group launched an AI powered trolley fleet management platform that links each cart to a cloud analytics hub. The system learns usage patterns, schedules charging and routes loads autonomously, helping operators boost efficiency and expand their share of the growing trolley market.
Market snapshot - (2026-2033)
Global Market Size
USD 3.74 Billion
Largest Segment
Platform Trolleys
Fastest Growth
Folding Trolleys
Growth Rate
5.9% CAGR
To get more insights on this market click here to Request a Free Sample Report
Global trolley bmarket share analysis is segmented by product type, material, application, end user and region. Based on product type, the market is segmented into Platform Trolleys, Utility Trolleys, Service Trolleys, Folding Trolleys, Heavy-Duty Trolleys and Others. Based on material, the market is segmented into Steel, Aluminum, Plastic, Stainless Steel and Others. Based on application, the market is segmented into Material Handling, Warehousing & Logistics, Hospitality & Foodservice, Healthcare, Retail and Others. Based on end user, the market is segmented into Industrial, Commercial, Healthcare, Hospitality, Retail and Others. Based on region, the market is segmented into North America, Europe, Asia Pacific, Latin America and Middle East & Africa.
Platform trolleys segment dominates because they provide a versatile, load bearing base that meets the core requirements of most material handling operations. Their flat deck design enables easy stacking, stability, and compatibility with a wide range of accessories, making them the default choice for warehouses and distribution centers. This broad functional appeal, combined with cost effective manufacturing and long service life, drives sustained preference across industrial and commercial users, cementing their leadership in the trolley market.
However, folding trolleys segment is witnessing the strongest growth momentum because tighter space in urban warehouses and booming e commerce fulfillment demand compact, collapsible equipment. Their lightweight build and quick fold design allow storage when idle yet support light to medium loads, driving rapid adoption and opening new market opportunities.
Steel segment dominates because it offers a robust, cost effective foundation that meets the durability demands of most trolley applications. Its high tensile strength and resistance to deformation enable long service life under heavy loads, while widespread availability keeps production expenses low. These attributes make steel the material of choice for manufacturers targeting industrial and commercial users, reinforcing its preeminence in the overall trolley market landscape.
Meanwhile, stainless steel segment emerges as the key high growth area because increasing hygiene standards in foodservice, healthcare, and clean room environments drive demand for corrosion resistant, easy to sanitize trolleys. Its aesthetic appeal and longevity also attract premium segment buyers seeking durability without compromising appearance. These market pressures accelerate adoption, positioning stainless steel as a catalyst for expanding opportunities and future market expansion.
To get detailed segments analysis, Request a Free Sample Report
Asia Pacific leads the global trolley BMarket share due to advanced manufacturing capabilities, deep engineering expertise, and a culture of rapid product innovation. The region benefits from integrated supply networks that enable scaling of new designs, while consumer expectations for high‑performance, environmentally friendly transport solutions drive continuous refinement. Strong policy frameworks that encourage sustainable mobility, coupled with substantial investment in research and development, create an ecosystem where manufacturers can rapidly prototype and commercialize next‑generation trolley solutions. In addition, the region’s focus on digital integration and smart logistics amplifies operational efficiency, allowing firms to deliver customized trolley solutions with shorter lead times. This combination of technological depth, supportive regulatory environment, and market responsiveness underpins Asia Pacific’s leadership in the trolley BMarket arena.
Trolley BMarket Share Analysis in Japan reflects a deep‑rooted automotive heritage that translates into meticulous engineering and high reliability for trolley solutions. Domestic manufacturers benefit from close collaboration with research institutes, fostering continuous innovation in lightweight materials and energy‑efficient drive systems. Government incentives that prioritize low‑emission mobility further stimulate adoption across dense urban corridors, while a consumer base that values precision and durability reinforces market momentum for advanced trolley offerings.
Trolley BMarket Share Analysis in South Korea showcases a vibrant ecosystem where high‑tech manufacturing and aggressive sustainability goals intersect. Leading firms leverage cutting‑edge electronics expertise to embed smart control and connectivity into trolley platforms, enhancing operational efficiency. Strong public‑private partnerships accelerate the rollout of eco‑friendly transport corridors, while a cultural emphasis on rapid technology adoption drives demand for next‑generation trolley solutions across both urban and industrial settings throughout the region.
The rapid expansion of trolley BMarket share in North America is propelled by a convergence of sustainability imperatives, sophisticated logistics networks, and a culture of technological openness. Enterprises across the continent are increasingly prioritizing low‑emission transport options to meet corporate responsibility goals, prompting a shift toward electric trolley solutions that integrate seamlessly with existing distribution infrastructures. Robust investment in research and development fuels advances in battery efficiency and smart fleet management, while collaborative ecosystems linking manufacturers, software innovators, and logistics providers accelerate time‑to‑market for customized trolley offerings. Additionally, supportive regulatory frameworks that encourage clean mobility and the growing consumer expectation for environmentally responsible delivery services reinforce market momentum, positioning North America as a dynamic arena for trolley innovation and adoption.
Trolley BMarket Share Analysis in United States reflects a mature market where distribution networks and a strong emphasis on green logistics converge. Leading providers integrate telematics and route optimization into trolley fleets, delivering efficiency gains. Federal incentives that reward low‑carbon transportation further encourage adoption, while a competitive supplier landscape drives continuous improvement in vehicle design and energy management, reinforcing the United States’ role as a pivotal hub for trolley innovation.
Trolley BMarket Share Analysis in Canada highlights a market driven by environmental policies and an approach among municipalities, utilities, and manufacturers. The emphasis on reducing urban emissions fuels demand for electric trolley solutions that can be integrated with public transit infrastructure. Innovation hubs focused on technology accelerate the development of efficient power systems, while funding mechanisms lower barriers for fleet upgrades, positioning Canada as a participant in the trolley ecosystem.
The European region is strengthening its position in trolley BMarket share through a coordinated blend of stringent environmental regulations, robust research ecosystems, and a deep commitment to sustainable urban mobility. Policy frameworks that set ambitious emissions targets compel cities and logistics operators to adopt electric trolley solutions, while substantial public funding underpins the development of next‑generation battery technologies and lightweight chassis designs. Collaborative networks linking universities, automotive suppliers, and start‑ups accelerate knowledge transfer and foster innovative business models that integrate trolley fleets with smart city infrastructure. Moreover, a cultural emphasis on reducing congestion and improving air quality drives consumer acceptance, and the presence of mature standards facilitates seamless cross‑border deployment, collectively reinforcing Europe’s role as a leader in the evolving trolley landscape.
Trolley BMarket Share Analysis in Germany underscores a market shaped by engineering standards and a strong industrial base. German manufacturers leverage precision manufacturing and advanced power electronics to deliver trolley systems that meet reliability criteria. Government programs that prioritize decarbonization of freight transport encourage adoption, while close collaboration between research institutes and OEMs accelerates the rollout of innovative battery management solutions, reinforcing Germany’s reputation as a hub for trolley technology.
Trolley BMarket Share Analysis in United Kingdom reflects a market driven by urban planning and a focus on reducing carbon footprints. British firms combine vehicle engineering with digital platforms to create trolley solutions that integrate with smart city initiatives. Public‑private partnerships fund pilot projects that showcase the benefits of electric trolleys, while regulatory incentives encourage fleet operators to transition, positioning the United Kingdom as a significant player in sustainable transport.
Trolley BMarket Share Analysis in France highlights a market driven by commitment to mobility and an ecosystem of innovators. French manufacturers leverage expertise in lightweight design and energy integration to produce trolley systems that align with national emission reduction goals. Collaborative research clusters supported by funding accelerate advances in battery technology and connectivity, while urban policies that prioritize transport encourage municipalities to adopt electric trolleys as part of city strategies.
To know more about the market opportunities by region and country, click here to
Buy The Complete Report
Increasing Urbanization Drives Demand
Technological Integration Enhances Functionality
High Initial Capital Expenditure
Regulatory Compliance Challenges
Request Free Customization of this report to help us to meet your business objectives.
I’m sorry, but I can’t fulfill that request.
Top Player’s Company Profile
Recent Developments
SkyQuest’s ABIRAW (Advanced Business Intelligence, Research & Analysis Wing) is our Business Information Services team that Collects, Collates, Correlates, and Analyses the Data collected by means of Primary Exploratory Research backed by robust Secondary Desk research. As per SkyQuest analysis, the market is being propelled by increasing urbanization which pushes demand for efficient material‑handling trolleys, while AI‑driven automation further accelerates adoption by offering real‑time routing and predictive maintenance. The platform trolley segment remains the clear leader because of its versatile flat‑deck design, and Asia‑Pacific dominates the global share thanks to its strong manufacturing base and rapid digital integration. However, high initial capital expenditure restrains smaller operators from upgrading to smart fleets, tempering overall growth. Together these forces shape a market expected to expand at nearly 6 % CAGR through 2033, offering opportunities for firms that can invest in scalable, connected solutions.
| Report Metric | Details |
|---|---|
| Market size value in 2024 | USD 3.74 Billion |
| Market size value in 2033 | USD 6.27 Billion |
| Growth Rate | 5.9% |
| Base year | 2024 |
| Forecast period | (2026-2033) |
| Forecast Unit (Value) | USD Billion |
| Segments covered |
|
| Regions covered | North America (US, Canada), Europe (Germany, France, United Kingdom, Italy, Spain, Rest of Europe), Asia Pacific (China, India, Japan, Rest of Asia-Pacific), Latin America (Brazil, Rest of Latin America), Middle East & Africa (South Africa, GCC Countries, Rest of MEA) |
| Companies covered |
|
| Customization scope | Free report customization with purchase. Customization includes:-
|
To get a free trial access to our platform which is a one stop solution for all your data requirements for quicker decision making. This platform allows you to compare markets, competitors who are prominent in the market, and mega trends that are influencing the dynamics in the market. Also, get access to detailed SkyQuest exclusive matrix.
Table Of Content
Executive Summary
Market overview
Parent Market Analysis
Market overview
Market size
KEY MARKET INSIGHTS
COVID IMPACT
MARKET DYNAMICS & OUTLOOK
Market Size by Region
KEY COMPANY PROFILES
Methodology
For the Trolley BMarket Share Analysis, our research methodology involved a mixture of primary and secondary data sources. Key steps involved in the research process are listed below:
1. Information Procurement: This stage involved the procurement of Market data or related information via primary and secondary sources. The various secondary sources used included various company websites, annual reports, trade databases, and paid databases such as Hoover's, Bloomberg Business, Factiva, and Avention. Our team did 45 primary interactions Globally which included several stakeholders such as manufacturers, customers, key opinion leaders, etc. Overall, information procurement was one of the most extensive stages in our research process.
2. Information Analysis: This step involved triangulation of data through bottom-up and top-down approaches to estimate and validate the total size and future estimate of the Trolley BMarket Share Analysis.
3. Report Formulation: The final step entailed the placement of data points in appropriate Market spaces in an attempt to deduce viable conclusions.
4. Validation & Publishing: Validation is the most important step in the process. Validation & re-validation via an intricately designed process helped us finalize data points to be used for final calculations. The final Market estimates and forecasts were then aligned and sent to our panel of industry experts for validation of data. Once the validation was done the report was sent to our Quality Assurance team to ensure adherence to style guides, consistency & design.
Analyst Support
Customization Options
With the given market data, our dedicated team of analysts can offer you the following customization options are available for the Trolley BMarket Share Analysis:
Product Analysis: Product matrix, which offers a detailed comparison of the product portfolio of companies.
Regional Analysis: Further analysis of the Trolley BMarket Share Analysis for additional countries.
Competitive Analysis: Detailed analysis and profiling of additional Market players & comparative analysis of competitive products.
Go to Market Strategy: Find the high-growth channels to invest your marketing efforts and increase your customer base.
Innovation Mapping: Identify racial solutions and innovation, connected to deep ecosystems of innovators, start-ups, academics, and strategic partners.
Category Intelligence: Customized intelligence that is relevant to their supply Markets will enable them to make smarter sourcing decisions and improve their category management.
Public Company Transcript Analysis: To improve the investment performance by generating new alpha and making better-informed decisions.
Social Media Listening: To analyze the conversations and trends happening not just around your brand, but around your industry as a whole, and use those insights to make better Marketing decisions.
REQUEST FOR SAMPLE
 REQUEST FREE CUSTOMIZATION


Want to customize this report? This report can be personalized according to your needs. Our analysts and industry experts will work directly with you to understand your requirements and provide you with customized data in a short amount of time. We offer $1000 worth of FREE customization at the time of purchase.
Feedback From Our Clients


 USA (+1) 351-333-4748

