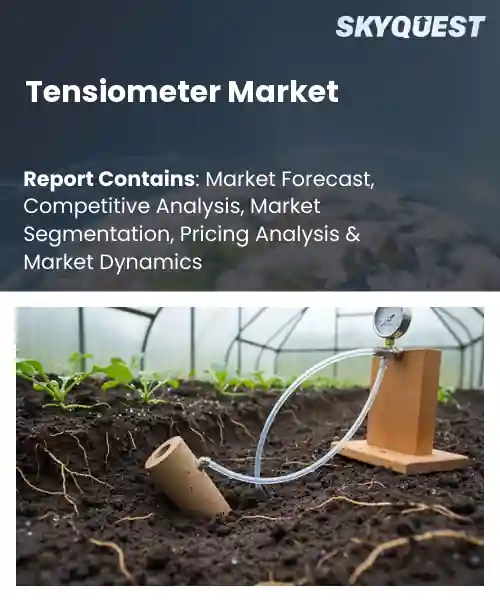
Tensiometer Market
Report ID: SQMIG20C2220
Report ID: SQMIG20C2220
[email protected]
USA +1 351-333-4748
Report ID:
SQMIG20C2220 |
Region:
Global |
Published Date: June, 2026
Pages:
157
|Tables:
175
|Figures:
79


Global Tensiometer Market size was valued at USD 169.8 Million in 2024 and is poised to grow from USD 179.82 Million in 2025 to USD 284.45 Million by 2033, growing at a CAGR of 5.9% during the forecast period (2026-2033).
The primary driver of the tensiometer market as the accelerating need for precise soil moisture management. Tensiometers are a type of sensor that measure the amount of moisture in soil, which helps farmers determine when and how much to irrigate their crops, ultimately maximizing their efficiency in terms of water usage. As we are facing tighter resource allocations in agriculture this technology will only grow more important. Originally created as a porous tube device, the tensiometer market has matured through enhanced materials, digital transducer technologies and enhanced integration with telemetry into a vibrant marketplace.
Building on those technological advances the key trend driving the global tensiometer sector is IoT-enabled analytics that turn point measurements into actionable irrigation strategies. When tensiometers feed real-time soil potential data into cloud platforms farmers can schedule irrigation by crop stress thresholds rather than by fixed timetables, which lowers water and energy costs and increases yield predictability. This capability creates opportunities for service providers to offer subscription-based agronomic insights and for equipment makers to bundle sensors with telemetry. Vineyards and high-value vegetable producers already demonstrate payback within a season, causing broader adoption among commercial farms and irrigation companies and investors.
How is AI Enhancing Predictive Accuracy of Tensiometers in the Market?
Tensiometers measure soil water tension and AI enhances their predictive accuracy by improving data interpretation, calibration, and contextual forecasting. Machine learning models learn patterns from historical sensor traces and external inputs such as weather and satellite soil moisture. Edge analytics and cloud models combine to filter noise, detect sensor drift, and predict near term soil moisture trends. In the current market there is growing integration of tensiometer networks with multimodal data platforms to deliver more reliable irrigation guidance and farm level decision support. Examples include AI driven soil mapping and platform offerings that fuse ground sensors with remote sensing for richer predictions.
In March 2026, Rugged Controls released a new running line tensiometer that highlights embedded telemetry and smarter data pipelines, showing how AI enabled edge analytics and cloud models improve prediction reliability and operational efficiency and support wider adoption in precision agriculture.
Market snapshot - (2026-2033)
Global Market Size
USD 169.8 Million
Largest Segment
Soil Tensiometers
Fastest Growth
Digital Tensiometers
Growth Rate
5.9% CAGR
To get more insights on this market click here to Request a Free Sample Report
Global tensiometer market is segmented by product type, application, measurement range, installation type, end user, distribution channel and region. Based on product type, the market is segmented into Soil Tensiometers, Digital Tensiometers, Mechanical Tensiometers and Others. Based on application, the market is segmented into Agriculture, Greenhouses, Landscaping & Turf Management, Research & Environmental Monitoring and Others. Based on measurement range, the market is segmented into Low Tension, Medium Tension and High Tension. Based on installation type, the market is segmented into Surface Installation and Subsurface Installation. Based on end user, the market is segmented into Farmers, Agricultural Enterprises, Research Institutes, Government Agencies and Others. Based on distribution channel, the market is segmented into Direct Sales, Distributors & Dealers and Online Sales. Based on region, the market is segmented into North America, Europe, Asia Pacific, Latin America and Middle East & Africa.
Based on the global tensiometer market growth, digital tensiometers segment dominates because their real time soil moisture readings and connectivity align with precision agriculture needs, enabling automated irrigation control and data driven decisions. The integration of irrigation systems with existing controller platforms and demand response enables more automated irrigation triggers that reduce the amount of labor and crop stress caused by lack of timely irrigation triggers. This will continue to create broad-based adoption by growers seeking to increase their efficiency levels and provide growers with consistent yields.
However, mechanical tensiometers are emerging as the most rapidly expanding area in the Product Type category due to their robustness and lower cost of ownership, meeting demand for reliable field devices under harsh conditions. Ongoing design simplifications and targeted marketing toward smallholder farmers accelerate deployment and expand market opportunity.
Greenhouses segment leads because controlled environment production demands precise and repeatable soil moisture control for high value crops, driving integration of tensiometers into automated irrigation and fertigation systems. Consistent microclimate conditions allow sensors to deliver reliable feedback that reduces water use and crop variability, prompting greenhouse operators and technology providers to prioritize sensor based irrigation strategies and vendor solutions that support continuous monitoring and coordination between climate and irrigation and operational scalability.
However, landscaping and turf management is emerging as the most rapidly expanding application due to increased demand for water efficient irrigation for public spaces and sports fields, adoption of smart controllers and municipal incentives. This trend opens channels for tailored tensiometers and service oriented deployment models.
To get detailed segments analysis, Request a Free Sample Report
Based on the global tensiometer market share, North America dominates the industry because advanced research infrastructure, mature agricultural systems, and established industrial testing practices create persistent demand for precision surface tension measurement. A strong vendor network with complete service networks and excellent after-market support creates a perception of confidence and expedites the adoption of new technologies. Various end markets, including those from academic research, specialty crops, and formulation testing, help create an environment for continued use across many industries. Close collaboration and cooperation between the equipment manufacturer and end user also help generate practical innovation. In addition, supportive certification and standardization systems as well as targeted public and private investment in instrumentation reduce barriers to adopting new technology. Strong distribution channels and training resources also help facilitate the diffusion of technology so that both traditional suppliers and niche innovators have the ability to scale their solutions and maintain market share in tensiometer technology.
Tensiometer market in United States benefits from concentrated research centers and a diverse base of industrial and academic end users that demand high precision and reliable measurement solutions. Also, the knowledge that users have of quality assurance procedures assists them in choosing new instruments that are advanced in their case. When suppliers work closely with laboratories, they are able to deliver customized features that are integrated into the laboratory’s analytical procedures, which further drive the choice of the user toward proven tensiometer technology.
Tensiometer market in Canada is supported by a mix of specialized agricultural research, resource sector testing needs, and university driven innovation that values dependable surface tension measurement. Established distributors and field service capabilities adapt instruments for varied environmental conditions, while emphasis on calibration and technical support builds trust among users. By working with both manufacturers and research facilities through collaborations, they can test the products they create to find out how receptive farmers will be to buying tensiometers.
Based on global tensiometerregional forecast, rapid expansion of the industry in Europe is propelled by a convergence of robust industrial demand, stringent quality and regulatory expectations, and a strong culture of applied research. Surface tension measurement is crucial in the key manufacturing industries of coatings, automotive materials, specialty food products and pharmaceuticals in each of the above industries. There is an active base of instrument manufacturers and analytical service providers that provide custom-made products based on regional application needs for these specific industries. Collaboration on research institutions across international borders and industry initiatives creates opportunities for technology transfer and localized product development. Increasing end-user knowledge about surface properties and their impact on performance, along with efforts to standardise test methods, will also continue to improve supplier awareness of new markets for surface tension measurement within their respective regions in the European marketplace.
Tensiometer market in Germany benefits from a deep industrial base and precision engineering culture that supports widespread instrument adoption. Rigorous testing of surface properties is a priority for the various manufacturers within the chemicals, automotive, and coatings industries. The domestic vendor community for these products has also grown to include a number of specialized service organizations that customize and calibrate them. Additionally, close relationships between industry and research institutes encourage practical innovation and the development of application-specific measurement workflows throughout production environments.
Tensiometer market in United Kingdom is characterized by dynamic adoption driven by a vibrant life sciences sector and a growing community of tech focused laboratories. Demand from pharmaceutical development, advanced materials research, and specialty formulation testing encourages rapid uptake of flexible, user friendly instruments. Well established consultancy and calibration services have a key role to play in connecting the needs of laboratories with their eventual commercial deployment. Cooperative development between unis and suppliers is a catalyst for creating custom products and integrating into the research workflow processes.
Tensiometer market in France is emerging through a combination of strong formulation industries such as cosmetics and specialty chemicals and an expanding academic focus on materials characterization. Local manufacturers and analytical service providers are offering adapted instrument options and calibration services to meet application specific needs. Research laboratory collaborations with product formulators help to apply experimental techniques to everyday processes like providing regular verification of products. They have helped to create a slow, steady increase in use of tensiometers by businesses.
As per global tensiometer regional outlook, Asia Pacific is strengthening its position in the industry through a blend of increasing local manufacturing capability, focused research activity, and close alignment with major regional end markets. The increase in precision coatings, advanced electronics and pharmaceutical formulation are increasing the requirement for routine measurement of surface tension in both production and quality control. Local suppliers of instrumentation have been expanding their product offerings and services to meet the specific requirements for each application, while strategic partners with global vendors have created an avenue for knowledge transfer and access to the marketplace. Increasing emphasis on calibration infrastructure, technical training and field support has increased user confidence. Finally, the trend of developing instruments for compact, automated or ruggedized use is reflective of regional priorities as well as government and industry-sponsored initiatives that promote the use of instrumentation and collaboration with academic institutions.
Tensiometer market in Japan is advanced by a strong engineering tradition and research activity focused on precision measurement. Demand from electronics, automotive materials, and specialty coatings industries encourages the development of compact instruments suited to production environments. Due to the high demand from the electronics, automotive materials, and specialty coatings industries for compact instruments in production environments, domestic manufacturers are providing quality control, service offerings, and calibration expertise. Collaborating laboratories and universities are helping to refine application-specific measurements, thereby strengthening the capabilities of these instruments.
Tensiometer market in South Korea is influenced by heavy demand from electronics and semiconductor industries that prioritize stringent surface property control. Local suppliers are primarily focused on the development and supply of compact automated products that have integrated monitoring, alongside high-quality calibrating and servicing capabilities. Additionally, trade and export oriented manufacturers are now integrating tensiometer based checks into their quality control procedures in order to meet international standards and customer expectations.
To know more about the market opportunities by region and country, click here to
Buy The Complete Report
Expansion In Oil And Gas
Advancements In Sensor Technology
High Equipment Acquisition Cost
Limited Standardization And Interoperability
Request Free Customization of this report to help us to meet your business objectives.
The competitive landscape for global tensiometers market outlook is driven by rapid product innovation, automation and integration with digital workflows, prompting targeted partnerships and co-development deals rather than broad-brush growth claims. Incumbents are adding modular optical upgrades and dosing accessories while specialist startups commercialize microdosing hardware and plant-embedded sensors to capture continuous measurements, exemplified by DataPhysics’ collaboration with droptical and recent Attension product updates.
Top Player’s Company Profile
Recent Developments
SkyQuest’s ABIRAW (Advanced Business Intelligence, Research & Analysis Wing) is our Business Information Services team that Collects, Collates, Correlates, and Analyses the Data collected by means of Primary Exploratory Research backed by robust Secondary Desk research.
As per SkyQuest analysis, the global tensiometer industry is propelled by a key driver the accelerating need for precise soil moisture management to optimize irrigation and conserve water, while a second driver is the rise of IoT and AI-enabled analytics that turn sensor data into actionable irrigation strategies. A major restraint remains high equipment acquisition cost, which limits adoption among smaller users. North America is the dominating region due to mature agricultural systems, research infrastructure and strong vendor networks. The dominating segment is digital tensiometers as their real time connectivity and integration with precision agriculture platforms drive widespread commercial uptake.
| Report Metric | Details |
|---|---|
| Market size value in 2024 | USD 169.8 Million |
| Market size value in 2033 | USD 284.45 Million |
| Growth Rate | 5.9% |
| Base year | 2024 |
| Forecast period | (2026-2033) |
| Forecast Unit (Value) | USD Million |
| Segments covered |
|
| Regions covered | North America (US, Canada), Europe (Germany, France, United Kingdom, Italy, Spain, Rest of Europe), Asia Pacific (China, India, Japan, Rest of Asia-Pacific), Latin America (Brazil, Rest of Latin America), Middle East & Africa (South Africa, GCC Countries, Rest of MEA) |
| Companies covered |
|
| Customization scope | Free report customization with purchase. Customization includes:-
|
To get a free trial access to our platform which is a one stop solution for all your data requirements for quicker decision making. This platform allows you to compare markets, competitors who are prominent in the market, and mega trends that are influencing the dynamics in the market. Also, get access to detailed SkyQuest exclusive matrix.
Table Of Content
Executive Summary
Market overview
Parent Market Analysis
Market overview
Market size
KEY MARKET INSIGHTS
COVID IMPACT
MARKET DYNAMICS & OUTLOOK
Market Size by Region
KEY COMPANY PROFILES
Methodology
For the Tensiometer Market, our research methodology involved a mixture of primary and secondary data sources. Key steps involved in the research process are listed below:
1. Information Procurement: This stage involved the procurement of Market data or related information via primary and secondary sources. The various secondary sources used included various company websites, annual reports, trade databases, and paid databases such as Hoover's, Bloomberg Business, Factiva, and Avention. Our team did 45 primary interactions Globally which included several stakeholders such as manufacturers, customers, key opinion leaders, etc. Overall, information procurement was one of the most extensive stages in our research process.
2. Information Analysis: This step involved triangulation of data through bottom-up and top-down approaches to estimate and validate the total size and future estimate of the Tensiometer Market.
3. Report Formulation: The final step entailed the placement of data points in appropriate Market spaces in an attempt to deduce viable conclusions.
4. Validation & Publishing: Validation is the most important step in the process. Validation & re-validation via an intricately designed process helped us finalize data points to be used for final calculations. The final Market estimates and forecasts were then aligned and sent to our panel of industry experts for validation of data. Once the validation was done the report was sent to our Quality Assurance team to ensure adherence to style guides, consistency & design.
Analyst Support
Customization Options
With the given market data, our dedicated team of analysts can offer you the following customization options are available for the Tensiometer Market:
Product Analysis: Product matrix, which offers a detailed comparison of the product portfolio of companies.
Regional Analysis: Further analysis of the Tensiometer Market for additional countries.
Competitive Analysis: Detailed analysis and profiling of additional Market players & comparative analysis of competitive products.
Go to Market Strategy: Find the high-growth channels to invest your marketing efforts and increase your customer base.
Innovation Mapping: Identify racial solutions and innovation, connected to deep ecosystems of innovators, start-ups, academics, and strategic partners.
Category Intelligence: Customized intelligence that is relevant to their supply Markets will enable them to make smarter sourcing decisions and improve their category management.
Public Company Transcript Analysis: To improve the investment performance by generating new alpha and making better-informed decisions.
Social Media Listening: To analyze the conversations and trends happening not just around your brand, but around your industry as a whole, and use those insights to make better Marketing decisions.
REQUEST FOR SAMPLE
 REQUEST FREE CUSTOMIZATION
Global Tensiometer Market size was valued at USD 169.8 Million in 2024 and is poised to grow from USD 179.82 Million in 2025 to USD 284.45 Million by 2033, growing at a CAGR of 5.9% during the forecast period (2026-2033).
The competitive landscape for global tensiometers is driven by rapid product innovation, automation and integration with digital workflows, prompting targeted partnerships and co-development deals rather than broad-brush growth claims. Incumbents are adding modular optical upgrades and dosing accessories while specialist startups commercialize microdosing hardware and plant-embedded sensors to capture continuous measurements, exemplified by DataPhysics’ collaboration with droptical and recent Attension product updates. 'AMETEK', 'Bruker Corporation', 'AddLife AB', 'KRÜSS GmbH', 'Kyowa Interface Science', 'Apex Instruments', 'CSC Scientific Company', 'Surface Electro Optics (SEO)', 'Sinterface Technologies', 'Kibron', 'Holmarc Opto-Mechatronics', 'LAUDA Group', 'Antylia Scientific', 'Hans Schmidt & Co.', 'Adam Equipment', 'Shanghai Zhongchen Digital Technic Apparatus', 'Jinan Kason Testing Equipment', 'Labthink Instruments', 'Photon Systems Instruments (PSI)', 'Royal Eijkelkamp'
Industry expansion in oil and gas increases demand for tensiometers because these instruments provide essential measurements of interfacial and surface tension that inform reservoir characterization and fluid behavior during extraction operations. Their ability to support monitoring of fluid interactions and optimize enhanced recovery practices encourages adoption by operators seeking improved process control and predictable performance. As exploration and production activities prioritize tools that reduce uncertainty in fluid handling and treatment, tensiometers become integral to decision making and operational workflows, thereby driving market growth through consistent instrument procurement.
Digital Integration And Connectivity: The tensiometer market is shifting toward devices with embedded connectivity and software-led workflows, enabling remote monitoring, cloud-based data storage, and integration with factory systems. Vendors emphasize user-friendly interfaces, API compatibility, and analytics capabilities that support process optimization and traceability. This trend spurs demand for modular products and service contracts, fosters partnerships between instrument manufacturers and software firms, and elevates expectations for lifecycle support, secure data handling, and seamless interoperability across production and quality ecosystems.
Why does North America Dominate the Global Tensiometer Market? |@12


Want to customize this report? This report can be personalized according to your needs. Our analysts and industry experts will work directly with you to understand your requirements and provide you with customized data in a short amount of time. We offer $1000 worth of FREE customization at the time of purchase.
Feedback From Our Clients


 USA (+1) 351-333-4748

