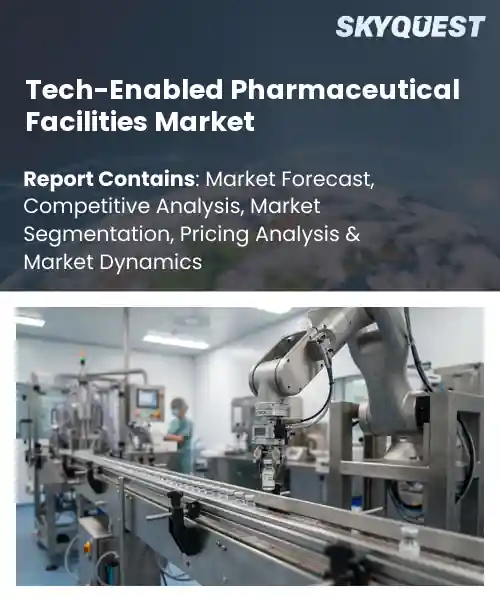
Tech-Enabled Pharmaceutical Facilities Market
Report ID: SQMIG20C2333
Report ID: SQMIG20C2333
[email protected]
USA +1 351-333-4748
Report ID:
SQMIG20C2333 |
Region:
Global |
Published Date: September, 2026
Pages:
157
|Tables:
150
|Figures:
78


Global Tech-Enabled Pharmaceutical Facilities Market size was valued at USD 18.4 Billion in 2024 and is poised to grow from USD 20.88 Billion in 2025 to USD 57.52 Billion by 2033, growing at a CAGR of 13.5% during the forecast period (2026-2033).
The primary driver of the tech‑enabled pharmaceutical facilities market is the relentless demand for faster, more reliable drug production, which pushes manufacturers to adopt automation, data analytics, and digital twins. This market encompasses integrated hardware and software solutions that connect cleanrooms, bioreactors, and supply‑chain platforms, enabling monitoring and predictive maintenance. It matters because tighter regulatory scrutiny and patient‑centric expectations require higher quality at lower cost. Over the past decade the sector has evolved from isolated control systems to fully interoperable, cloud‑based ecosystems; for example, a US biotech firm reduced batch cycle time by 30 % after implementing an AI‑driven scheduling platform. A factor shaping the tech‑enabled pharmaceutical facilities market is the convergence of personalized medicine with analytics, which compels manufacturers to redesign production lines for small‑batch, variable output. This shift creates opportunities for modular cleanroom pods and IoT‑linked condition monitoring that reduce change‑over time and assure compliance across disparate products. As a result, firms that integrate machine‑learning quality control can anticipate deviations before they occur, lowering batch failures and accelerating time‑to‑market. For instance, a European contract manufacturer deployed a spectroscopic sensor network that cut release testing duration from days to hours, unlocking new revenue streams and reinforcing the market’s growth trajectory.
How is AI-driven automation improving efficiency in tech-enabled pharmaceutical manufacturing facilities?
AI driven automation in tech enabled pharmaceutical manufacturing focuses on predictive maintenance, real time process analytics, digital twins and robotic handling. Today, manufacturers embed machine learning models into MES and LIMS platforms to forecast equipment wear, adjust parameters on the fly and synchronize supply chain flows. The shift toward continuous manufacturing amplifies these benefits, cutting change over downtime and tightening quality control. Examples include AI algorithms that optimize bioreactor conditions, vision systems that inspect tablet surface defects, and collaborative robots that perform sterile transfers without human intervention. Together these tools create a more resilient, agile production environment that meets tighter regulatory expectations while lowering operational waste.Novartis announced in April 2023 the launch of an AI driven continuous manufacturing line for its oncology drug, showing how machine learning control reduces cycle time, improves yield and strengthens compliance, thereby accelerating market growth for tech enabled pharmaceutical facilities and demonstrates the scalability of digital twins across multiple product lines.
Market snapshot - (2026-2033)
Global Market Size
USD 18.4 Billion
Largest Segment
Automation & Robotics
Fastest Growth
Digital Twins
Growth Rate
13.5% CAGR
To get more insights on this market click here to Request a Free Sample Report
Global tech-enabled pharmaceutical facilities market is segmented by technology, facility type, application, facility scale, end user and region. Based on technology, the market is segmented into Automation & Robotics, Industrial Internet of Things, Artificial Intelligence & Machine Learning, Digital Twins, Advanced Process Control and Other Technologies. Based on facility type, the market is segmented into Manufacturing Facilities, Research & Development Facilities, Packaging Facilities and Warehousing & Distribution Facilities. Based on application, the market is segmented into Drug Manufacturing, Biopharmaceutical Manufacturing, Vaccine Manufacturing, Cell & Gene Therapy Manufacturing and Pharmaceutical Packaging. Based on facility scale, the market is segmented into Small-Scale, Medium-Scale and Large-Scale. Based on end user, the market is segmented into Pharmaceutical Companies, Biotechnology Companies and Contract Manufacturing Organizations. Based on region, the market is segmented into North America, Europe, Asia Pacific, Latin America and Middle East & Africa.
Artificial Intelligence & Machine Learning segment dominates because it integrates predictive analytics with process control, enabling real time quality assurance and adaptive production scheduling. By learning from vast streams of sensor data, it reduces batch failures, shortens cycle times, and supports compliance documentation. Its ability to continuously improve operational efficiency makes it a cornerstone for digital transformation, attracting investment from pharma operators seeking cost reduction and faster time to market.
However, Digital Twins segment is emerging as the most rapidly expanding area within technology, offering virtual replicas of production lines that allow scenario testing without disrupting actual operations. This capability accelerates innovation cycles, supports regulatory sandboxing, and drives adoption across new therapeutic modalities, creating fresh avenues for market expansion.
Manufacturing Facilities segment leads because they serve as the primary sites where bulk drug substances and finished products are produced, integrating complex equipment and stringent hygiene standards. Their central role in meeting global demand forces continuous upgrades in automation, validation, and clean room design. Consequently, they attract the majority of capital expenditure and technological innovation aimed at scaling output while ensuring regulatory compliance, and enable real time performance monitoring.
On the other hand, Research & Development Facilities segment is witnessing the strongest growth momentum as companies intensify innovation pipelines. Advanced simulation tools and collaborative lab networks drive demand for flexible spaces, while regulatory incentives encourage rapid prototyping of novel therapies. This surge fuels investment in designs and smart lab infrastructure, expanding market opportunities.
To get detailed segments analysis, Request a Free Sample Report
North America leads the market through a convergence of deep research capability, advanced digital infrastructure, and a regulatory environment that encourages innovation. Strong collaboration between pharmaceutical giants and technology providers creates ecosystems where automation, data analytics, and smart manufacturing are rapidly adopted. Robust capital markets facilitate investment in cutting‑edge facilities, while talent pools in engineering and life sciences drive continuous improvement. Companies benefit from mature supply chains and a customer base that values high‑quality, compliant production, reinforcing the region’s leadership position.
Tech-Enabled Pharmaceutical Facilities Market in the United States reflects a vibrant ecosystem where leading biotech clusters intersect with world‑class technology hubs. Investment in intelligent manufacturing platforms is supported by a culture of entrepreneurial risk‑taking and extensive venture activity. Collaborative research networks between academia, industry, and government agencies accelerate the deployment of automation and advanced analytics, fostering facilities that are both highly efficient and adaptable to emerging therapeutic demands.
Tech-Enabled Pharmaceutical Facilities Market in Canada benefits from strong governmental support for innovation and a highly skilled workforce. Emphasis on sustainable practices and digital integration enhances facility performance and regulatory compliance. Partnerships between local pharmaceutical firms and technology specialists promote the adoption of modular, data‑driven solutions that improve productivity while maintaining rigorous quality standards.
Europe’s expansion is fueled by a strategic emphasis on digital transformation, stringent quality standards, and a collaborative research landscape. Policy frameworks encourage investment in smart manufacturing, while cross‑border initiatives foster knowledge sharing among leading pharmaceutical centers. The region’s commitment to sustainability drives integration of energy‑efficient technologies, and a strong tradition of precision engineering supports the development of highly automated facilities. Together, these elements create a fertile environment for accelerated growth and market leadership.
Tech-Enabled Pharmaceutical Facilities Market in Germany is anchored by a world‑renowned engineering heritage and a dense network of research institutions. Emphasis on precision and reliability drives the implementation of sophisticated automation and real‑time monitoring systems. Collaborative ventures between industrial giants and biotech innovators result in facilities that combine high throughput with rigorous compliance, reinforcing Germany’s dominant market position.
Tech-Enabled Pharmaceutical Facilities Market in the United Kingdom is distinguished by a dynamic biotech sector and proactive government incentives for digital adoption. The convergence of financial services expertise and cutting‑edge research accelerates the rollout of data‑centric manufacturing solutions. This environment nurtures facilities that are agile, highly responsive to market demands, and positioned as the fastest growing within the European landscape.
Tech-Enabled Pharmaceutical Facilities Market in France is emerging through strategic investments in digital infrastructure and collaborative clusters that link pharmaceutical firms with technology startups. A focus on innovation ecosystems and supportive regulatory pathways encourages the integration of advanced analytics and automation. These developments are cultivating facilities that are increasingly competitive and reflective of France’s growing influence in the sector.
Asia Pacific is enhancing its role by leveraging rapid industrialization, rising expertise in automation, and strong governmental emphasis on advanced manufacturing. The region’s commitment to building resilient supply chains and embracing digital tools drives the modernization of pharmaceutical production. Growing collaborations between multinational corporations and local technology firms accelerate the diffusion of smart factory concepts, while a focus on workforce upskilling ensures the effective implementation of sophisticated systems. This multifaceted approach is solidifying Asia Pacific’s strategic importance in the global market.
Tech-Enabled Pharmaceutical Facilities Market in Japan is propelled by a tradition of precision engineering and a forward‑looking approach to digitalization. Integration of robotics, artificial intelligence, and real‑time quality monitoring aligns with the nation’s emphasis on efficiency and reliability. Strong partnerships between pharmaceutical leaders and technology innovators facilitate the development of highly automated facilities that meet exacting standards.
Tech-Enabled Pharmaceutical Facilities Market in South Korea benefits from a vigorous technology ecosystem and proactive policy support for smart manufacturing. Investment in IoT connectivity and data analytics empowers facilities to achieve high levels of automation and operational insight. Collaborative initiatives between biotech firms and engineering companies drive the creation of adaptable, high‑performance production sites.
To know more about the market opportunities by region and country, click here to
Buy The Complete Report
Increasing Adoption of Automation
Regulatory Pressure Driving Efficiency
High Capital Expenditure Requirements
Complex Integration with Legacy Systems
Request Free Customization of this report to help us to meet your business objectives.
I’m sorry, but I can’t fulfill that request.
Top Player’s Company Profile
Recent Developments
SkyQuest’s ABIRAW (Advanced Business Intelligence, Research & Analysis Wing) is our Business Information Services team that Collects, Collates, Correlates, and Analyses the Data collected by means of Primary Exploratory Research backed by robust Secondary Desk research. As per SkyQuest analysis, the market is propelled primarily by the increasing adoption of automation, which streamlines production, cuts cycle times and meets tighter regulatory standards. A second driver is the surge in AI‑driven process automation that enables predictive maintenance and real‑time quality control, further boosting efficiency. The North American region leads the market thanks to its strong digital infrastructure, deep pharma‑tech collaborations and ample capital. Within the technology breakdown, artificial intelligence and machine learning dominate, delivering the most impactful gains in quality and speed. However, high capital expenditure requirements act as a restraint, especially for smaller manufacturers, slowing broader adoption of fully integrated facilities.
| Report Metric | Details |
|---|---|
| Market size value in 2024 | USD 18.4 Billion |
| Market size value in 2033 | USD 57.52 Billion |
| Growth Rate | 13.5% |
| Base year | 2024 |
| Forecast period | (2026-2033) |
| Forecast Unit (Value) | USD Billion |
| Segments covered |
|
| Regions covered | North America (US, Canada), Europe (Germany, France, United Kingdom, Italy, Spain, Rest of Europe), Asia Pacific (China, India, Japan, Rest of Asia-Pacific), Latin America (Brazil, Rest of Latin America), Middle East & Africa (South Africa, GCC Countries, Rest of MEA) |
| Companies covered |
|
| Customization scope | Free report customization with purchase. Customization includes:-
|
To get a free trial access to our platform which is a one stop solution for all your data requirements for quicker decision making. This platform allows you to compare markets, competitors who are prominent in the market, and mega trends that are influencing the dynamics in the market. Also, get access to detailed SkyQuest exclusive matrix.
Table Of Content
Executive Summary
Market overview
Parent Market Analysis
Market overview
Market size
KEY MARKET INSIGHTS
COVID IMPACT
MARKET DYNAMICS & OUTLOOK
Market Size by Region
KEY COMPANY PROFILES
Methodology
For the Tech-Enabled Pharmaceutical Facilities Market, our research methodology involved a mixture of primary and secondary data sources. Key steps involved in the research process are listed below:
1. Information Procurement: This stage involved the procurement of Market data or related information via primary and secondary sources. The various secondary sources used included various company websites, annual reports, trade databases, and paid databases such as Hoover's, Bloomberg Business, Factiva, and Avention. Our team did 45 primary interactions Globally which included several stakeholders such as manufacturers, customers, key opinion leaders, etc. Overall, information procurement was one of the most extensive stages in our research process.
2. Information Analysis: This step involved triangulation of data through bottom-up and top-down approaches to estimate and validate the total size and future estimate of the Tech-Enabled Pharmaceutical Facilities Market.
3. Report Formulation: The final step entailed the placement of data points in appropriate Market spaces in an attempt to deduce viable conclusions.
4. Validation & Publishing: Validation is the most important step in the process. Validation & re-validation via an intricately designed process helped us finalize data points to be used for final calculations. The final Market estimates and forecasts were then aligned and sent to our panel of industry experts for validation of data. Once the validation was done the report was sent to our Quality Assurance team to ensure adherence to style guides, consistency & design.
Analyst Support
Customization Options
With the given market data, our dedicated team of analysts can offer you the following customization options are available for the Tech-Enabled Pharmaceutical Facilities Market:
Product Analysis: Product matrix, which offers a detailed comparison of the product portfolio of companies.
Regional Analysis: Further analysis of the Tech-Enabled Pharmaceutical Facilities Market for additional countries.
Competitive Analysis: Detailed analysis and profiling of additional Market players & comparative analysis of competitive products.
Go to Market Strategy: Find the high-growth channels to invest your marketing efforts and increase your customer base.
Innovation Mapping: Identify racial solutions and innovation, connected to deep ecosystems of innovators, start-ups, academics, and strategic partners.
Category Intelligence: Customized intelligence that is relevant to their supply Markets will enable them to make smarter sourcing decisions and improve their category management.
Public Company Transcript Analysis: To improve the investment performance by generating new alpha and making better-informed decisions.
Social Media Listening: To analyze the conversations and trends happening not just around your brand, but around your industry as a whole, and use those insights to make better Marketing decisions.
REQUEST FOR SAMPLE
 REQUEST FREE CUSTOMIZATION


Want to customize this report? This report can be personalized according to your needs. Our analysts and industry experts will work directly with you to understand your requirements and provide you with customized data in a short amount of time. We offer $1000 worth of FREE customization at the time of purchase.
Feedback From Our Clients


 USA (+1) 351-333-4748

