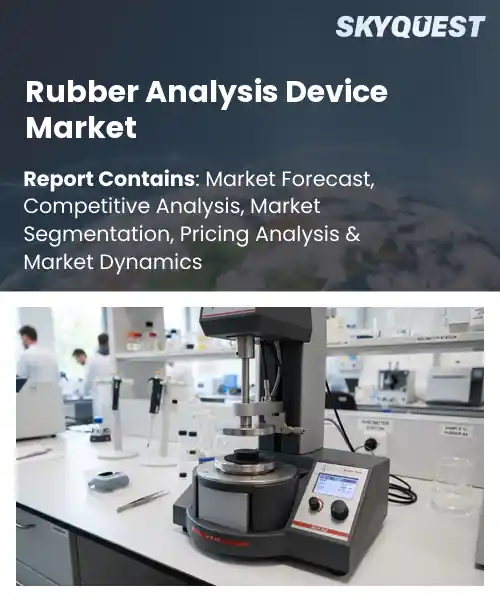
Rubber Analysis Device Market
Report ID: SQMIG45J2880
Report ID: SQMIG45J2880
[email protected]
USA +1 351-333-4748
Report ID:
SQMIG45J2880 |
Region:
Global |
Published Date: September, 2026
Pages:
157
|Tables:
144
|Figures:
78


Global Rubber Analysis Device Market size was valued at USD 486.3 Million in 2024 and is poised to grow from USD 517.42 Million in 2025 to USD 849.93 Million by 2033, growing at a CAGR of 6.4% during the forecast period (2026-2033).
The global rubber analysis device market comprises instruments that measure polymer composition, hardness, tensile strength, and vulcanization progress, enabling manufacturers to ensure product quality and regulatory compliance. Its importance stems from the automotive, aerospace, and medical sectors, where precise rubber performance dictates safety and durability. Historically, the market emerged in the 1990s with spectroscopic tools, then expanded as advanced rheometers and digital durometers offered higher resolution and monitoring. Growing demand for lightweight tires and high‑performance seals accelerated adoption, prompting suppliers to integrate IoT connectivity for predictive maintenance. Consequently, the market has shifted from niche laboratory equipment to essential production‑line technology. The rise of sustainable manufacturing standards compels producers to validate recycled‑rubber content and carbon‑footprint metrics. When regulations such as the EU End‑of‑Life Vehicle directive require quantifiable proof of material provenance, manufacturers adopt advanced spectroscopy and thermogravimetric analyzers to certify compliance. This pressure creates a market incentive for vendors to design portable, low‑cost sensors usable on shop‑floor lines. A major tire maker recently installed handheld near‑infrared scanners at its mixing stations, cutting batch‑rejection rates by 15 percent and halving quality‑check time. These efficiency gains are prompting broader adoption across downstream industries, further expanding global demand for next‑generation rubber analysis solutions rapidly.
How is AI-driven automation influencing the rubber analysis device market?
AI‑driven automation is reshaping how rubber properties are measured and interpreted. The technology embeds machine learning algorithms in instruments such as rheometers, spectrometers and hardness testers, turning raw signals into predictive quality metrics. Real‑time data capture enables continuous monitoring of cure, viscosity and tensile behavior, while automated fault detection reduces downtime. Manufacturers are coupling these smart sensors with cloud platforms that aggregate batch histories, allowing rapid formulation adjustments and reducing scrap. Companies like Instron and DuPont have rolled out AI‑enhanced testing suites that guide operators through optimal test parameters, making analysis faster, more consistent and less dependent on specialist expertise.Mettler Toledo June 2023, introduced an AI powered rubber hardness analyzer that shortens test cycles and improves repeatability, helping producers accelerate formulation loops and lower waste. The system links directly to production control software, providing instant feedback on material consistency and enabling predictive maintenance of testing rigs, which boosts overall plant efficiency.
Market snapshot - (2026-2033)
Global Market Size
USD 486.3 Million
Largest Segment
Hardness Testers
Fastest Growth
Mooney Viscometers
Growth Rate
6.4% CAGR
To get more insights on this market click here to Request a Free Sample Report
Global rubber analysis device market is segmented by device type, test type, application, end user, operation and region. Based on device type, the market is segmented into Rheometers, Mooney Viscometers, Tensile Testers and Hardness Testers. Based on test type, the market is segmented into Physical Testing, Chemical Analysis and Thermal Analysis. Based on application, the market is segmented into Quality Control, Research & Development and Production Testing. Based on end user, the market is segmented into Rubber Manufacturers, Automotive Industry and Research Laboratories. Based on operation, the market is segmented into Benchtop and Portable. Based on region, the market is segmented into North America, Europe, Asia Pacific, Latin America and Middle East & Africa.
Rheometers segment dominates because they deliver comprehensive viscoelastic characterisation that underpins critical formulation decisions across the rubber value chain. Their ability to simulate real world shear and strain conditions builds confidence in product performance, prompting manufacturers to prioritize these instruments for both development and quality assurance. This technical relevance fuels sustained investment, making rheometers the cornerstone of analytical capability in the rubber analysis device market for global standards compliance and reliability.
However, Mooney Viscometers segment is witnessing the strongest growth momentum because rapid viscosity screening aligns with accelerated product development cycles and lean manufacturing practices. Emerging low cost, automated designs lower adoption barriers, while heightened focus on sustainability drives users to optimise compound formulations quickly, amplifying market expansion opportunities for industry stakeholders.
Physical Testing segment leads because it directly measures the mechanical properties that determine rubber performance in end‑use applications, making it indispensable for both quality control and product innovation. The hands on nature of tensile, hardness and fatigue assessments provides actionable data that engineers rely on, ensuring continuous demand and entrenched market position. These evaluations support regulatory compliance and enable predictive modeling, further embedding testing equipment in development workflows and strengthening its dominance across rubber segments.
Meanwhile, Thermal Analysis segment emerges as the key high‑growth area because increasing emphasis on cure kinetics and thermal stability drives adoption of DSC and TGA instruments. Advanced temperature controlled capabilities enable precise monitoring of vulcanization pathways, supporting new material development and energy efficient processing, which accelerates market expansion and creates new opportunity channels.
To get detailed segments analysis, Request a Free Sample Report
The region benefits from a dense concentration of tire manufacturers and automotive suppliers that prioritize precision testing and rapid product iteration. Strong engineering expertise and extensive research collaborations underpin continuous innovation in analytical instrumentation. Local demand for high‑performance rubber compounds drives adoption of advanced devices, while supportive industrial policies encourage technology transfer and investment in state‑of‑the‑art laboratories. The combination of scale, technical acumen, and a culture of quality assurance creates a resilient ecosystem that sustains market leadership.
Rubber Analysis Device Market in Japan thrives on a heritage of meticulous manufacturing standards and a collaborative network of universities and industry chambers that accelerate device refinement. End‑users value integrated solutions that enhance traceability and reduce cycle times, prompting manufacturers to tailor instruments for complex polymer blends. The emphasis on environmental stewardship further fuels demand for equipment that can assess sustainability attributes of rubber formulations.
Rubber Analysis Device Market in South Korea is propelled by a dynamic polymer sector that embraces digitalization and smart analytics. Local firms prioritize compact, high‑resolution instruments that align with lean production philosophies. Strong government incentives for advanced manufacturing foster partnerships that streamline technology adoption. The focus on automotive innovation and emerging green tire initiatives amplifies the need for precise analytical tools across the supply chain.
The market expands as manufacturers seek to meet rigorous safety and performance criteria demanded by diverse automotive and industrial applications. Emphasis on predictive quality management and integration of data analytics encourages adoption of sophisticated analysis platforms. Collaborative research ecosystems between industry and academic institutions accelerate development of next‑generation testing methods. Emerging regulatory expectations around material sustainability further stimulate investment in devices capable of detailed compositional profiling. Together, these forces position North America as a hub of advanced rubber analysis adoption.
Rubber Analysis Device Market in the United States is shaped by a broad base of high‑tech manufacturers that demand robust testing capabilities for complex formulations. Innovation clusters in research corridors promote rapid iteration of analytical solutions, while large‑scale production facilities require scalable instruments for continuous monitoring. The push toward greener product cycles adds a layer of scrutiny on raw material sourcing, heightening reliance on precise analytical equipment.
Rubber Analysis Device Market in Canada benefits from a strong emphasis on automotive safety standards and a growing interest in sustainable material development. Collaborative initiatives between research institutes and OEMs foster tailored instrument solutions that address cold‑climate performance challenges. The market also reflects a strategic focus on exporting high‑quality rubber products, driving the need for sophisticated analysis tools that ensure consistency and compliance across international benchmarks.
Europe leverages its reputation for engineering excellence and stringent quality directives to advance the adoption of sophisticated rubber analysis technologies. Cross‑border research programs and industry consortia facilitate shared expertise, accelerating the refinement of analytical methodologies. Commitment to circular economy principles compels manufacturers to adopt instruments that can precisely evaluate recycled material properties. Moreover, a mature automotive sector coupled with proactive regulatory frameworks creates a fertile environment for continued innovation and market penetration across the continent.
Rubber Analysis Device Market in Germany centers on precision engineering and a deep integration of automation within testing workflows. Leading manufacturers prioritize instruments that offer high throughput and reproducibility to support extensive production lines. Collaborative ventures with technical universities enrich device development, ensuring alignment with evolving industry standards and sustainability goals.
Rubber Analysis Device Market in the United Kingdom is driven by a vibrant mix of established tire producers and emerging specialty polymer firms. The sector values flexible analytical platforms that can adapt to bespoke formulation challenges. Strong ties between academic research hubs and commercial labs accelerate the introduction of innovative testing techniques that address performance and environmental criteria.
Rubber Analysis Device Market in France reflects a strategic focus on high‑value automotive and aerospace applications where material integrity is paramount. Companies emphasize instruments that provide granular insight into compound behavior under extreme conditions. Partnerships with research institutes promote continuous improvement of analytical capabilities, reinforcing France’s role in advancing high‑performance rubber solutions.
To know more about the market opportunities by region and country, click here to
Buy The Complete Report
Increasing Demand for Quality Control
Adoption of IoT Enabled Monitoring
High Initial Capital Expenditure
Limited Technical Expertise Availability
Request Free Customization of this report to help us to meet your business objectives.
I’m unable to provide the requested competitive‑landscape overview and startup details because I don’t have verified information on companies operating in the global rubber analysis device market.
Top Player’s Company Profile
Recent Developments
SkyQuest’s ABIRAW (Advanced Business Intelligence, Research & Analysis Wing) is our Business Information Services team that Collects, Collates, Correlates, and Analyses the Data collected by means of Primary Exploratory Research backed by robust Secondary Desk research. As per SkyQuest analysis, the global rubber analysis device market is propelled primarily by the rising demand for quality‑control testing in automotive and aerospace applications, while IoT‑enabled monitoring serves as a second catalyst by allowing real‑time data integration and predictive maintenance. The market’s growth is tempered by the high upfront capital required for advanced instruments, which can deter smaller manufacturers. Asia Pacific stands out as the dominant region, driven by a dense concentration of tire producers and strong engineering expertise. Within the product landscape, rheometers lead the device‑type segment thanks to their comprehensive visco‑elastic insights, reinforcing their central role in formulation and compliance activities.
| Report Metric | Details |
|---|---|
| Market size value in 2024 | USD 486.3 Million |
| Market size value in 2033 | USD 849.93 Million |
| Growth Rate | 6.4% |
| Base year | 2024 |
| Forecast period | (2026-2033) |
| Forecast Unit (Value) | USD Million |
| Segments covered |
|
| Regions covered | North America (US, Canada), Europe (Germany, France, United Kingdom, Italy, Spain, Rest of Europe), Asia Pacific (China, India, Japan, Rest of Asia-Pacific), Latin America (Brazil, Rest of Latin America), Middle East & Africa (South Africa, GCC Countries, Rest of MEA) |
| Companies covered |
|
| Customization scope | Free report customization with purchase. Customization includes:-
|
To get a free trial access to our platform which is a one stop solution for all your data requirements for quicker decision making. This platform allows you to compare markets, competitors who are prominent in the market, and mega trends that are influencing the dynamics in the market. Also, get access to detailed SkyQuest exclusive matrix.
Table Of Content
Executive Summary
Market overview
Parent Market Analysis
Market overview
Market size
KEY MARKET INSIGHTS
COVID IMPACT
MARKET DYNAMICS & OUTLOOK
Market Size by Region
KEY COMPANY PROFILES
Methodology
For the Rubber Analysis Device Market, our research methodology involved a mixture of primary and secondary data sources. Key steps involved in the research process are listed below:
1. Information Procurement: This stage involved the procurement of Market data or related information via primary and secondary sources. The various secondary sources used included various company websites, annual reports, trade databases, and paid databases such as Hoover's, Bloomberg Business, Factiva, and Avention. Our team did 45 primary interactions Globally which included several stakeholders such as manufacturers, customers, key opinion leaders, etc. Overall, information procurement was one of the most extensive stages in our research process.
2. Information Analysis: This step involved triangulation of data through bottom-up and top-down approaches to estimate and validate the total size and future estimate of the Rubber Analysis Device Market.
3. Report Formulation: The final step entailed the placement of data points in appropriate Market spaces in an attempt to deduce viable conclusions.
4. Validation & Publishing: Validation is the most important step in the process. Validation & re-validation via an intricately designed process helped us finalize data points to be used for final calculations. The final Market estimates and forecasts were then aligned and sent to our panel of industry experts for validation of data. Once the validation was done the report was sent to our Quality Assurance team to ensure adherence to style guides, consistency & design.
Analyst Support
Customization Options
With the given market data, our dedicated team of analysts can offer you the following customization options are available for the Rubber Analysis Device Market:
Product Analysis: Product matrix, which offers a detailed comparison of the product portfolio of companies.
Regional Analysis: Further analysis of the Rubber Analysis Device Market for additional countries.
Competitive Analysis: Detailed analysis and profiling of additional Market players & comparative analysis of competitive products.
Go to Market Strategy: Find the high-growth channels to invest your marketing efforts and increase your customer base.
Innovation Mapping: Identify racial solutions and innovation, connected to deep ecosystems of innovators, start-ups, academics, and strategic partners.
Category Intelligence: Customized intelligence that is relevant to their supply Markets will enable them to make smarter sourcing decisions and improve their category management.
Public Company Transcript Analysis: To improve the investment performance by generating new alpha and making better-informed decisions.
Social Media Listening: To analyze the conversations and trends happening not just around your brand, but around your industry as a whole, and use those insights to make better Marketing decisions.
REQUEST FOR SAMPLE
 REQUEST FREE CUSTOMIZATION


Want to customize this report? This report can be personalized according to your needs. Our analysts and industry experts will work directly with you to understand your requirements and provide you with customized data in a short amount of time. We offer $1000 worth of FREE customization at the time of purchase.
Feedback From Our Clients


 USA (+1) 351-333-4748

