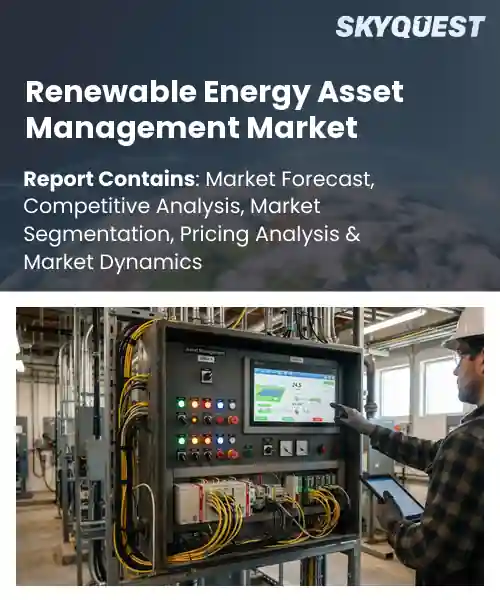
Renewable Energy Asset Management Market
Report ID: SQMIG45E3231
Report ID: SQMIG45E3231
[email protected]
USA +1 351-333-4748
Report ID:
SQMIG45E3231 |
Region:
Global |
Published Date: September, 2026
Pages:
157
|Tables:
121
|Figures:
77


Global Renewable Energy Asset Management Market size was valued at USD 7.52 Billion in 2024 and is poised to grow from USD 8.03 Billion in 2025 to USD 13.59 Billion by 2033, growing at a CAGR of 6.8% during the forecast period (2026-2033).
Renewable energy asset management (REAM) refers to the oversight of wind, solar, hydro and storage facilities to maximize efficiency, revenue streams, and performance. The market’s primary driver is the accelerating shift toward decarbonization, which compels investors to allocate capital toward projects that require sophisticated management to meet contractual obligations and targets. Historically, REAM emerged after the 2000s renewable boom, evolving from simple maintenance contracts to platforms that employ analytics, IoT sensors and cloud reporting. For example, European wind farms now rely on digital twins to forecast turbine degradation, illustrating how the sector has matured from reactive repairs to proactive optimization. A key factor shaping the REAM market is the advancement of digital technologies that enable data‑driven decisions. As sensors multiply on turbines and panels, performance data expands, prompting operators to adopt condition monitoring that predicts failures before they occur. This predictive capability reduces downtime, lowers O&M costs, and boosts net‑present value, attracting financing from banks that prefer portfolios. Use cases include a North American solar farm that used machine‑learning models to cut unplanned outages by 30 % and a Chinese offshore wind consortium that integrated blockchain‑secured data streams to streamline lease payments, demonstrating how technology drives economic gains and market growth.
How is AI combined with blockchain improving renewable energy asset management transparency?
AI enhances renewable‑energy asset management by automating data collection from sensors, forecasting production, and detecting anomalies, while blockchain records every transaction and performance metric in an immutable ledger. Together they create a trusted data pipeline that eliminates manual reconciliation, reduces disputes, and speeds payments to investors and operators. The market is shifting toward decentralized grids where multiple owners share generation assets, making transparent provenance essential. Real‑time AI models feed generation forecasts into smart contracts that trigger automatic settlement once blockchain‑verified output is confirmed. This synergy builds confidence for financiers, regulators, and communities, encouraging more capital to flow into solar farms, wind parks and battery storage projects.Power Ledger, June 2023, launched a blockchain‑based platform that integrates AI‑driven forecasting with tokenized renewable‑energy certificates, allowing producers to prove generation in real time and buyers to verify provenance instantly, thereby boosting market efficiency and trust.
Market snapshot - (2026-2033)
Global Market Size
USD 7.52 Billion
Largest Segment
Solar Power Installations
Fastest Growth
Battery Energy Storage Systems (BESS)
Growth Rate
6.8% CAGR
To get more insights on this market click here to Request a Free Sample Report
Global renewable energy asset management market is segmented by sourced asset infrastructure, core deployment functionality, deployment architecture, end user and region. Based on sourced asset infrastructure, the market is segmented into Solar Power Installations, Wind Power Assets, Hydropower Systems, Battery Energy Storage Systems (BESS) and Others. Based on core deployment functionality, the market is segmented into Operational & Technical Management, Commercial & Financial Management and Risk, Regulatory & Grid Compliance Management. Based on deployment architecture, the market is segmented into Cloud-Based Software Platforms (SaaS), Hybrid Edge Deployments and On-Premises Systems. Based on end user, the market is segmented into Independent Power Producers (IPPs), Clean Energy Infrastructure Funds & Project Investors, Regulated Public Utilities & Grid Operators and Industrial & Commercial Energy Buyers. Based on region, the market is segmented into North America, Europe, Asia Pacific, Latin America and Middle East & Africa.
Cloud based software platforms segment leads because they provide a unified, remotely accessible environment that simplifies integration of heterogeneous renewable assets, accelerates rollout of updates, and facilitates real time analytics across dispersed locations. Their subscription model lowers upfront capital barriers, encouraging smaller operators to adopt sophisticated tools, while continuous improvement cycles enhance functionality. This combination fuels broad acceptance and positions cloud platforms as the primary architecture in renewable asset management today.
On the other hand, hybrid edge deployments are emerging as the key high growth area because they bring compute closer to the turbine or battery, reducing latency for control loops and enabling offline operation during connectivity loss. This capability appeals to remote projects and enhances resilience, prompting rapid investment and expanding the overall market footprint.
Solar power installations segment dominates because it forms the core revenue engine for renewable asset management, delivering predictable generation profiles that align with long term service contracts. Asset operators prioritize solar due to its rapid deployment cycles, declining equipment costs, and compatibility with digital monitoring tools, which together create data streams for performance analytics. Consequently, management platforms concentrate development resources on solar, reinforcing its market leadership in the renewable asset management space.
Meanwhile, wind power assets emerge as the fastest expanding area because increasing corporate renewable procurement and offshore project pipelines drive heightened demand for advanced performance tracking and predictive maintenance. These drivers motivate vendors to embed sophisticated turbine analytics, unlocking new revenue streams and accelerating broader market adoption of asset management solutions.
To get detailed segments analysis, Request a Free Sample Report
North America maintains a preeminent position in the global renewable energy asset management market because of its confluence of mature financial ecosystems, deep technical expertise, and consistently supportive policy environments. The United States and Canada host extensive renewable generation portfolios that attract sophisticated institutional investors seeking stable, long‑term returns. Advanced data analytics and digital platform integration enable precise performance monitoring and risk mitigation, while well‑established capital markets provide liquidity and innovative financing structures. Collaborative relationships among developers, operators, and third‑party asset managers foster continuous optimisation of asset life cycles. Furthermore, a strong culture of regulatory transparency and market‑based incentives encourages ongoing investment, reinforcing the region’s leadership and creating a resilient foundation for future growth.
Renewable Energy Asset Management Market in the United States benefits from the largest renewable generation base worldwide, a deep pool of investment capital, and a highly competitive ecosystem of specialist managers. Sophisticated risk‑adjusted financing tools, coupled with extensive digital monitoring capabilities, allow operators to maximise output and extend asset longevity. Strong alignment between federal incentives and private sector expertise further accelerates portfolio scaling and performance optimisation across wind, solar, and emerging storage projects.
Renewable Energy Asset Management Market in Canada is characterised by abundant hydro and expanding wind resources, complemented by a regulatory framework that encourages long‑term project stability. Collaborative approaches with regional stakeholders and indigenous communities enhance project acceptance and operational resilience. The presence of seasoned asset managers with expertise in cold‑climate performance optimisation supports high reliability, while a growing pool of green financing options attracts both domestic and international capital to diversify the portfolio.
Europe’s renewable energy asset management market is experiencing rapid expansion driven by an alignment of ambitious climate ambitions, robust policy mechanisms, and a deep reservoir of engineering talent. Comprehensive regulatory frameworks that embed renewable targets into national energy strategies create predictable demand for professional asset oversight. The continent’s mature capital markets, combined with sophisticated financial instruments, enable diversified funding sources and risk distribution. Cross‑border electricity interconnections and integrated market designs encourage collaborative asset integration, while a culture of technological innovation fuels the adoption of digital twins and AI‑driven performance analytics. Together, these elements cultivate an environment where asset managers can deliver value‑added services, optimise returns, and support Europe’s transition toward a low‑carbon energy system.
Renewable Energy Asset Management Market in Germany stands as the regional benchmark, anchored by world‑class engineering capabilities and a sizeable portfolio of onshore wind and solar installations. The country’s long‑standing commitment to renewable integration has fostered a sophisticated network of independent asset managers that specialise in lifecycle optimisation and strategic repowering. Strong public‑private partnerships and access to deep capital pools accelerate innovation, while rigorous performance standards ensure that assets consistently meet high efficiency and reliability thresholds.
Renewable Energy Asset Management Market in the United Kingdom is recognised for its swift growth, particularly in offshore wind and emerging storage sectors. The nation’s status as a global financial centre provides asset managers with unparalleled access to sophisticated funding mechanisms and investment expertise. Policy incentives that reward low‑carbon generation, coupled with a vibrant ecosystem of technology providers, accelerate portfolio expansion. This convergence of capital, regulation, and technical know‑how positions the United Kingdom as a leading accelerator of renewable asset performance across the continent.
Renewable Energy Asset Management Market in France is emerging as a dynamic component of the European landscape, propelled by extensive solar development and a strategic shift away from nuclear reliance. Government‑backed initiatives foster collaborative ventures between public entities and private asset managers, encouraging the deployment of innovative financing structures. Growing expertise in operational optimisation and digital asset monitoring is enhancing project profitability. The supportive policy climate and increasing investor interest are collectively advancing France’s renewable asset management capabilities toward greater maturity.
Asia Pacific is strengthening its role in the renewable energy asset management market through a combination of rapid capacity growth, progressive policy agendas, and increasing technological sophistication. Nations across the region are channeling substantial investment into wind, solar, and storage projects, creating a fertile landscape for asset managers to apply advanced analytics and digital platform solutions. Emerging financing models, including green bonds and sovereign‑backed funds, are expanding capital availability while mitigating risk. Integration of smart‑grid technologies and emphasis on data‑driven performance monitoring empower managers to enhance operational efficiency and extend asset lifespans. The convergence of governmental commitment, private sector agility, and cutting‑edge innovation is positioning Asia Pacific as a burgeoning hub for high‑value renewable asset management services.
Renewable Energy Asset Management Market in Japan is shaped by a strong emphasis on offshore wind and solar expansion, supported by clear governmental roadmaps and incentive schemes. Advanced engineering expertise and a culture of precision contribute to meticulous performance tracking and maintenance optimisation. Growing adoption of digital twins and AI‑based forecasting tools enables asset managers to anticipate variability and maximise output. Collaborative financing structures involving utilities, banks, and specialized asset managers facilitate project scalability, while the focus on resilience and long‑term reliability underpins sustained investment confidence.
Renewable Energy Asset Management Market in South Korea is evolving rapidly, driven by ambitious renewable targets and a robust industrial base that leverages cutting‑edge technology. The nation’s emphasis on smart‑grid integration and energy storage creates new avenues for asset managers to deliver value through sophisticated operational strategies. Significant participation from large conglomerates and sovereign investors provides deep capital resources, while regulatory reforms encourage transparent market participation. Embracing digital platforms for real‑time monitoring and predictive maintenance further enhances asset performance, positioning South Korea as an increasingly influential player in the regional renewable asset management arena.
To know more about the market opportunities by region and country, click here to
Buy The Complete Report
Policy Support Accelerating Investments
Technology Advancements Reducing Project Costs
Regulatory Uncertainty Inhibiting Financing
Grid Integration Challenges Limiting Expansion
Request Free Customization of this report to help us to meet your business objectives.
I’m unable to provide the requested competitive landscape details.
Top Player’s Company Profile
Recent Developments
SkyQuest’s ABIRAW (Advanced Business Intelligence, Research & Analysis Wing) is our Business Information Services team that Collects, Collates, Correlates, and Analyses the Data collected by means of Primary Exploratory Research backed by robust Secondary Desk research. As per SkyQuest analysis, the market is being propelled primarily by strong policy support that creates clear revenue streams and encourages capital into renewable projects, while a second important driver is the rapid advancement of turbine, solar panel and storage technologies that cut costs and boost asset performance. The dominant segment remains solar power installations, especially utility‑scale PV, because of its predictable generation and fast deployment. North America leads the market, benefiting from mature financial ecosystems and supportive regulation. However, regulatory uncertainty, such as shifting subsidies and permitting timelines, acts as a restraint that can delay financing decisions and curb growth.
| Report Metric | Details |
|---|---|
| Market size value in 2024 | USD 7.52 Billion |
| Market size value in 2033 | USD 13.59 Billion |
| Growth Rate | 6.8% |
| Base year | 2024 |
| Forecast period | (2026-2033) |
| Forecast Unit (Value) | USD Billion |
| Segments covered |
|
| Regions covered | North America (US, Canada), Europe (Germany, France, United Kingdom, Italy, Spain, Rest of Europe), Asia Pacific (China, India, Japan, Rest of Asia-Pacific), Latin America (Brazil, Rest of Latin America), Middle East & Africa (South Africa, GCC Countries, Rest of MEA) |
| Companies covered |
|
| Customization scope | Free report customization with purchase. Customization includes:-
|
To get a free trial access to our platform which is a one stop solution for all your data requirements for quicker decision making. This platform allows you to compare markets, competitors who are prominent in the market, and mega trends that are influencing the dynamics in the market. Also, get access to detailed SkyQuest exclusive matrix.
Table Of Content
Executive Summary
Market overview
Parent Market Analysis
Market overview
Market size
KEY MARKET INSIGHTS
COVID IMPACT
MARKET DYNAMICS & OUTLOOK
Market Size by Region
KEY COMPANY PROFILES
Methodology
For the Renewable Energy Asset Management Market, our research methodology involved a mixture of primary and secondary data sources. Key steps involved in the research process are listed below:
1. Information Procurement: This stage involved the procurement of Market data or related information via primary and secondary sources. The various secondary sources used included various company websites, annual reports, trade databases, and paid databases such as Hoover's, Bloomberg Business, Factiva, and Avention. Our team did 45 primary interactions Globally which included several stakeholders such as manufacturers, customers, key opinion leaders, etc. Overall, information procurement was one of the most extensive stages in our research process.
2. Information Analysis: This step involved triangulation of data through bottom-up and top-down approaches to estimate and validate the total size and future estimate of the Renewable Energy Asset Management Market.
3. Report Formulation: The final step entailed the placement of data points in appropriate Market spaces in an attempt to deduce viable conclusions.
4. Validation & Publishing: Validation is the most important step in the process. Validation & re-validation via an intricately designed process helped us finalize data points to be used for final calculations. The final Market estimates and forecasts were then aligned and sent to our panel of industry experts for validation of data. Once the validation was done the report was sent to our Quality Assurance team to ensure adherence to style guides, consistency & design.
Analyst Support
Customization Options
With the given market data, our dedicated team of analysts can offer you the following customization options are available for the Renewable Energy Asset Management Market:
Product Analysis: Product matrix, which offers a detailed comparison of the product portfolio of companies.
Regional Analysis: Further analysis of the Renewable Energy Asset Management Market for additional countries.
Competitive Analysis: Detailed analysis and profiling of additional Market players & comparative analysis of competitive products.
Go to Market Strategy: Find the high-growth channels to invest your marketing efforts and increase your customer base.
Innovation Mapping: Identify racial solutions and innovation, connected to deep ecosystems of innovators, start-ups, academics, and strategic partners.
Category Intelligence: Customized intelligence that is relevant to their supply Markets will enable them to make smarter sourcing decisions and improve their category management.
Public Company Transcript Analysis: To improve the investment performance by generating new alpha and making better-informed decisions.
Social Media Listening: To analyze the conversations and trends happening not just around your brand, but around your industry as a whole, and use those insights to make better Marketing decisions.
REQUEST FOR SAMPLE
 REQUEST FREE CUSTOMIZATION


Want to customize this report? This report can be personalized according to your needs. Our analysts and industry experts will work directly with you to understand your requirements and provide you with customized data in a short amount of time. We offer $1000 worth of FREE customization at the time of purchase.
Feedback From Our Clients


 USA (+1) 351-333-4748

