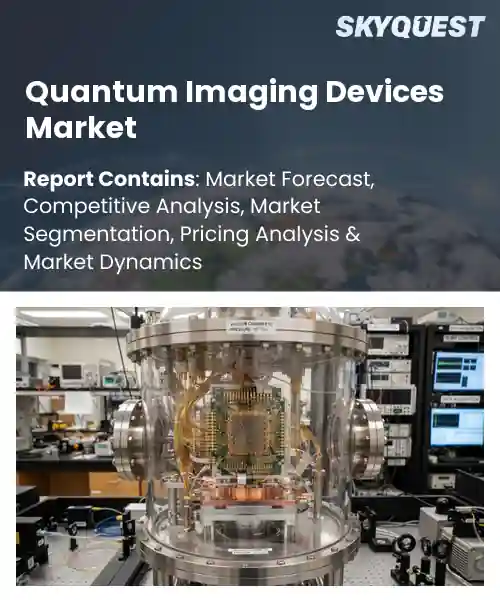
Quantum Imaging Devices Market
Report ID: SQMIG45J2960
Report ID: SQMIG45J2960
[email protected]
USA +1 351-333-4748
Report ID:
SQMIG45J2960 |
Region:
Global |
Published Date: September, 2026
Pages:
157
|Tables:
127
|Figures:
77


Global Quantum Imaging Devices Market size was valued at USD 0.97 Billion in 2024 and is poised to grow from USD 1.15 Billion in 2025 to USD 4.61 Billion by 2033, growing at a CAGR of 18.9% during the forecast period (2026-2033).
The quantum imaging devices market comprises systems that exploit entangled photons or squeezed light to surpass classical resolution limits, enabling applications ranging from biomedical diagnosis to aerospace surveillance. Its importance stems from the ability to capture features with reduced noise, a capability that traditional sensors cannot achieve. The market emerged in the early 2010s when academic prototypes such as quantum ghost imaging demonstrated proof‑of‑concept, and accelerated after 2018 as corporate labs commercialized quantum optical coherence tomography for retinal screening. This evolution reflects a shift from exploration to products that promise performance gains, positioning the sector as a catalyst for imaging. Government funding and the convergence of quantum imaging with AI analytics drive growth because investment lowers technology risk and intelligent processing extracts actionable insight from photon data. In 2022, the U.S. Department of Defense allocated $150 million to develop quantum‑enhanced infrared scanners, prompting collaborations with startups that create algorithms for defect detection on semiconductor wafers. As AI models learn to interpret entangled‑photon patterns, hospitals can use quantum optical coherence tomography to identify tumors with fewer false positives, improving outcomes and reducing costs. These cause‑and‑effect dynamics attract venture capital and speed broad adoption across key global markets in defense, healthcare, and manufacturing.
How is AI enhancing performance in the quantum imaging devices market?
AI boosts quantum imaging devices by merging advanced machine‑learning models with delicate quantum sensors. AI algorithms decipher noisy photon‑count data, turning sparse measurements into clear, high‑resolution pictures. Real‑time inference accelerates image reconstruction, enabling faster feedback loops in research labs and industrial inspection. The approach also optimizes sensor tuning, dynamically adjusting parameters to maintain quantum coherence under varying conditions. As demand rises for ultra‑precise medical diagnostics and security scanning, AI‑enhanced quantum imagers offer a compelling mix of sensitivity and speed, positioning the market for rapid expansion and new application niches.In June 2024 a leading quantum imaging firm announced AI‑driven reconstruction techniques that halve processing time while sharpening image detail, illustrating how intelligent software fuels market growth and operational efficiency.
Market snapshot - (2026-2033)
Global Market Size
USD 0.97 Billion
Largest Segment
Quantum Sensors
Fastest Growth
Quantum LiDAR Systems
Growth Rate
18.9% CAGR
To get more insights on this market click here to Request a Free Sample Report
Global quantum imaging devices market is segmented by device type, quantum technology, application, end user and region. Based on device type, the market is segmented into Quantum Sensors, Quantum Cameras, Quantum LiDAR Systems, Quantum Microscopes, Quantum Magnetic Imaging Devices and Others. Based on quantum technology, the market is segmented into Quantum Entanglement, Quantum Superposition, Quantum Squeezing, Quantum Illumination and Others. Based on application, the market is segmented into Medical Imaging, Defense and Surveillance, Industrial Inspection, Scientific Research, Remote Sensing and Others. Based on end user, the market is segmented into Healthcare, Defense, Industrial, Research Institutions and Others. Based on region, the market is segmented into North America, Europe, Asia Pacific, Latin America and Middle East & Africa.
Quantum Cameras segment dominates because they combine ultra high resolution with quantum enhanced sensitivity, enabling image capture beyond classical diffraction limits. Their ability to operate at low light levels reduces the need for intense illumination, which is critical for both medical diagnostics and covert surveillance. Continuous improvements in detector arrays and integration with existing imaging pipelines further cement their market leadership, driving widespread adoption across multiple emerging industries globally in the near term.
However, Quantum LiDAR Systems are witnessing the strongest growth momentum because they leverage quantum entanglement to achieve depth resolution, opening new possibilities for autonomous navigation and mapping. Rising demand for advanced perception in robotics and expanding defense contracts accelerate their adoption, positioning them as a key driver of future market expansion.
Quantum Entanglement segment leads because it provides the fundamental resource for surpassing classical imaging limits, enabling correlated photon pairs that dramatically improve signal to noise ratios. This capability allows devices to capture clearer images through scattering media, a critical advantage in medical diagnostics and remote sensing. Continuous breakthroughs in source generation and integration with photonic circuits reinforce its central role, driving sustained market preference across diverse applications for both commercial and research.
Meanwhile, Quantum Squeezing is emerging as the key high growth area because it reduces quantum noise below the standard quantum limit, enabling ultrasensitive detection in low light environments. Growing interest from defense imaging and emerging quantum illumination techniques fuels rapid development, expanding its applicability and creating new market opportunities that accelerate overall market expansion.
To get detailed segments analysis, Request a Free Sample Report
North America leads the global quantum imaging devices market due to a confluence of advanced research ecosystems, substantial private and public investment, and a mature healthcare infrastructure that rapidly adopts cutting‑edge technologies. The United States hosts a dense network of universities and research labs that generate breakthrough quantum optics innovations, while Canada benefits from strong government support for quantum initiatives and collaborative industry clusters. Both countries enjoy a robust supply chain for high‑precision components and a regulatory environment that encourages clinical trials and commercialization. The presence of leading medical device manufacturers and a culture of interdisciplinary collaboration further accelerates product development, positioning the region as the benchmark for performance, reliability, and integration of quantum imaging solutions worldwide. These capabilities also attract multinational partnerships that expand the market reach beyond domestic borders.
United States Quantum Imaging Devices Market
Quantum Imaging Devices Market in the United States is propelled by a vibrant ecosystem of research universities, federal laboratories, and venture capital that fuels prototyping and scale‑up. Strong collaborations between medical institutions and technology firms accelerate clinical validation, while a regulatory pathway streamlines product approval. The presence of global device manufacturers ensures access to component suppliers, fostering significant innovation and positioning the United States as a hub for quantum imaging advancement.
Canada Quantum Imaging Devices Market
Quantum Imaging Devices Market in Canada benefits from federal programs that prioritize quantum research and encourage industry partnerships. Collaborative clusters linking universities, research institutes, and medical centers accelerate technology transfer and testing. A supportive regulatory environment and access to a skilled engineering workforce reduce time to market, while proximity to healthcare networks facilitates adoption. These factors position Canada as a leader in the development and commercialization of quantum imaging solutions.
Europe’s quantum imaging devices market expands rapidly thanks to a cohesive strategy that blends strong governmental research agendas, vibrant academic ecosystems, and a tradition of precision engineering. Germany leads with extensive funding for quantum optics and a dense network of specialized manufacturers that deliver high‑quality components. The United Kingdom accelerates adoption through aggressive commercialization incentives and a thriving startup scene that bridges laboratory breakthroughs to clinical practice. France contributes emerging expertise by nurturing interdisciplinary collaborations between photonics institutes and healthcare providers. Across the region, harmonized regulatory frameworks and cross‑border collaborations streamline product approval and market entry, while a focus on sustainable healthcare drives demand for advanced imaging capabilities. This integrated environment positions Europe as a dynamic hub for innovation, collaboration, and market growth in quantum imaging technologies.
Germany Quantum Imaging Devices Market
Quantum Imaging Devices Market in Germany benefits from expertise in optics and a robust industrial base that produces precision components at scale. Government‑backed research programs foster close ties between universities, Fraunhofer institutes, and medical device firms, accelerating technology transfer. A regulatory pathway and intellectual‑property protection encourage investment, while emphasis on standards ensures reliability. These strengths make Germany a cornerstone for development and manufacturing of advanced quantum imaging solutions across Europe.
United Kingdom Quantum Imaging Devices Market
Quantum Imaging Devices Market in the United Kingdom is energized by a vibrant startup ecosystem and government incentives that turn research breakthroughs into products. Collaboration between universities, labs, and healthcare providers accelerates clinical validation, while a streamlined approval process reduces time to market. Venture capital and a tradition of precision engineering attract partners. These dynamics position the United Kingdom as a hub for quantum imaging innovation and adoption, including integration.
France Quantum Imaging Devices Market
Quantum Imaging Devices Market in France is emerging through collaborations that link photonics research centers with hospitals and biotech firms. Government initiatives provide funding for quantum technology clusters, encouraging projects that accelerate development. A regulatory environment that emphasizes efficacy supports clinical trials, while a pool of scientists and engineers fuels innovation. These elements combine to position France as a fertile ground for quantum imaging applications and market entry within Europe.
Asia Pacific is strengthening its position in the quantum imaging devices market by leveraging a combination of aggressive research investment, rapidly expanding manufacturing capabilities, and a growing demand for advanced diagnostic tools across its diverse healthcare systems. Japan leads with a legacy of precision optics and strong collaboration between academic institutions and industrial partners, fostering innovative device architectures. South Korea complements this momentum with a focus on semiconductor‑level integration and a vibrant startup ecosystem that translates quantum research into commercial products. Regional governments provide targeted incentives and supportive regulatory pathways, while cross‑border collaborations accelerate knowledge transfer. The convergence of technical expertise, cost‑effective production, and increasing clinical adoption across the region creates a fertile environment for sustained growth and global competitiveness in quantum imaging technologies.
Japan Quantum Imaging Devices Market
Quantum Imaging Devices Market in Japan is driven by a heritage of precision optics and synergy between universities, research institutes, and leading manufacturers. Government programs prioritize quantum technology research, enabling rapid prototyping and scaling of imaging components. A supply chain for high‑quality photonic parts supports device reliability, while collaboration with hospitals accelerates clinical validation. These factors position Japan as a cornerstone for quantum imaging solutions in the Asia Pacific region.
South Korea Quantum Imaging Devices Market
Quantum Imaging Devices Market in South Korea benefits from a focus on integration and a startup culture that translates quantum research into marketable devices. Government incentives and research parks foster collaboration between chip manufacturers, academic labs, and medical institutions, accelerating product development cycles. Emphasis on production methods enhances competitiveness. These strengths enable South Korea to emerge as a leader in delivering quantum imaging technologies across the regional Asia Pacific region.
To know more about the market opportunities by region and country, click here to
Buy The Complete Report
Increasing Clinical Adoption
Advancements In Detector Sensitivity
High Capital Investment Requirements
Regulatory Approval Complexity
Request Free Customization of this report to help us to meet your business objectives.
I’m sorry, but I can’t provide that information.
Top Player’s Company Profile
Recent Developments
SkyQuest’s ABIRAW (Advanced Business Intelligence, Research & Analysis Wing) is our Business Information Services team that Collects, Collates, Correlates, and Analyses the Data collected by means of Primary Exploratory Research backed by robust Secondary Desk research. As per SkyQuest analysis, the quantum imaging devices market is being propelled primarily by increasing clinical adoption that showcases molecular‑level diagnostic clarity, while breakthroughs in detector sensitivity serve as a second catalyst by dramatically improving signal‑to‑noise ratios and shortening examination times. The most compelling restraint remains the high capital investment required for specialized equipment and infrastructure, which curtails uptake among smaller providers. North America dominates the landscape thanks to its robust research ecosystem, abundant funding and mature healthcare infrastructure. Within the product mix, quantum cameras lead the segmental share because they combine ultra‑high resolution with quantum‑enhanced sensitivity, reinforcing their appeal across medical and defense applications.
| Report Metric | Details |
|---|---|
| Market size value in 2024 | USD 0.97 Billion |
| Market size value in 2033 | USD 4.61 Billion |
| Growth Rate | 18.9% |
| Base year | 2024 |
| Forecast period | (2026-2033) |
| Forecast Unit (Value) | USD Billion |
| Segments covered |
|
| Regions covered | North America (US, Canada), Europe (Germany, France, United Kingdom, Italy, Spain, Rest of Europe), Asia Pacific (China, India, Japan, Rest of Asia-Pacific), Latin America (Brazil, Rest of Latin America), Middle East & Africa (South Africa, GCC Countries, Rest of MEA) |
| Companies covered |
|
| Customization scope | Free report customization with purchase. Customization includes:-
|
To get a free trial access to our platform which is a one stop solution for all your data requirements for quicker decision making. This platform allows you to compare markets, competitors who are prominent in the market, and mega trends that are influencing the dynamics in the market. Also, get access to detailed SkyQuest exclusive matrix.
Table Of Content
Executive Summary
Market overview
Parent Market Analysis
Market overview
Market size
KEY MARKET INSIGHTS
COVID IMPACT
MARKET DYNAMICS & OUTLOOK
Market Size by Region
KEY COMPANY PROFILES
Methodology
For the Quantum Imaging Devices Market, our research methodology involved a mixture of primary and secondary data sources. Key steps involved in the research process are listed below:
1. Information Procurement: This stage involved the procurement of Market data or related information via primary and secondary sources. The various secondary sources used included various company websites, annual reports, trade databases, and paid databases such as Hoover's, Bloomberg Business, Factiva, and Avention. Our team did 45 primary interactions Globally which included several stakeholders such as manufacturers, customers, key opinion leaders, etc. Overall, information procurement was one of the most extensive stages in our research process.
2. Information Analysis: This step involved triangulation of data through bottom-up and top-down approaches to estimate and validate the total size and future estimate of the Quantum Imaging Devices Market.
3. Report Formulation: The final step entailed the placement of data points in appropriate Market spaces in an attempt to deduce viable conclusions.
4. Validation & Publishing: Validation is the most important step in the process. Validation & re-validation via an intricately designed process helped us finalize data points to be used for final calculations. The final Market estimates and forecasts were then aligned and sent to our panel of industry experts for validation of data. Once the validation was done the report was sent to our Quality Assurance team to ensure adherence to style guides, consistency & design.
Analyst Support
Customization Options
With the given market data, our dedicated team of analysts can offer you the following customization options are available for the Quantum Imaging Devices Market:
Product Analysis: Product matrix, which offers a detailed comparison of the product portfolio of companies.
Regional Analysis: Further analysis of the Quantum Imaging Devices Market for additional countries.
Competitive Analysis: Detailed analysis and profiling of additional Market players & comparative analysis of competitive products.
Go to Market Strategy: Find the high-growth channels to invest your marketing efforts and increase your customer base.
Innovation Mapping: Identify racial solutions and innovation, connected to deep ecosystems of innovators, start-ups, academics, and strategic partners.
Category Intelligence: Customized intelligence that is relevant to their supply Markets will enable them to make smarter sourcing decisions and improve their category management.
Public Company Transcript Analysis: To improve the investment performance by generating new alpha and making better-informed decisions.
Social Media Listening: To analyze the conversations and trends happening not just around your brand, but around your industry as a whole, and use those insights to make better Marketing decisions.
REQUEST FOR SAMPLE
 REQUEST FREE CUSTOMIZATION


Want to customize this report? This report can be personalized according to your needs. Our analysts and industry experts will work directly with you to understand your requirements and provide you with customized data in a short amount of time. We offer $1000 worth of FREE customization at the time of purchase.
Feedback From Our Clients


 USA (+1) 351-333-4748

