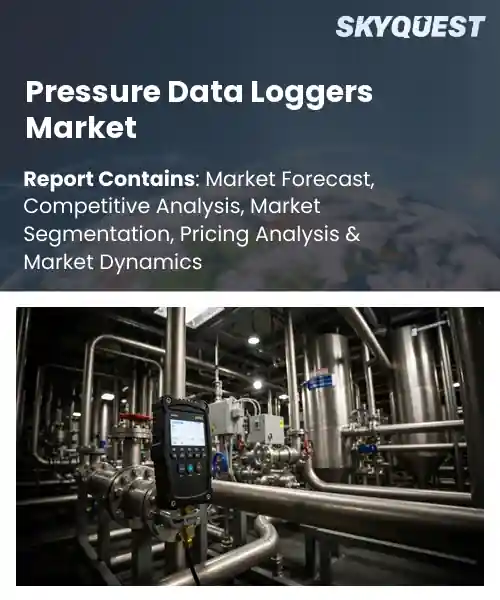
Pressure Data Loggers Market
Report ID: SQMIG45J2695
Report ID: SQMIG45J2695
[email protected]
USA +1 351-333-4748
Report ID:
SQMIG45J2695 |
Region:
Global |
Published Date: July, 2026
Pages:
157
|Tables:
147
|Figures:
78


Global Pressure Data Loggers Market size was valued at USD 612.5 Million in 2024 and is poised to grow from USD 651.7 Million in 2025 to USD 1070.49 Million by 2033, growing at a CAGR of 6.4% during the forecast period (2026-2033).
Industrial automation and the need for monitoring have become the primary driver of the pressure data loggers market. Pressure data loggers are devices that capture, store, and transmit pressure readings, allowing operators to verify stability, safety limits, and compliance. Their importance spans oil and gas extraction, pharmaceutical production, and aerospace testing, where minor pressure shifts can cause shutdowns or recalls. The market began with analog recorders requiring manual retrieval; the 2000s introduced units with onboard memory, and the last decade added wireless, IoT‑enabled loggers that link to supervisory control systems. Rigs now use loggers to monitor pressure, reducing blowout risk. Building on this foundation, the integration of Internet of Things platforms drives global demand for pressure data loggers. By embedding sensors within analytics, manufacturers convert raw pressure data into maintenance alerts, preventing equipment failure and lowering costs. In the chemical sector, plants deploy IoT‑linked loggers to track reactor pressure, enabling shutdowns before hazardous thresholds are reached. This capability fuels market growth in regions investing in smart factories, while also opening opportunities in emerging economies upgrading legacy infrastructure. Consequently, vendors offering secure, scalable connectivity solutions are positioned to capture a larger share of the expanding worldwide market in the global future.
How is AI-driven IoT integration enhancing accuracy in the pressure data loggers market?
AI driven IoT integration is reshaping pressure data loggers by linking sensors directly to cloud analytics. The technology enables continuous streaming of pressure readings, allowing algorithms to detect anomalies and correct sensor drift on the fly. Real time edge processing filters noise and improves measurement fidelity, while remote firmware updates keep devices aligned with the latest calibration models. Manufacturers embed machine learning models that learn from historical patterns, which reduces manual recalibration cycles and extends device lifespan. This data flow also supports predictive maintenance for equipment, making the logging solution more reliable and attractive for industrial users.In June 2024, a new AI enabled pressure logger was launched, improving real time calibration and reducing drift, which strengthens market growth and operational efficiency. The device combines edge AI with wireless connectivity, letting operators view pressure trends on a mobile dashboard and receive alerts when values stray from set points, cutting response time.
Market snapshot - (2026-2033)
Global Market Size
USD 612.5 Million
Largest Segment
Absolute Pressure Data Loggers
Fastest Growth
Differential Pressure Data Loggers
Growth Rate
6.4% CAGR
To get more insights on this market click here to Request a Free Sample Report
Global pressure data loggers market is segmented by product type, connectivity, application, end user, installation and region. Based on product type, the market is segmented into Absolute Pressure Data Loggers, Gauge Pressure Data Loggers and Differential Pressure Data Loggers. Based on connectivity, the market is segmented into USB, Bluetooth, Wi-Fi and Cellular. Based on application, the market is segmented into Industrial Process Monitoring, Environmental Monitoring, Water & Wastewater, Oil & Gas and Healthcare. Based on end user, the market is segmented into Manufacturing, Utilities, Research Institutes and Healthcare. Based on installation, the market is segmented into Portable and Fixed. Based on region, the market is segmented into North America, Europe, Asia Pacific, Latin America and Middle East & Africa.
Absolute Pressure Data Loggers segment dominates because they provide direct measurement of ambient pressure without reference, which simplifies system design and reduces calibration effort for many industrial and environmental applications. Their inherent accuracy and reliability meet the core requirement of continuous monitoring, fostering trust among end users. Consequently, manufacturers prioritize these devices in product portfolios, reinforcing market uptake and establishing them as the foundational offering within the pressure data loggers market.
Meanwhile, Differential Pressure Data Loggers segment is experiencing the fastest growth as industries seek precise pressure differentials for process optimization and leak detection. Innovative sensor technologies and integration with advanced analytics accelerate adoption, opening new application niches and expanding overall market potential which fuels further investment in R&D and creates additional revenue streams for vendors.
Wi Fi segment dominates because it offers seamless wireless communication without the constraints of cables, enabling real time data transmission to cloud platforms and centralized monitoring stations. This convenience aligns with the growing demand for remote accessibility and rapid decision making across diverse operational sites. The ability to integrate with existing IT infrastructure accelerates deployment, making Wi Fi the preferred choice for many manufacturers seeking scalable and flexible logging solutions.
Conversely, Cellular segment is emerging as the fastest growing area as remote and offshore installations require reliable connectivity beyond local networks. Advances in low power wide area communication and increasing coverage enable continuous monitoring in harsh environments, driving new market opportunities and encouraging vendors to develop specialized cellular enabled data loggers.
To get detailed segments analysis, Request a Free Sample Report
North America leads the global pressure data loggers market due to a mature industrial base, strong emphasis on operational safety, and extensive adoption of advanced monitoring solutions across sectors such as oil and gas, aerospace, and manufacturing. The region benefits from well‑established supply chains, high levels of technical expertise, and a regulatory environment that encourages precise pressure measurement and data integrity. Collaborative research initiatives between manufacturers and academic institutions drive continuous innovation, while the presence of major original equipment manufacturers ensures rapid integration of new features. Customer demand for reliable, rugged devices that can operate in harsh environments further consolidates the region leadership position. In addition, the focus on digital transformation and integration of Internet of Things capabilities enhances data accessibility and real‑time decision making, reinforcing the competitive advantage of North American providers.
Pressure Data Loggers Market in the United States is characterized by strong demand from energy production, aerospace, and advanced manufacturing sectors that prioritize precision and reliability. End‑users value robust device construction, seamless integration with existing control systems, and comprehensive support services. Local manufacturers benefit from close collaboration with research laboratories, fostering rapid prototyping and customization that address specific operational challenges across diverse industrial environments through innovative engineering practices and expertise.
Pressure Data Loggers Market in Canada benefits from an emphasis on safety compliance and a focus on sustainable industrial processes. Key sectors such as oil and gas extraction, mining, and water management rely on accurate pressure monitoring to optimize operations and mitigate environmental impact. Canadian firms leverage ties with engineering colleges and research programs to develop rugged, low‑temperature capable devices that meet the demands of remote and harsh field conditions.
The European pressure data loggers market is expanding rapidly as manufacturers and end‑users prioritize energy efficiency, regulatory compliance, and digital connectivity across a wide range of applications. Stringent environmental directives and safety standards compel industries to adopt precise monitoring solutions that can provide real‑time data and support predictive maintenance. Collaborative ecosystems involving technology providers, research institutes, and standards bodies foster the development of interoperable devices with advanced analytics capabilities. Growing investment in renewable energy infrastructure and the modernization of legacy process plants further stimulate demand for versatile loggers that can operate under diverse pressure ranges and harsh conditions. Additionally, the emphasis on sustainability and circular economy principles encourages the adoption of durable, easily upgradable equipment, reinforcing Europe’s position as a hub for innovative pressure monitoring technologies.
Pressure Data Loggers Market in Germany is driven by a strong engineering tradition and a high concentration of automotive, chemical, and energy companies that require exact pressure measurement for quality control and safety. German manufacturers focus on integrating high‑precision sensors with robust data management platforms, enabling seamless communication with Industry 4.0 systems. Close cooperation with technical universities accelerates the introduction of cutting‑edge features such as wireless connectivity and advanced diagnostic algorithms.
Pressure Data Loggers Market in the United Kingdom is experiencing accelerated growth as the country expands its offshore wind and oil & gas sectors while modernizing manufacturing processes. End‑users value flexible devices that can be deployed and integrated with analytics platforms for insight. Collaboration between industry consortia and academic research centers drives the development of smart loggers featuring edge computing and cybersecurity, meeting the evolving demands of a regulated market.
Pressure Data Loggers Market in France is emerging as manufacturers focus on renewable energy projects and the modernization of chemical processing facilities. French firms prioritize compact, high‑accuracy devices that can be easily installed in constrained spaces and provide reliable data for process optimization. Partnerships with research agencies support the integration of advanced sensor materials and low‑power communication protocols, enabling loggers to operate efficiently in both industrial and environmental monitoring applications.
Asia Pacific is strengthening its position in the pressure data loggers market through a combination of rapid industrialization, expanding infrastructure projects, and a growing emphasis on digital transformation across manufacturing sectors. Nations in the region are investing heavily in smart factory initiatives that require precise, real‑time pressure monitoring to enhance process efficiency and safety. Local manufacturers are leveraging advances in miniaturization and low‑power electronics to produce compact, rugged loggers suited for diverse applications ranging from petrochemical plants to water treatment facilities. Collaborative efforts between technology firms and research institutions accelerate the adoption of IoT‑enabled devices with cloud‑based analytics, enabling predictive maintenance and reduced downtime. Moreover, the focus on cost‑effective solutions and scalable designs aligns with the region’s demand for high‑volume production, reinforcing Asia Pacific’s emerging leadership in the global market.
Pressure Data Loggers Market in Japan is characterized by a strong focus on high‑precision engineering and integration with advanced automation systems prevalent in automotive and semiconductor manufacturing. Japanese suppliers emphasize reliability and stability, offering devices that can withstand stringent quality standards and continuous operation. Close collaboration with research universities drives the incorporation of cutting‑edge sensor technologies and AI‑based analytics, enabling users to achieve superior process control and predictive maintenance capabilities.
Pressure Data Loggers Market in South Korea is propelled by the country’s adoption of smart manufacturing and its expanding petrochemical industry. Korean manufacturers prioritize compact, high‑speed data acquisition devices that can be seamlessly integrated into PLC and SCADA networks. Partnerships with leading electronics firms and research programs foster the development of loggers featuring advanced wireless protocols and analytics, supporting efficient process optimization and stringent safety compliance across diverse industrial applications.
To know more about the market opportunities by region and country, click here to
Buy The Complete Report
Increasing Adoption Of IoT Connectivity
Regulatory Emphasis on Data Accuracy
High Initial Capital Investment
Complex Integration With Legacy Systems
Request Free Customization of this report to help us to meet your business objectives.
In 2026 the pressure data logger market intensified competition as incumbents accelerated M&A to embed wireless telemetry and cloud analytics, while a newly emerged startup secured a $108 million seed and Series A round to commercialize AI‑driven pressure logging hardware, prompting rivals to forge partnerships with cloud service providers and launch next‑generation battery‑free sensors.
Top Player’s Company Profile
Recent Developments
SkyQuest’s ABIRAW (Advanced Business Intelligence, Research & Analysis Wing) is our Business Information Services team that Collects, Collates, Correlates, and Analyses the Data collected by means of Primary Exploratory Research backed by robust Secondary Desk research. As per SkyQuest analysis, the global pressure data loggers market is being propelled primarily by the increasing adoption of IoT connectivity which lets operators stream real‑time pressure readings to cloud platforms for predictive maintenance and faster decision making. A second important catalyst is the growing regulatory emphasis on data accuracy that pushes industries to replace legacy devices with calibrated, audit‑ready loggers. The market is led by North America where mature industrial bases and strict safety standards drive demand, and the absolute pressure data loggers segment dominates because of its straightforward, high‑accuracy measurement. However, the high initial capital investment required for advanced, rugged loggers remains a notable restraint that can slow adoption for smaller firms.
| Report Metric | Details |
|---|---|
| Market size value in 2024 | USD 612.5 Million |
| Market size value in 2033 | USD 1070.49 Million |
| Growth Rate | 6.4% |
| Base year | 2024 |
| Forecast period | (2026-2033) |
| Forecast Unit (Value) | USD Million |
| Segments covered |
|
| Regions covered | North America (US, Canada), Europe (Germany, France, United Kingdom, Italy, Spain, Rest of Europe), Asia Pacific (China, India, Japan, Rest of Asia-Pacific), Latin America (Brazil, Rest of Latin America), Middle East & Africa (South Africa, GCC Countries, Rest of MEA) |
| Companies covered |
|
| Customization scope | Free report customization with purchase. Customization includes:-
|
To get a free trial access to our platform which is a one stop solution for all your data requirements for quicker decision making. This platform allows you to compare markets, competitors who are prominent in the market, and mega trends that are influencing the dynamics in the market. Also, get access to detailed SkyQuest exclusive matrix.
Table Of Content
Executive Summary
Market overview
Parent Market Analysis
Market overview
Market size
KEY MARKET INSIGHTS
COVID IMPACT
MARKET DYNAMICS & OUTLOOK
Market Size by Region
KEY COMPANY PROFILES
Methodology
For the Pressure Data Loggers Market, our research methodology involved a mixture of primary and secondary data sources. Key steps involved in the research process are listed below:
1. Information Procurement: This stage involved the procurement of Market data or related information via primary and secondary sources. The various secondary sources used included various company websites, annual reports, trade databases, and paid databases such as Hoover's, Bloomberg Business, Factiva, and Avention. Our team did 45 primary interactions Globally which included several stakeholders such as manufacturers, customers, key opinion leaders, etc. Overall, information procurement was one of the most extensive stages in our research process.
2. Information Analysis: This step involved triangulation of data through bottom-up and top-down approaches to estimate and validate the total size and future estimate of the Pressure Data Loggers Market.
3. Report Formulation: The final step entailed the placement of data points in appropriate Market spaces in an attempt to deduce viable conclusions.
4. Validation & Publishing: Validation is the most important step in the process. Validation & re-validation via an intricately designed process helped us finalize data points to be used for final calculations. The final Market estimates and forecasts were then aligned and sent to our panel of industry experts for validation of data. Once the validation was done the report was sent to our Quality Assurance team to ensure adherence to style guides, consistency & design.
Analyst Support
Customization Options
With the given market data, our dedicated team of analysts can offer you the following customization options are available for the Pressure Data Loggers Market:
Product Analysis: Product matrix, which offers a detailed comparison of the product portfolio of companies.
Regional Analysis: Further analysis of the Pressure Data Loggers Market for additional countries.
Competitive Analysis: Detailed analysis and profiling of additional Market players & comparative analysis of competitive products.
Go to Market Strategy: Find the high-growth channels to invest your marketing efforts and increase your customer base.
Innovation Mapping: Identify racial solutions and innovation, connected to deep ecosystems of innovators, start-ups, academics, and strategic partners.
Category Intelligence: Customized intelligence that is relevant to their supply Markets will enable them to make smarter sourcing decisions and improve their category management.
Public Company Transcript Analysis: To improve the investment performance by generating new alpha and making better-informed decisions.
Social Media Listening: To analyze the conversations and trends happening not just around your brand, but around your industry as a whole, and use those insights to make better Marketing decisions.
REQUEST FOR SAMPLE
 REQUEST FREE CUSTOMIZATION


Want to customize this report? This report can be personalized according to your needs. Our analysts and industry experts will work directly with you to understand your requirements and provide you with customized data in a short amount of time. We offer $1000 worth of FREE customization at the time of purchase.
Feedback From Our Clients


 USA (+1) 351-333-4748

