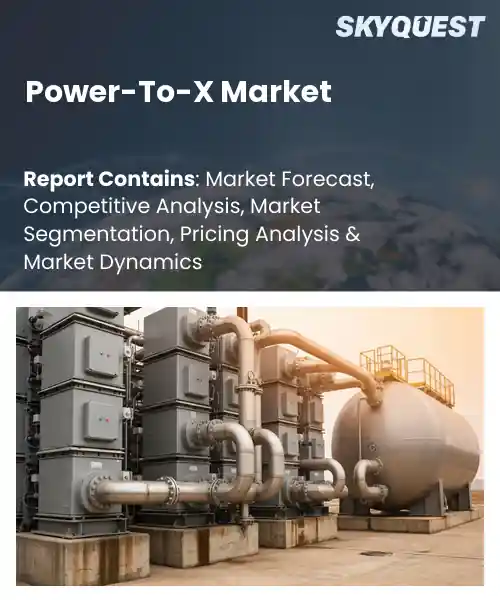
Power-To-X Market
Report ID: SQMIG55B2021
Report ID: SQMIG55B2021
[email protected]
USA +1 351-333-4748
Report ID:
SQMIG55B2021 |
Region:
Global |
Published Date: June, 2026
Pages:
157
|Tables:
122
|Figures:
72


Global Power-To-X Market size was valued at USD 2.52 Billion in 2024 and is poised to grow from USD 3.15 Billion in 2025 to USD 18.52 Billion by 2033, growing at a CAGR of 24.82% during the forecast period (2026-2033).
The power-to-x market converts renewable electricity into chemical energy carriers such as hydrogen, ammonia and synthetic fuels, enabling decarbonisation of hard-to-electrify sectors and seasonal energy storage. Its primary driver is the rapid deployment of variable renewables combined with climate commitments that force a shift away from fossil feedstocks, because excess generation creates economic incentive to valorise surplus power and policymakers design support schemes. Initially limited to demonstration projects, the market matured as electrolyser costs declined and industrial demand for low-carbon inputs emerged; notable developments include large-scale green hydrogen consortia in Europe and steel decarbonisation pilots that prove commercial pathways now.
A decisive growth factor is rapid cost reduction in electrolyser technologies, which lowers levelised cost of hydrogen and therefore enables commercial offtake agreements that attract project finance and scale manufacturing. As developers secure long-term contracts and build gigawatt-scale facilities, renewable project developers respond by expanding dedicated wind and solar capacity, creating a virtuous cycle that makes exports and hard-to-abate applications economically viable. This dynamic produces concrete opportunities: green ammonia for maritime fuel, synthetic kerosene for aviation, hydrogen-based steelmaking, and seasonal energy storage for grids, all supported further by carbon pricing, industrial decarbonisation mandates and export markets.
How is AI optimizing electrolyzer performance in the Power-to-X market?
AI is optimizing electrolyzer performance by combining digital twins physics informed machine learning and advanced control to improve efficiency reliability and transparency. Key aspects include real time process optimization adaptive control that smooths variable renewable input predictive maintenance that signals degradation before failures and explainable models that generate auditable operating evidence. The current state is focused on pilots and software overlays that tune pressure temperature and current profiles while creating data that financiers and operators can trust. In the Power to X market this matters because reliable predictable electrolyzer output unlocks downstream synthesis and fuels commercial scale deployment.
Polestar Technology March 2026, launched HYDRA OS an AI operating system that runs a physics informed digital twin with an ensemble of algorithms to optimize operating conditions and deliver auditable performance data. This innovation supports efficiency gains extends asset life and reduces investment risk which helps scale Power to X projects.
Market snapshot - (2026-2033)
Global Market Size
USD 2.52 Billion
Largest Segment
Green Hydrogen
Fastest Growth
Synthetic Chemicals
Growth Rate
24.82% CAGR
To get more insights on this market click here to Request a Free Sample Report
Global power-to-x market is segmented by product, technology, application and region. Based on product, the market is segmented into Green Hydrogen, Synthetic Natural Gas (SNG), E-Fuels (E-Methanol, E-Ammonia) and Synthetic Chemicals. Based on technology, the market is segmented into Electrolysis (PEM, AEL, SOEC), Methanation and Fischer-Tropsch Synthesis. Based on application, the market is segmented into Transport, Industry, Energy Storage and Building Heating. Based on region, the market is segmented into North America, Europe, Asia Pacific, Latin America and Middle East & Africa.
Green Hydrogen segment dominates because it forms the foundational vector for Power to X conversion, enabling direct substitution of fossil feedstocks across industrial and transport uses. Its leadership is driven by clear lifecycle emissions advantages, strong compatibility with electrolyzer technologies, and broad stakeholder commitment, which together catalyze investment, infrastructure build out and integrated supply chains that reinforce market scale and attract supportive policy frameworks.
However, E Ammonia is emerging as the most rapidly expanding area in Power to X, driven by demand for a dense hydrogen carrier, ease of shipping and compatibility with fertilizer and marine fuel value chains. Innovation in synthesis and rising industrial interest accelerate pipelines and unlock new offtake and infrastructure investment.
PEM segment leads because its design supports rapid response to variable renewable electricity, delivering high purity hydrogen and compact system footprints that align with distributed Power to X installations. Market adoption is reinforced by mature manufacturing pathways, ease of integration with grid services and developer preference for operational flexibility, which in turn attracts project finance and drives deployment into industrial and transport offtake corridors and supports faster cost reduction through scale.
Meanwhile, SOEC is emerging as the most rapidly expanding technology area in Power to X, driven by higher electrical efficiency and coelectrolysis capability for direct synthetic fuel production. Advances in stack materials and growing industrial pilots accelerate commercialization and unlock premium markets for low carbon fuels and chemicals.
To get detailed segments analysis, Request a Free Sample Report
Europe dominates the global Power-To-X market through a combination of cohesive policy frameworks, mature renewable energy systems and deep industrial demand that align to create integrated value chains. Leading manufacturing capacity for electrolysers and related components, established port infrastructure and dense research networks accelerate commercialization and export orientation. Cross border grid interconnections and coordinated certification frameworks enable project scale and market liquidity, while concentrated industrial clusters create reliable offtake for synthetic fuels and hydrogen derivatives. Strong public private collaboration and access to diverse financing instruments further de risk projects. This ecosystem yields technological specialization, supply chain resilience and a competitive advantage in delivering large, integrated Power-To-X deployments across domestic and international markets. Well developed certification pathways and targeted workforce development programs support rapid scaling, while merchant market mechanisms and long term industrial partnerships underpin sustained demand.
Power-To-X Market in Germany is anchored by deep industrial demand, established manufacturing of electrolysers and strong coordination among policymakers, utilities and industrial players. Industrial clusters enable integrated projects that link renewable generation, storage and chemical production. Germany benefits from dense research networks and a skilled workforce, supporting commercialization pathways and export oriented supply chains. Financial mechanisms and port infrastructure further reinforce project development and international collaboration opportunities across regional markets.
Power-To-X Market in United Kingdom is propelled by strong policy frameworks, merchant financing interest and well developed port infrastructure serving export and domestic supply chains. A vibrant services sector supports project planning, certification and commercial scaling while research institutions enable pilot deployment. The market leverages flexible power systems and seeks integration with industrial decarbonization programs, creating demand pull that attracts technology providers and international partnerships focused on scalable hydrogen solutions.
Power-To-X Market in France benefits from coordinated energy policy, strong engineering capabilities and strategic port gateways that support large scale hydrogen logistics. Collaboration among utilities, industrial end users and research centers fosters demonstration projects that translate into commercial pathways. Emphasis on electrochemical and synthetic fuel applications aligns with national decarbonization priorities, while active participation in cross border initiatives and export oriented manufacturing strengthens industrial value chains and investor confidence regionally.
Asia Pacific market expansion is driven by rapid industrial electrification, strong export oriented manufacturing capabilities and strategic interest in decarbonizing hard to abate sectors. Countries leverage established technology supply chains and competitive manufacturing to scale electrolysers and associated equipment, while port infrastructure and shipping industry demand create pathways for hydrogen derivatives such as ammonia. Policy incentives, cross sector partnerships and active engagement by major industrial players accelerate pilot to commercial progression. The region emphasizes export markets and international collaboration, pursuing strategic projects that combine renewable generation, logistics and industrial integration. Diverse market conditions and complementary capabilities among countries position the region for accelerated adoption and technology specialization. Significant private sector investment and targeted research collaboration support localization of supply chains, while regulatory adjustments and international partnerships smooth trade and enable scalable project deployment across diverse national markets.
Power-To-X Market in Japan is characterized by strong industrial demand for decarbonized feedstocks, advanced manufacturing capabilities and a focus on ammonia for maritime applications. Corporations collaborate with research institutes to pilot integrated systems that combine renewables, storage and synthetic fuel production. Policy signals and trade orientation encourage export focused projects, while a skilled engineering base and established supply chains support localization of electrolysis and fuel synthesis technologies across industrial clusters.
Power-To-X Market in South Korea leverages a strong heavy industry base, advanced shipbuilding expertise and coordinated government industry initiatives to advance hydrogen and synthetic fuel projects. The market emphasizes integration with industrial energy systems and export oriented manufacturing of key components. Collaboration among conglomerates, technology providers and research centers accelerates pilot deployment and supports standardization efforts, positioning South Korea as a hub for maritime fuel solutions and industrial decarbonization pathways.
North America is strengthening its position in the Power-To-X market through robust private sector investment, cross jurisdictional coordination and technology innovation that translate into commercial scale projects. Established energy infrastructure and access to diverse renewable resources provide pathways to integrate electrolysis at industrial demand centers and port hubs. Federal and state level initiatives, coupled with active participation by utilities and energy companies, support development of hydrogen corridors and hub concepts that link production, storage and end use. Collaboration among research institutions, manufacturers and financiers fosters supply chain localization and workforce development. Strategic trade relationships between regional partners further enhance market opportunities and export oriented project design. Policy alignment, permitting streamlining and targeted public private partnerships are increasingly shaping bankable projects and accelerating deployment across key industrial clusters.
Power-To-X Market in United States benefits from substantial private investment, advanced technology development and a broad ecosystem of hubs and industrial demand centers. Energy companies and start ups collaborate with national laboratories to commercialize electrolysis and conversion technologies. Policy initiatives at multiple jurisdictional levels, together with flexible financing instruments and deep capital markets, support project development, while extensive port and pipeline infrastructure enables logistics for domestic use and export opportunities.
Power-To-X Market in Canada draws on abundant renewable resources, energy exporters and strong collaboration between governments and industry. The market focuses on integrating electrolysis with hydro and wind resources to supply industrial clusters and support export oriented hydrogen pathways. Research institutions and specialized manufacturers anchor pilot projects, while policy alignment and regional partnerships promote supply chain and workforce development. Port infrastructure and border trade relationships facilitate access to export markets.
To know more about the market opportunities by region and country, click here to
Buy The Complete Report
Policy Support For Renewable Hydrogen
Technological Advancements In Electrolysis
High Capital Expenditure Requirements
Infrastructure And Supply Chain Limitations
Request Free Customization of this report to help us to meet your business objectives.
Competitive landscape in the Global Power to X market is driven by intense project-level competition for offtake and site capacity, forcing deal-driven strategies. Corporates deploy M&A and strategic investments such as Cummins acquisition of Hydrogenics, project alliances like Liquid Wind’s engineering partnerships, and technology innovation exemplified by H2Pro’s E-TAC and Prometheus Fuels’ electrofuels developments.
SkyQuest’s ABIRAW (Advanced Business Intelligence, Research & Analysis Wing) is our Business Information Services team that Collects, Collates, Correlates, and Analyses the Data collected by means of Primary Exploratory Research backed by robust Secondary Desk research.
As per SkyQuest analysis, the global Power-to-X market is poised for robust expansion driven by rapid cost reduction in electrolyser technologies, which lowers the levelised cost of hydrogen and enables commercial scale projects. A second driver is strong policy support for renewable hydrogen that reduces investor uncertainty and unlocks financing. A major restraint remains high capital expenditure requirements that slow project rollouts and deter smaller developers. Europe continues to dominate the market thanks to cohesive policies, manufacturing capacity and industrial demand, while Green Hydrogen is the leading segment as the foundational vector for fuel and feedstock substitution across transport and industry.
| Report Metric | Details |
|---|---|
| Market size value in 2024 | USD 2.52 Billion |
| Market size value in 2033 | USD 18.52 Billion |
| Growth Rate | 24.82% |
| Base year | 2024 |
| Forecast period | (2026-2033) |
| Forecast Unit (Value) | USD Billion |
| Segments covered |
|
| Regions covered | North America (US, Canada), Europe (Germany, France, United Kingdom, Italy, Spain, Rest of Europe), Asia Pacific (China, India, Japan, Rest of Asia-Pacific), Latin America (Brazil, Rest of Latin America), Middle East & Africa (South Africa, GCC Countries, Rest of MEA) |
| Companies covered |
|
| Customization scope | Free report customization with purchase. Customization includes:-
|
To get a free trial access to our platform which is a one stop solution for all your data requirements for quicker decision making. This platform allows you to compare markets, competitors who are prominent in the market, and mega trends that are influencing the dynamics in the market. Also, get access to detailed SkyQuest exclusive matrix.
Table Of Content
Executive Summary
Market overview
Parent Market Analysis
Market overview
Market size
KEY MARKET INSIGHTS
COVID IMPACT
MARKET DYNAMICS & OUTLOOK
Market Size by Region
KEY COMPANY PROFILES
Methodology
For the Power-To-X Market, our research methodology involved a mixture of primary and secondary data sources. Key steps involved in the research process are listed below:
1. Information Procurement: This stage involved the procurement of Market data or related information via primary and secondary sources. The various secondary sources used included various company websites, annual reports, trade databases, and paid databases such as Hoover's, Bloomberg Business, Factiva, and Avention. Our team did 45 primary interactions Globally which included several stakeholders such as manufacturers, customers, key opinion leaders, etc. Overall, information procurement was one of the most extensive stages in our research process.
2. Information Analysis: This step involved triangulation of data through bottom-up and top-down approaches to estimate and validate the total size and future estimate of the Power-To-X Market.
3. Report Formulation: The final step entailed the placement of data points in appropriate Market spaces in an attempt to deduce viable conclusions.
4. Validation & Publishing: Validation is the most important step in the process. Validation & re-validation via an intricately designed process helped us finalize data points to be used for final calculations. The final Market estimates and forecasts were then aligned and sent to our panel of industry experts for validation of data. Once the validation was done the report was sent to our Quality Assurance team to ensure adherence to style guides, consistency & design.
Analyst Support
Customization Options
With the given market data, our dedicated team of analysts can offer you the following customization options are available for the Power-To-X Market:
Product Analysis: Product matrix, which offers a detailed comparison of the product portfolio of companies.
Regional Analysis: Further analysis of the Power-To-X Market for additional countries.
Competitive Analysis: Detailed analysis and profiling of additional Market players & comparative analysis of competitive products.
Go to Market Strategy: Find the high-growth channels to invest your marketing efforts and increase your customer base.
Innovation Mapping: Identify racial solutions and innovation, connected to deep ecosystems of innovators, start-ups, academics, and strategic partners.
Category Intelligence: Customized intelligence that is relevant to their supply Markets will enable them to make smarter sourcing decisions and improve their category management.
Public Company Transcript Analysis: To improve the investment performance by generating new alpha and making better-informed decisions.
Social Media Listening: To analyze the conversations and trends happening not just around your brand, but around your industry as a whole, and use those insights to make better Marketing decisions.
REQUEST FOR SAMPLE
 REQUEST FREE CUSTOMIZATION
Global Power-To-X Market size was valued at USD 2.52 Billion in 2024 and is poised to grow from USD 3.15 Billion in 2025 to USD 18.52 Billion by 2033, growing at a CAGR of 24.82% during the forecast period (2026-2033).
Competitive landscape in the Global Power to X market is driven by intense project-level competition for offtake and site capacity, forcing deal-driven strategies. Corporates deploy M&A and strategic investments such as Cummins acquisition of Hydrogenics, project alliances like Liquid Wind’s engineering partnerships, and technology innovation exemplified by H2Pro’s E-TAC and Prometheus Fuels’ electrofuels developments. 'Siemens Energy', 'Thyssenkrupp (Nucera)', 'Nel ASA', 'ITM Power', 'McPhy Energy', 'Electrochaea GmbH', 'Sunfire GmbH', 'MAN Energy Solutions', 'Haldor Topsoe', 'Hydrogenics (Cummins)', 'Green Hydrogen Systems', 'H2Pro', 'Plug Power', 'Bloom Energy', 'Air Liquide'
Green Hydrogen Export Hubs: Emerging coastal production clusters are enabling coordinated development of renewable generation, electrolysis capacity and maritime logistics to serve international demand for low carbon fuels. Strategic partnerships between resource rich regions and importing markets facilitate standardized certification, long term offtake arrangements and export route planning. This creates opportunity for specialized infrastructure, commercial frameworks and export led industrial ecosystems that can accelerate technology maturation, reduce market risk and attract diversified private and public capital while supporting broader decarbonization goals across value chains.
Why does Europe Dominate the Global Power-To-X Market? |@12


Want to customize this report? This report can be personalized according to your needs. Our analysts and industry experts will work directly with you to understand your requirements and provide you with customized data in a short amount of time. We offer $1000 worth of FREE customization at the time of purchase.
Feedback From Our Clients


 USA (+1) 351-333-4748

