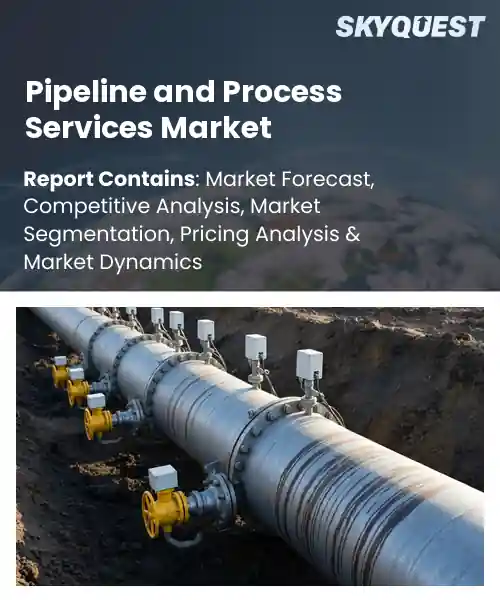
Pipeline and Process Services Market
Report ID: SQMIG10B2163
Report ID: SQMIG10B2163
[email protected]
USA +1 351-333-4748
Report ID:
SQMIG10B2163 |
Region:
Global |
Published Date: May, 2026
Pages:
157
|Tables:
187
|Figures:
79


Global Pipeline And Process Services Market size was valued at USD 3.95 Billion in 2024 and is poised to grow from USD 4.17 Billion in 2025 to USD 6.44 Billion by 2033, growing at a CAGR of 5.59% during the forecast period (2026-2033).
High demand for secure energy transportation, increasing investments in pipeline infrastructure maintenance, rising adoption of digital integrity management technologies, expansion of oil and gas transportation networks, and growing focus on operational safety and environmental protection are driving demand for pipeline and process services.
The increased use of condition-based maintenance systems, digitized inspection systems, and hydrogen-ready retrofits will also contribute to driving the demand for pipeline and process services. There has been increasing investment by pipeline operators and engineering firms in technologies for predictive maintenance, inline inspections, and robotics for repair in a bid to minimize unexpected shutdowns, cut down maintenance costs, and achieve regulatory compliance. Rising investments in aging pipeline rehabilitation, shale gas infrastructure development, and decarbonization-driven pipeline repurposing projects are further creating new commercialization opportunities. Growing need for reliable and cost-efficient transportation of oil, gas, and petrochemical products around the world coupled with increasing emphasis on asset integrity and operational safety are expected to primarily drive pipeline and process services market growth.
Contrastingly, high costs associated with advanced inspection and repair technologies, volatility in oil and gas investments, operational challenges in remote and offshore environments, and stringent environmental and regulatory compliance requirements are anticipated to slow down pipeline and process services market penetration over the coming years.
How is AI Improving Operational Efficiency In Pipeline And Process Services?
The use of AI is making pipeline and process services operations more efficient through transforming information generated by sensors and historical data on operations into maintenance and monitoring intelligence. AI technology makes it possible to detect pipeline leaks and integrity problems faster and simulate any maintenance operation before actual operations take place. In addition, AI enhances the inspection process of pipeline systems through automation through the use of drones and computer vision. The aging pipeline infrastructure and increasing safety regulations have made it necessary for companies to make operational decisions faster and accurately. Through the application of AI, there has been increased adoption of autonomous pigging data analytics, drone inspections, and AI-assisted asset management solutions.
Market snapshot - (2026-2033)
Global Market Size
USD 3.95 Billion
Largest Segment
Pipeline Inspection Services
Fastest Growth
Process Optimization Services
Growth Rate
5.59% CAGR
To get more insights on this market click here to Request a Free Sample Report
Global pipeline and process services market is segmented by service type, application, pipeline type, end-use industry, location type, operation type, and region. Based on service type, the market is segmented into pipeline inspection services, pipeline cleaning services, hydrotesting services, nitrogen purging services, dewatering & drying services, chemical cleaning services, leak detection services, process optimization services, and others. Based on application, the market is segmented into pipeline commissioning, pipeline maintenance, refinery operations, petrochemical processing, gas processing operations, power plant operations, and others. Based on pipeline type, the market is segmented into crude oil pipelines, natural gas pipelines, refined product pipelines, water pipelines, chemical pipelines, and others. Based on end-use industry, the market is segmented into oil & gas, petrochemical, power generation, water & wastewater, chemical industry, mining, and others. Based on location type, the market is segmented into onshore pipelines and offshore pipelines. Based on operation type, the market is segmented into pre-commissioning services, maintenance services, and decommissioning services. Based on region, the market is segmented into North America, Europe, Asia Pacific, Latin America, and Middle East & Africa.
The pipeline inspection services segment is expected to account for the highest global pipeline and process services market share. Its primary role in defect identification and threat detection means that it occupies a critical position in minimizing risks in commissioning, maintenance, and operations. The use of sophisticated NDT techniques makes it possible to identify corrosion, cracks, and weld imperfections, thus allowing for prompt intervention and avoiding total failure. Risk minimization in terms of safety and the associated management of risks by operators makes it important.
However, leak detection services is emerging as the most rapidly expanding segment as per this pipeline and process services market forecast. Increased pressure from environmental regulations along with increased focus on emissions control in operations fuels the need for continuous monitoring systems. The evolution of distributed sensing and real-time analytics allows for faster detection and reaction times and gives rise to recurring services and creates opportunities in areas such as preventative maintenance.
The process optimization services segment is anticipated to spearhead the global pipeline and process services market revenue generation through 2033. Its focus on balancing flows, mitigating bottlenecks, and minimizing life-cycle costs makes optimization highly valuable to operators seeking to increase their margins and efficiency. Using analytical techniques such as model-based control and predictive maintenance, among others, optimization service providers help operators use operational data to optimize processes and increase their efficiency and throughput rates. Compliance issues further cement optimization as an ongoing concern for operators.
On the contrary, nitrogen purging services has been gaining prominence as being the fastest growing segment due to increased emphasis on clean and safe commissioning and maintenance. The development of on-site nitrogen generators and improved safety protocols have contributed to faster completion and minimized the possibility of contamination, thereby resulting in more commercial opportunities for this sector.
To get detailed segments analysis, Request a Free Sample Report
Advanced industrial infrastructure, deep technical expertise, and a mature regulatory and commercial environment that supports complex projects are helping cement the dominance of this region. Integrated services offered by established service providers allow for seamless project lifecycle delivery when completing projects. Robust capital markets enable companies to build operational resilience, resulting in a greater likelihood that companies will utilize advanced inspection technologies and specialized fabrication capabilities. Collaborative relationships between operators, service company, and technology developers promote both innovation and standardization while providing access to a deep talent base and a wide range of supply chain networks to support quick mobilization of projects. These factors all combine to provide competitive advantages that support North America’s position as a leader in large and technically challenging pipeline and process service initiatives.
Pipeline and process services market in the United States is characterized by a concentration of integrated service providers, advanced inspection and integrity practices, and strong collaboration between operators and technology firms. There is a high emphasis on operational reliability, safety protocols, and regulatory compliance, which drives demand for specialized maintenance, repair, and modernization services. The ecosystem supports large-scale project execution, innovation adoption, and development of skilled workforce resources capabilities.
Wide geographic service network, emphasis on environmental stewardship and collaborative approaches among operators and suppliers are helping create new opportunities in Canada. Service providers concentrate on maintaining safety excellence and regulatory compliance as well as nurturing talent locally, which helps them operate in a robust manner. The demands lie in lifecycle integrity management, remote monitoring, and maintenance practices that consider different landscapes and climates.
Accelerating industrial modernization, growing energy and petrochemical initiatives, and increased investment in infrastructure resilience are helping create new opportunities in the region. Operators and service providers are adopting new and advanced inspection, digital monitoring, and asset integrity solutions to be able to manage complex networks and improve the efficiency of their operations. The local supply chain is becoming more mature and has created the ability to localize fabrication, maintenance, and engineering. Energy security and emission management are policy priorities which are driving upgrades and retrofits, as well as providing opportunities through strategic partnerships with global technology vendors to share knowledge and expertise. The level of project activity, combined with new skilled labor and focused training and development, positions the Asia Pacific region as a vibrant growth engine for comprehensive pipeline and process service solutions. The market ecosystems in this region are placing an emphasis on safety and quality assurance.
Pipeline and process services market in Japan centers on precision engineering, advanced inspection technologies, and stringent safety standards. Service providers prioritize lifecycle integrity, predictive maintenance, and integration of digital diagnostics to support complex refinery and petrochemical operations. Collaboration between equipment manufacturers and specialized service firms yields tailored solutions, while a skilled technical workforce and regulatory focus uphold high-quality execution and continuous improvement across sectors.
Strong manufacturing base, rapid adoption of digital monitoring platforms, and focus on operational optimization are boosting demand for pipeline and process services in South Korea. Workforce development and regulatory coordination improve safety and project execution. Petrochemical and industrial sectors benefit from comprehensive maintenance, inspection, and upgrading packages. Cooperation with technology companies enables advanced non-destructive testing and diagnostics. Efficiency and resilience have been at the heart of pipeline and process services companies.
Harmonizing regulatory frameworks, investing in modernization of aging infrastructure and fostering cross-border collaboration among operators and service providers are helping boost demand for pipeline and process services in the region. Emphasis on safety, environmental performance and asset integrity bolsters the demand for inspection, rehabilitation and lifecycle management. Through the development of technical excellence centers, advanced materials expertise and digital solutions development, the regional leaders have enabled businesses to build resiliency in their local supply chains. The major public and private stakeholders are placing high importance on implementation of retrofit programs, developing workforce skill sets, and standardizing processes to increase efficiency in project delivery. Year on year investment in R&D and partnering of engineering companies with universities is speeding up the development of robotics for inspection, materials science and analytical platforms. Training initiatives and skilled workforce mobility are allowing for knowledge transfer and practical application across borders.
Pipeline and process services market in Germany is defined by engineering excellence, strict standards and a robust manufacturing base supporting fabrication and inspection capabilities. Service firms emphasize quality execution, materials expertise and integration of digital monitoring to manage complex industrial networks. Collaboration among operators, research institutions, and technology providers drives innovation. The market focuses on safety, regulatory compliance and lifecycle optimization, enabling reliable service delivery and skilled workforce across sectors.
Pipeline and process service demand in the United Kingdom is supported by a mature service sector, well established engineering consultancies and strong capabilities in integrity management. Providers integrate inspection, maintenance, and rehabilitation services with digital asset monitoring to meet energy and industrial needs. Regulatory guidance and industry bodies reinforce safety and standardization, and collaborative ventures foster technology transfer and skills development. The market displays adaptability, depth, and commitment to operational continuity.
Adoption of pipeline and process services in France emphasizes strong engineering capabilities, innovation in inspection technologies and focus on environmental stewardship. Service providers specialize in integrity management, rehabilitation and maintenance solutions for industrial and energy clients. Collaboration between research institutes, operators, and specialized firms supports development of advanced diagnostics and materials expertise. The market prioritizes regulatory alignment, safety excellence and lifecycle performance to ensure durable and dependable pipeline and process operations.
To know more about the market opportunities by region and country, click here to
Buy The Complete Report
Infrastructure Renewal and Expansion
Technological Advances In Inspection
Skilled Labor Shortage and Retention
Regulatory Compliance Complexity
Request Free Customization of this report to help us to meet your business objectives.
Competitive landscape in global pipeline and process services is shaped by consolidation through targeted M&A and by technology led moves from startups and incumbents. Large firms acquire specialist asset integrity teams for inspection capability, exemplified by Baker Hughes acquisition of Quest Integrity, while startups push analytics and sensing innovations such as Project Canary's Canary Carbon Portal and PipelineSentry's pipeline digital twin to win operator partnerships and regulatory compliance contracts.
SkyQuest’s ABIRAW (Advanced Business Intelligence, Research & Analysis Wing) is our Business Information Services team that Collects, Collates, Correlates, and Analyses the Data collected by means of Primary Exploratory Research backed by robust Secondary Desk research.
As per SkyQuest analysis, high demand for secure and cost-efficient energy transportation and increasing investments in pipeline integrity management are anticipated to drive the demand for pipeline and process services going forward. However, high costs associated with advanced inspection technologies and volatility in oil and gas investments are slated to slow down the adoption of pipeline and process services in the future. North America is slated to spearhead the demand for pipeline and process services owing to extensive aging pipeline infrastructure, rising shale gas development activities, and strong adoption of digital integrity management technologies. Development of AI-enabled predictive maintenance platforms and increasing integration of robotic inspection and smart monitoring technologies are anticipated to be key trends driving the pipeline and process services sector through 2033 and beyond.
| Report Metric | Details |
|---|---|
| Market size value in 2024 | USD 3.95 Billion |
| Market size value in 2033 | USD 6.44 Billion |
| Growth Rate | 5.59% |
| Base year | 2024 |
| Forecast period | (2026-2033) |
| Forecast Unit (Value) | USD Billion |
| Segments covered |
|
| Regions covered | North America (US, Canada), Europe (Germany, France, United Kingdom, Italy, Spain, Rest of Europe), Asia Pacific (China, India, Japan, Rest of Asia-Pacific), Latin America (Brazil, Rest of Latin America), Middle East & Africa (South Africa, GCC Countries, Rest of MEA) |
| Companies covered |
|
| Customization scope | Free report customization with purchase. Customization includes:-
|
To get a free trial access to our platform which is a one stop solution for all your data requirements for quicker decision making. This platform allows you to compare markets, competitors who are prominent in the market, and mega trends that are influencing the dynamics in the market. Also, get access to detailed SkyQuest exclusive matrix.
Table Of Content
Executive Summary
Market overview
Parent Market Analysis
Market overview
Market size
KEY MARKET INSIGHTS
COVID IMPACT
MARKET DYNAMICS & OUTLOOK
Market Size by Region
KEY COMPANY PROFILES
Methodology
For the Pipeline and Process Services Market, our research methodology involved a mixture of primary and secondary data sources. Key steps involved in the research process are listed below:
1. Information Procurement: This stage involved the procurement of Market data or related information via primary and secondary sources. The various secondary sources used included various company websites, annual reports, trade databases, and paid databases such as Hoover's, Bloomberg Business, Factiva, and Avention. Our team did 45 primary interactions Globally which included several stakeholders such as manufacturers, customers, key opinion leaders, etc. Overall, information procurement was one of the most extensive stages in our research process.
2. Information Analysis: This step involved triangulation of data through bottom-up and top-down approaches to estimate and validate the total size and future estimate of the Pipeline and Process Services Market.
3. Report Formulation: The final step entailed the placement of data points in appropriate Market spaces in an attempt to deduce viable conclusions.
4. Validation & Publishing: Validation is the most important step in the process. Validation & re-validation via an intricately designed process helped us finalize data points to be used for final calculations. The final Market estimates and forecasts were then aligned and sent to our panel of industry experts for validation of data. Once the validation was done the report was sent to our Quality Assurance team to ensure adherence to style guides, consistency & design.
Analyst Support
Customization Options
With the given market data, our dedicated team of analysts can offer you the following customization options are available for the Pipeline and Process Services Market:
Product Analysis: Product matrix, which offers a detailed comparison of the product portfolio of companies.
Regional Analysis: Further analysis of the Pipeline and Process Services Market for additional countries.
Competitive Analysis: Detailed analysis and profiling of additional Market players & comparative analysis of competitive products.
Go to Market Strategy: Find the high-growth channels to invest your marketing efforts and increase your customer base.
Innovation Mapping: Identify racial solutions and innovation, connected to deep ecosystems of innovators, start-ups, academics, and strategic partners.
Category Intelligence: Customized intelligence that is relevant to their supply Markets will enable them to make smarter sourcing decisions and improve their category management.
Public Company Transcript Analysis: To improve the investment performance by generating new alpha and making better-informed decisions.
Social Media Listening: To analyze the conversations and trends happening not just around your brand, but around your industry as a whole, and use those insights to make better Marketing decisions.
REQUEST FOR SAMPLE
 REQUEST FREE CUSTOMIZATION
Global Pipeline And Process Services Market size was valued at USD 3.95 Billion in 2024 and is poised to grow from USD 4.17 Billion in 2025 to USD 6.44 Billion by 2033, growing at a CAGR of 5.59% during the forecast period (2026-2033).
Competitive landscape in global pipeline and process services is shaped by consolidation through targeted M&A and by technology led moves from startups and incumbents. Large firms acquire specialist asset integrity teams for inspection capability, exemplified by Baker Hughes acquisition of Quest Integrity, while startups push analytics and sensing innovations such as Project Canary's Canary Carbon Portal and PipelineSentry's pipeline digital twin to win operator partnerships and regulatory compliance contracts. 'T.D. Williamson', 'Baker Hughes', 'SLB', 'Halliburton', 'ROSEN Group', 'NDT Global', 'Penspen', 'STATS Group', 'EnerMech', '3P Services', 'Enduro Pipeline Services', 'LIN SCAN', 'CIRCOR International', 'IKM Gruppen', 'Hydratight', 'Dacon Inspection Services', 'Romstar Group', 'Pure Technologies', 'Geo Corr Consult', 'Halfwave'
Renewal of aging pipeline networks and expansion of processing capacity drive demand for comprehensive pipeline and process services by creating sustained requirements for inspection, rehabilitation, and replacement activities. Operators prioritize proactive integrity management to avoid failures and maintain supply reliability, which elevates spending on specialized maintenance and project execution services. The need to integrate upgrades within live operations further increases demand for skilled service providers, encouraging market participants to expand offerings and invest in capabilities that support safe, efficient asset modernization and long-term operational resilience.
Digital Twin Integration: Digital twin platforms are accelerating operational visibility across pipeline and process assets, enabling real time simulation, condition monitoring and lifecycle planning. By harmonizing sensor feeds, engineering models and maintenance histories, operators can prioritize interventions, anticipate degradation and coordinate cross functional teams effectively. Integration fosters supplier collaboration, reduces unplanned disruptions and supports design improvements. Emphasis on interoperable data architectures and scalable analytics is encouraging wider adoption, shifting service delivery from reactive repairs toward value advisory engagements centered around asset performance optimization.
Why does North America Dominate the Global Pipeline and Process Services Market? |@12


Want to customize this report? This report can be personalized according to your needs. Our analysts and industry experts will work directly with you to understand your requirements and provide you with customized data in a short amount of time. We offer $1000 worth of FREE customization at the time of purchase.
Feedback From Our Clients


 USA (+1) 351-333-4748

