Metabolomics Market
Report ID: SQMIG35H2164
Report ID: SQMIG35H2164
sales@skyquestt.com
USA +1 351-333-4748
Report ID:
SQMIG35H2164 |
Region:
Global |
Published Date: December, 2025
Pages:
219
|Tables:
64
|Figures:
75


Metabolomics Market size was valued at USD 4.67 Billion in 2024 and is poised to grow from USD 5.31 Billion in 2025 to USD 14.95 Billion by 2033, growing at a CAGR of 13.8% during the forecast period (2026–2033).
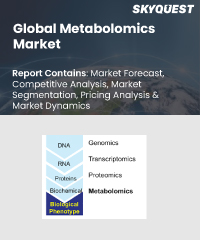
The increase in the metabolomics adoption in precision medicine and the advancements in diagnostics to determine chronic conditions propel metabolomics market growth during the forecast period. R&D expenditures in the pharmaceutical and biopharmaceutical industries and technological improvements in analytical techniques are anticipated to spur market growth. Metabolomics is the systemic identification and quantification of all metabolites within a given organism or biological sample. Nuclear magnetic resonance spectroscopy and mass spectrometry provide enhanced resolution combined with powerful chemometric software allowing the simultaneous determination and comparison of thousands of chemical entities, leading to an expansion of small molecule biochemistry studies in bacteria, plants and mammals. Targeted and untargeted metabolomics services represent the two major types of metabolomics services offered. Advancements in analytical methods continue to uncover novel metabolites and pathways improving our understanding of metabolic dysregulation in disease.
Metabolomics has proven pivotal for customizing medical care by illuminating a person's metabolic signature. This allows precise determination, therapy selection, and tailored health management. Chronic conditions such as diabetes, heart disease, and cancers are increasingly common, creating demand for metabolomics. It enables in anticipating illness, assessing vulnerability, and tracking troubles through studying metabolic indicators, which is catalyzing in metabolomics market size. Furthermore, metabolomics sheds light on multifaceted interactions between one's makeup and surroundings, advancing precision at each phase from prevention to recovery. By unveiling fluctuations preceding symptoms, it may predict potential issues and mitigate issues beforehand through optimized diets or habits. Overall, metabolomics plays a transformative role in driving personalized approaches throughout healthcare.
Market snapshot - 2026-2033
Global Market Size
USD 4.1 billion
Largest Segment
Fastest Growth
Growth Rate
13.8% CAGR
To get more insights on this market click here to Request a Free Sample Report
Global Metabolomics Market is segmented by Product, Bioinformatics Tools and Services, Application, Indication, End User, Company Type and region. Based on Product, the market is segmented into Metabolomics Instruments, Separation Tools and Detection Tools. Based on Bioinformatics Tools and Services, the market is segmented into Bioinformatics Services and Bioinformatics Tools and Databases. Based on Application, the market is segmented into Biomarker discovery, Drug discovery, Toxicology testing, Nutrigenomics, Functional Genomics, Personalized medicine and Other Applications. Based on Indication, the market is segmented into Cancer, Cardiovascular Disorders, Neurological Disorders, Metabolic Disorders, Inborn Errors of Metabolism and Other Indications. Based on End User, the market is segmented into Academic and Research Institutes, Pharmaceutical & Biotechnology Companies, Contract Research Organizations and Other End Users. Based on Company Type, the market is segmented into Tier 1 Pharmaceutical Companies, Tier 2 Pharmaceutical Companies and Tier 3 Pharmaceutical Companies. Based on region, the market is segmented into North America, Europe, Asia Pacific, Latin America and Middle East & Africa.
Metabolomic instruments are currently dominating the market with the largest metabolomics market share. These devices enable detection and screening of metabolites to better match requirements to ongoing research efforts, fueling revenue of metabolomics market growth. However, bioinformatics tools and services that aid in analysis and interpretation of complex metabolomics data are rising in importance. Technological developments including miniaturization, automation, and integration of computer systems have advanced scientific instruments considerably, allowing more sensitive and high-throughput metabolite profiling. Such improvements paired with expanding healthcare infrastructures in developing regions have enhanced disease diagnosis and treatment prospects, especially regarding nutraceuticals and personalized medicine through metabolomics profiling.
Metabolomics bioinformatic tools and services is witnessing the fastest growth with increasing metabolomics market size. The demand for metabolomics bioinformatic tools and services was largely fueled by the complexity and enormity of data created in metabolomics research. Metabolomics experiments generated immense datasets holding intricate molecular specifics, rendering data examination and interpretation an immense struggle. In addition, metabolomics bioinformatic tools and services were crucial to process, oversee, and extract meaningful insights from this wealth of information, leading to the growth of the metabolomics industry. To leverage the full potential of metabolomics data, researchers required sophisticated software remedies and specialist services that could handle data pre-processing, statistical evaluation, pathway mapping, and biomarker identification. As metabolomics continues to broaden its applications in diverse fields, the demand for bioinformatic tools and services is established to rise, allowing researchers to unlock the valuable facts hidden within their datasets.
According to metabolomics market analysis, the drug discovery application is dominating the market. This growth is due to the increasing interest of metabolomics in biomarkers and drug discovery applications based on its unique property to reveal novel biomarkers and therapeutic targets. Metabolomics enables researchers to explore the biochemical landscape of an organism at unprecedented depth, allowing characterization of metabolic alterations related to diseases and drug responses that go undetected by other omics technologies. This ability has enormous relevance for biomarker discovery, as metabolomics can identify well-defined metabolites that indicate the presence of a disease or its progression or response to treatment. Metabolomics is also essential in drug discovery to better characterize mechanisms of actions, and the safety profile potential drug candidates by revealing their metabolic consequences. Metabolomics accelerates the discovery of drug targets, speeds up the development of new therapies, and reduces drug failures at later clinical stages.
As per metabolomics market forecast, personalized medicine market is projected to witness the fastest growth with a rapid increase in the metabolomics market share. The shift to personalized medicine has triggered an increased focus on metabolomics because the variability in metabolic phenotypes can reveal individual differences. This ability is important for developing treatment approaches and maximizing successful outcomes since it would be personalized to the individual patient's unique biochemical composition. The popularity of personalized medicine is massively increasing among patients and physicians. These factors are increasing the demand of this segment, resulting in the metabolomics market growth.
To get detailed segments analysis, Request a Free Sample Report
According to metabolomics market analysis, North America is dominating with the largest metabolomic market share. The region has a well-developed healthcare infrastructure, including prominent research institutions, biotechnology and life science companies, and academic centers. This platform enables high-end, leading-edge research and development in metabolomics through next-generation technologies and approaches. There are large investments in biomedical research in North America, especially government funding but also from the private sector. Such investments fuel an ongoing innovation cycle in metabolomics, which creates new biomarkers, diagnostics and therapeutic approaches. The focus on personalized medicine and precision healthcare in the region is another driver for the uptake of metabolomics technologies. Metabolomics is essential for the comprehension of disease mechanisms, for biomarker discovery and also to address individualized treatment strategies.
Asia Pacific is expected to witness the fastest growth rate during the metabolomics market forecast period. The region is witnessing growing economic development, higher health care expenses and enhanced research and development activities. In addition, countries such as China, Japan and India have incurred heavy investments in the fields of biotechnology and life sciences causing academic & research institutes to expand or new innovative startups to emerge. Factors such as the increasing prevalence of chronic diseases, growing awareness regarding personalized medicine, and rising demand for advanced healthcare technology are expected to bolster the uptake of metabolomics in North America. Over the next few years, Asia Pacific is pegged as one of the lucrative regional markets for precision medicine due to rising investment in research infrastructure and initiatives.
To know more about the market opportunities by region and country, click here to
Buy The Complete Report
Growing Application of Metabolomics in Personalized Medicine
Growing Funding of Metabolomics Research Projects
Data Processing Issues
Evolving Regulations and Legislature
Request Free Customization of this report to help us to meet your business objectives.
The global metabolomics industry displays a competitive landscape driven by the presence of both the prominent players and growing companies. Major firms maintain a competitive presence with a wide range of metabolomics instruments, software and services. Moreover, academic and research institutes play a large role within the metabolomics space by creating (novel) metabolomics technologies and methodologies as well as collaborations with industry. Increasing number of startups offering niche metabolomics specific tools and services are also gaining traction in the market, increasing the level of competition and driving growth. In addition, due to the global nature of the market, it is also regional in nature with players focusing on specific geographic preferences and regulations.
SkyQuest's ABIRAW (Advanced Business Intelligence, Research & Analysis Wing) is our Business Information Services team that Collects, Collates, Correlates, and Analyses the Data collected by means of Primary Exploratory Research backed by robust Secondary Desk research.
As per SkyQuest analysis, the growth of the metabolomics industry is attributed to rise in demand for personalized medicine, increase in prevalence of chronic diseases, rise in utilization of metabolomics approaches and drug discovery, surge in investment of R&D activities by government bodies & organizations and presence or launch innovative analytical instruments & software. Metabolomics is the molecular study of small compounds (metabolites) found in living organisms, biofluids, tissues or cells. Several companies are presently providing new-generation metabolomics solutions. With developers continuously working towards enhancing their products and services, the application of metabolomics is always changing. In addition, rising collaborations and partnership between healthcare entities and research institutes to enhance metabolomics research while reducing the associated risk factors is expected to reflect positively on market growth.
| Report Metric | Details |
|---|---|
| Market size value in 2024 | USD 4.67 Billion |
| Market size value in 2033 | USD 14.95 Billion |
| Growth Rate | 13.8% |
| Base year | 2024 |
| Forecast period | 2026-2033 |
| Forecast Unit (Value) | USD Billion |
| Segments covered |
|
| Regions covered | North America (US, Canada), Europe (Germany, France, United Kingdom, Italy, Spain, Rest of Europe), Asia Pacific (China, India, Japan, Rest of Asia-Pacific), Latin America (Brazil, Rest of Latin America), Middle East & Africa (South Africa, GCC Countries, Rest of MEA) |
| Companies covered |
|
| Customization scope | Free report customization with purchase. Customization includes:-
|
To get a free trial access to our platform which is a one stop solution for all your data requirements for quicker decision making. This platform allows you to compare markets, competitors who are prominent in the market, and mega trends that are influencing the dynamics in the market. Also, get access to detailed SkyQuest exclusive matrix.
Table Of Content
Executive Summary
Market overview
Parent Market Analysis
Market overview
Market size
KEY MARKET INSIGHTS
COVID IMPACT
MARKET DYNAMICS & OUTLOOK
Market Size by Region
KEY COMPANY PROFILES
Methodology
For the Metabolomics Market, our research methodology involved a mixture of primary and secondary data sources. Key steps involved in the research process are listed below:
1. Information Procurement: This stage involved the procurement of Market data or related information via primary and secondary sources. The various secondary sources used included various company websites, annual reports, trade databases, and paid databases such as Hoover's, Bloomberg Business, Factiva, and Avention. Our team did 45 primary interactions Globally which included several stakeholders such as manufacturers, customers, key opinion leaders, etc. Overall, information procurement was one of the most extensive stages in our research process.
2. Information Analysis: This step involved triangulation of data through bottom-up and top-down approaches to estimate and validate the total size and future estimate of the Metabolomics Market.
3. Report Formulation: The final step entailed the placement of data points in appropriate Market spaces in an attempt to deduce viable conclusions.
4. Validation & Publishing: Validation is the most important step in the process. Validation & re-validation via an intricately designed process helped us finalize data points to be used for final calculations. The final Market estimates and forecasts were then aligned and sent to our panel of industry experts for validation of data. Once the validation was done the report was sent to our Quality Assurance team to ensure adherence to style guides, consistency & design.
Analyst Support
Customization Options
With the given market data, our dedicated team of analysts can offer you the following customization options are available for the Metabolomics Market:
Product Analysis: Product matrix, which offers a detailed comparison of the product portfolio of companies.
Regional Analysis: Further analysis of the Metabolomics Market for additional countries.
Competitive Analysis: Detailed analysis and profiling of additional Market players & comparative analysis of competitive products.
Go to Market Strategy: Find the high-growth channels to invest your marketing efforts and increase your customer base.
Innovation Mapping: Identify racial solutions and innovation, connected to deep ecosystems of innovators, start-ups, academics, and strategic partners.
Category Intelligence: Customized intelligence that is relevant to their supply Markets will enable them to make smarter sourcing decisions and improve their category management.
Public Company Transcript Analysis: To improve the investment performance by generating new alpha and making better-informed decisions.
Social Media Listening: To analyze the conversations and trends happening not just around your brand, but around your industry as a whole, and use those insights to make better Marketing decisions.
REQUEST FOR SAMPLE
 REQUEST FREE CUSTOMIZATION


Want to customize this report? This report can be personalized according to your needs. Our analysts and industry experts will work directly with you to understand your requirements and provide you with customized data in a short amount of time. We offer $1000 worth of FREE customization at the time of purchase.
Feedback From Our Clients

 USA (+1) 351-333-4748
