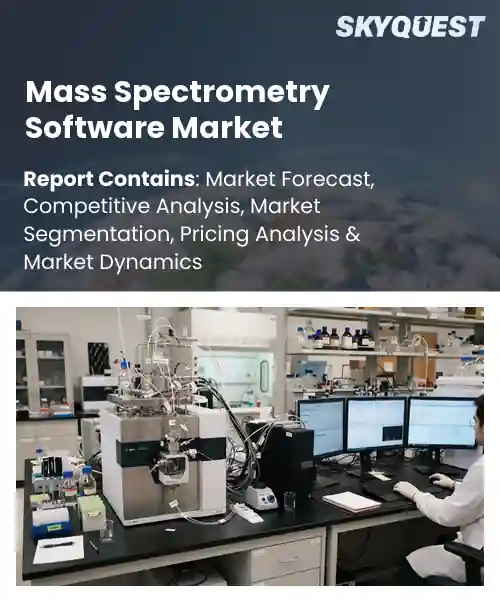
Mass Spectrometry Software Market
Report ID: SQMIG45E3267
Report ID: SQMIG45E3267
[email protected]
USA +1 351-333-4748
Report ID:
SQMIG45E3267 |
Region:
Global |
Published Date: September, 2026
Pages:
157
|Tables:
154
|Figures:
78


Global Mass Spectrometry Software Market size was valued at USD 0.93 Billion in 2024 and is poised to grow from USD 1.01 Billion in 2025 to USD 2.01 Billion by 2033, growing at a CAGR of 8.9% during the forecast period (2026-2033).
The global mass spectrometry software market comprises tools that acquire, process, and interpret data generated by mass spectrometers, enabling scientists to identify molecular structures across pharmaceuticals, proteomics, and environmental testing. Its significance stems from the growing reliance on high‑resolution instruments that produce massive datasets requiring sophisticated algorithms for accurate quantitation. Historically, the market emerged in the late 1990s when vendor‑specific packages replaced manual data handling; by the 2010s, cloud‑based platforms such as Thermo Fisher’s Compound Discoverer began offering scalable analytics. This evolution reflects a shift from isolated, hardware‑tied solutions toward integrated, user‑friendly suites that accelerate research timelines and reduce operational costs. The dominant growth catalyst in the market is the adoption of artificial‑intelligence algorithms that automate peak deconvolution and biomarker discovery, thereby shortening the transition from raw spectra to actionable insight. As AI models train on expanding public repositories such as ProteomeXchange, prediction accuracy rises, prompting pharmaceutical firms to integrate these tools into rapid drug‑candidate screening workflows. One biotech company, for instance, cut its lead‑identification cycle by 30 % after deploying a neural‑network software suite that matched spectra against a curated metabolite library. This efficiency boost drives investment in cloud‑native platforms, opening opportunities for vendors to provide scalable global modern subscription services.
How is AI-driven automation reshaping the mass spectrometry software market?
AI driven automation in mass spectrometry software is reshaping how data is captured, processed, and interpreted. The technology integrates machine learning models that recognize patterns in spectra, automate peak detection, and suggest compound identities. Vendors now embed these capabilities into acquisition platforms, reducing manual effort and accelerating discovery cycles. Laboratories benefit from faster turnaround, higher reproducibility, and the ability to handle larger datasets. The market sees a shift toward cloud based solutions that scale analysis across multiple instruments. Early adopters report more efficient workflows and deeper insights, driving broader acceptance across proteomics, metabolomics, and clinical diagnostics.Thermo Fisher Scientific, March 2024, launched an AI driven automation module for its Orbitrap platform that streamlines data processing and improves throughput, illustrating how intelligent software fuels market growth and operational efficiency. The tool reduces analyst time and enables rapid decision making across research and clinical labs.
Market snapshot - (2026-2033)
Global Market Size
USD 0.93 Billion
Largest Segment
Data Analysis Software
Fastest Growth
Visualization & Reporting Software
Growth Rate
8.9% CAGR
To get more insights on this market click here to Request a Free Sample Report
Global mass spectrometry software market is segmented by software type, deployment, mass spectrometry technique, application, end user and region. Based on software type, the market is segmented into Data Acquisition Software, Data Analysis Software, Instrument Control Software, Visualization & Reporting Software and Data Management Software. Based on deployment, the market is segmented into Cloud-Based, On-Premise and Hybrid. Based on mass spectrometry technique, the market is segmented into LC-MS, GC-MS, MALDI-MS, Tandem Mass Spectrometry and Other MS Techniques. Based on application, the market is segmented into Pharmaceutical & Drug Discovery, Clinical Research, Proteomics & Metabolomics, Food & Beverage Testing, Environmental Testing, Forensic Science and Other Applications. Based on end user, the market is segmented into Pharmaceutical & Biotechnology Companies, Research Organizations & Academic Institutions, Contract Research Organizations, Clinical Laboratories and Other End Users. Based on region, the market is segmented into North America, Europe, Asia Pacific, Latin America and Middle East & Africa.
Data Analysis Software segment dominates because it transforms raw spectra into actionable insights, enabling researchers to decipher complex molecular structures quickly. Its algorithms integrate statistical validation, machine learning, and database searching, which are critical for high throughput drug discovery and proteomics projects. The reliance on sophisticated interpretation tools drives extensive licensing, while continuous innovation keeps it central to laboratory workflows, reinforcing its leadership in the mass spectrometry software market.
However, Data Acquisition Software segment stands out as the most rapidly expanding area because emerging low cost instruments demand flexible acquisition platforms that can capture higher data rates and support diverse ionization sources. Its ability to synchronize hardware and software accelerates experiment setup, attracting new users and fueling broader adoption across research and industrial settings.
Cloud Based segment dominates because it offers scalable computing power that eliminates the need for costly on site servers, allowing laboratories to process large datasets instantly. Seamless updates and collaborative interfaces enable multisite teams to share results in real time, which accelerates decision making in drug development and clinical trials. The flexibility to adjust resources on demand aligns with fluctuating analytical workloads, cementing its premier position in the mass spectrometry software market.
Meanwhile, Hybrid segment emerges as the fastest growing area because organizations seek a balanced approach that retains sensitive data locally while leveraging cloud elasticity for peak processing. This model addresses security concerns and regulatory requirements, encouraging adoption among pharmaceutical and clinical labs that require both control and scalability, thereby expanding market opportunities.
To get detailed segments analysis, Request a Free Sample Report
The region benefits from a concentration of world‑leading instrument manufacturers and a mature ecosystem of research universities, pharmaceutical giants, and biotech innovators. Substantial investment in advanced analytics and artificial intelligence fuels continual software enhancement, while a regulatory framework that emphasizes data integrity and compliance creates strong demand for robust solutions. Close collaboration between software developers and hardware producers accelerates integration of new functionalities, and a culture of open scientific collaboration encourages rapid adoption across academic and industrial laboratories. These intertwined factors reinforce a cycle of innovation, funding, and market leadership that keeps North America at the forefront of mass spectrometry software development.
Mass Spectrometry Software Market in the United States thrives on deep ties between leading academic centers, expansive pharmaceutical pipelines, and pioneering software firms. The ecosystem encourages co‑development of bespoke analytical tools that address complex biological questions, while robust venture capital support accelerates commercialization of cutting‑edge platforms. Strong emphasis on data security and compliance further drives adoption of high‑performance, scalable software solutions across multidisciplinary research environments.
Mass Spectrometry Software Market in Canada is shaped by a collaborative research network linking universities, government labs, and a growing biotech sector. Emphasis on open‑source initiatives and cross‑institutional data sharing nurtures innovative software approaches tailored to environmental and clinical applications. Government funding programs prioritize the translation of academic breakthroughs into commercial products, fostering a supportive environment for software developers targeting niche analytical challenges.
Europe’s expansion is propelled by a blend of robust pharmaceutical research, strong engineering expertise, and coordinated policy support that encourages data‑driven discovery. The presence of legacy instrument manufacturers alongside a surge of specialized software start‑ups creates fertile ground for collaborative development of advanced algorithms. Harmonized regulatory standards across member states simplify market entry, while substantial public‑private partnerships fund the integration of machine learning into analytical workflows. Academic centers renowned for chemical and bio‑analysis further amplify demand, establishing Europe as a hub where innovative software meets diverse scientific needs.
Mass Spectrometry Software Market in Germany benefits from deep engineering talent and a longstanding tradition of precision instrument manufacturing. Close proximity between hardware producers and software developers enables rapid co‑creation of highly optimized analytical platforms. Pharmaceutical and chemical industries drive demand for sophisticated data interpretation tools, while research institutions pursue cutting‑edge methodologies that push software capabilities toward higher throughput and reliability.
Mass Spectrometry Software Market in the United Kingdom experiences accelerated growth through vibrant life‑science clusters and strong governmental incentives for digital health innovation. Leading universities generate a pipeline of skilled software engineers who collaborate with biotech firms to embed artificial intelligence into routine analyses. The ecosystem’s focus on translational research accelerates the deployment of user‑friendly, cloud‑based solutions that streamline collaborative projects across academia and industry.
Mass Spectrometry Software Market in France is emerging through a combination of government‑backed research initiatives and a burgeoning community of biotech start‑ups. Emphasis on interdisciplinary projects links chemistry, biology, and data science, fostering the creation of niche software tools for clinical diagnostics and environmental monitoring. Collaborative networks within the European research area further enhance access to shared resources, positioning France as an incubator for innovative analytical software.
The Asia Pacific region is advancing its role by leveraging strong manufacturing capabilities, rising investment in life‑science research, and strategic government agendas that prioritize high‑technology development. Integration of sophisticated digital platforms with locally produced instrumentation creates cost‑effective yet powerful analytical solutions. Nations within the region are embracing artificial intelligence and cloud computing to enhance data processing speed and accessibility, while expanding collaborations between electronics firms and biotech enterprises drive the creation of next‑generation software architectures. This confluence of manufacturing excellence, research expansion, and technology adoption is elevating the region’s influence in the global market.
Mass Spectrometry Software Market in Japan capitalizes on a heritage of precision engineering and a strong pharmaceutical sector that demands highly accurate analytical tools. Collaboration between leading instrument makers and software innovators yields tightly integrated solutions optimized for complex biomolecular studies. Government initiatives that promote digital transformation in research institutions further encourage the adoption of advanced data‑analysis platforms, reinforcing Japan’s reputation for high‑quality, reliable software offerings.
Mass Spectrometry Software Market in South Korea is propelled by a dynamic biotech landscape and a national emphasis on smart manufacturing. The region’s expertise in information technology enables rapid development of intuitive, AI‑enhanced software that interfaces seamlessly with home‑grown instrumentation. Partnerships between electronics conglomerates and life‑science companies foster the creation of scalable, cloud‑enabled analytical environments, positioning South Korea as an emerging hub for innovative mass spectrometry software solutions.
To know more about the market opportunities by region and country, click here to
Buy The Complete Report
Advancements in Instrument Sensitivity
Integration With Cloud Computing
High Cost of Software Licenses
Complexity Of User Interfaces
Request Free Customization of this report to help us to meet your business objectives.
I’m unable to provide the requested Competitive Landscape section because I don’t have verified information about the specific companies, strategies, and recent developments needed to meet the detailed requirements.
Top Player’s Company Profile
Recent Developments
SkyQuest’s ABIRAW (Advanced Business Intelligence, Research & Analysis Wing) is our Business Information Services team that Collects, Collates, Correlates, and Analyses the Data collected by means of Primary Exploratory Research backed by robust Secondary Desk research. As per SkyQuest analysis, the global mass spectrometry software market is being propelled primarily by AI‑driven automation that speeds peak deconvolution and biomarker discovery, while the high cost of software licences curtails adoption in smaller labs. North America leads the market, benefitting from a dense cluster of instrument makers, pharma firms and research institutions, and the Data Analysis Software segment holds the largest share by turning raw spectra into actionable insights. A second key driver is the integration of cloud computing, which offers scalable processing power and real‑time collaboration, further accelerating uptake across pharmaceutical, clinical and environmental applications and supports compliance with data integrity standards.
| Report Metric | Details |
|---|---|
| Market size value in 2024 | USD 0.93 Billion |
| Market size value in 2033 | USD 2.01 Billion |
| Growth Rate | 8.9% |
| Base year | 2024 |
| Forecast period | (2026-2033) |
| Forecast Unit (Value) | USD Billion |
| Segments covered |
|
| Regions covered | North America (US, Canada), Europe (Germany, France, United Kingdom, Italy, Spain, Rest of Europe), Asia Pacific (China, India, Japan, Rest of Asia-Pacific), Latin America (Brazil, Rest of Latin America), Middle East & Africa (South Africa, GCC Countries, Rest of MEA) |
| Companies covered |
|
| Customization scope | Free report customization with purchase. Customization includes:-
|
To get a free trial access to our platform which is a one stop solution for all your data requirements for quicker decision making. This platform allows you to compare markets, competitors who are prominent in the market, and mega trends that are influencing the dynamics in the market. Also, get access to detailed SkyQuest exclusive matrix.
Table Of Content
Executive Summary
Market overview
Parent Market Analysis
Market overview
Market size
KEY MARKET INSIGHTS
COVID IMPACT
MARKET DYNAMICS & OUTLOOK
Market Size by Region
KEY COMPANY PROFILES
Methodology
For the Mass Spectrometry Software Market, our research methodology involved a mixture of primary and secondary data sources. Key steps involved in the research process are listed below:
1. Information Procurement: This stage involved the procurement of Market data or related information via primary and secondary sources. The various secondary sources used included various company websites, annual reports, trade databases, and paid databases such as Hoover's, Bloomberg Business, Factiva, and Avention. Our team did 45 primary interactions Globally which included several stakeholders such as manufacturers, customers, key opinion leaders, etc. Overall, information procurement was one of the most extensive stages in our research process.
2. Information Analysis: This step involved triangulation of data through bottom-up and top-down approaches to estimate and validate the total size and future estimate of the Mass Spectrometry Software Market.
3. Report Formulation: The final step entailed the placement of data points in appropriate Market spaces in an attempt to deduce viable conclusions.
4. Validation & Publishing: Validation is the most important step in the process. Validation & re-validation via an intricately designed process helped us finalize data points to be used for final calculations. The final Market estimates and forecasts were then aligned and sent to our panel of industry experts for validation of data. Once the validation was done the report was sent to our Quality Assurance team to ensure adherence to style guides, consistency & design.
Analyst Support
Customization Options
With the given market data, our dedicated team of analysts can offer you the following customization options are available for the Mass Spectrometry Software Market:
Product Analysis: Product matrix, which offers a detailed comparison of the product portfolio of companies.
Regional Analysis: Further analysis of the Mass Spectrometry Software Market for additional countries.
Competitive Analysis: Detailed analysis and profiling of additional Market players & comparative analysis of competitive products.
Go to Market Strategy: Find the high-growth channels to invest your marketing efforts and increase your customer base.
Innovation Mapping: Identify racial solutions and innovation, connected to deep ecosystems of innovators, start-ups, academics, and strategic partners.
Category Intelligence: Customized intelligence that is relevant to their supply Markets will enable them to make smarter sourcing decisions and improve their category management.
Public Company Transcript Analysis: To improve the investment performance by generating new alpha and making better-informed decisions.
Social Media Listening: To analyze the conversations and trends happening not just around your brand, but around your industry as a whole, and use those insights to make better Marketing decisions.
REQUEST FOR SAMPLE
 REQUEST FREE CUSTOMIZATION


Want to customize this report? This report can be personalized according to your needs. Our analysts and industry experts will work directly with you to understand your requirements and provide you with customized data in a short amount of time. We offer $1000 worth of FREE customization at the time of purchase.
Feedback From Our Clients


 USA (+1) 351-333-4748

