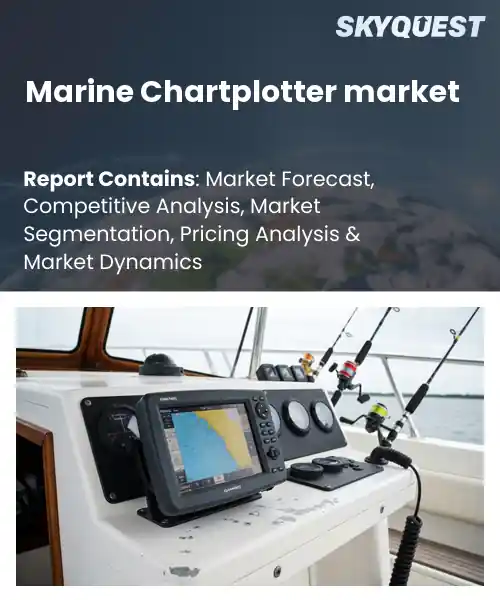
Marine Chartplotter market
Report ID: SQMIG25A2774
Report ID: SQMIG25A2774
[email protected]
USA +1 351-333-4748
Report ID:
SQMIG25A2774 |
Region:
Global |
Published Date: June, 2026
Pages:
157
|Tables:
148
|Figures:
78


Global Marine Chartplotter Market size was valued at USD 0.98 Billion in 2024 and is poised to grow from USD 1.02 Billion in 2025 to USD 1.41 Billion by 2033, growing at a CAGR of 4.1% during the forecast period (2026-2033).
Marine Chartplotter Market is an electronic navigation device that helps vessels plot accurate routes by displaying GPS positions on digital nautical charts. This is important as it enhances safety, fuel economy and compliance with IMO performance standards. The fast uptake of AIS and GNSS technologies has been the main growth driver. It has reduced the price of hardware but also has increased the accuracy of data. Early adopters like the Norwegian coastal fishing fleets in the 2010s reported operational savings of around 12 percent and larger commercial operators bought advanced plotters. Integration to satellite weather feeds over the last decade has secured market relevance.
Chart services and vessel traffic data are coming together to form a feedback loop that improves decision-making and therefore drives growth. Operators receive new depth contours and hazard alerts to re-route avoiding congestion, reducing voyage times and emissions. For example, the U.S. Gulf Coast cargo fleet began rolling out subscription-based updates to its charts in 2022, and achieved a 7 percent reduction in fuel use across 15 vessels. This model also presents opportunities for aftermarket services such as predictive maintenance analytics that utilize the data stream to extend the life of the equipment and generate recurring revenue for manufacturers.
How is AI enhancing navigation accuracy in the marine chartplotter market?
Artificial intelligence is transforming the way marine chartplotters operate, with AI learning how a vessel works from sensor data and incorporating that information into electronic charts on the fly. The units today cross-check GPS, AIS and radar inputs against machine-learning models to predict the best routes and flag anomalies before they affect a passage. It reduces the need for manual corrections, and is a safety aid, especially in congested and poorly charted waters. The technology includes an automatic chart correction, where the AI compares real time depth readings with existing maps, and recommends corrections if it finds any discrepancies. And the market is growing, with manufacturers bringing these capabilities to smaller screens to give commercial fleets and recreational sailors sophisticated navigation.
In April 2024 a major chartplotter vendor introduced an AI powered navigation system that improves position fixes and reduces drift. Increasing efficiency and supporting market growth. and sonar feedback and predictive routing to keep skippers on track lines and respond more quickly to conditions driving faster adoption in commercial and leisure segments.
Market snapshot - (2026-2033)
Global Market Size
USD 0.98 Billion
Largest Segment
Standalone Chartplotters
Fastest Growth
Multifunction Display (MFD) Chartplotters
Growth Rate
4.1% CAGR
To get more insights on this market click here to Request a Free Sample Report
Global marine chartplotter market is segmented by product type, screen size, application, connectivity, distribution channel and region. Based on product type, the market is segmented into Standalone Chartplotters, Combination Chartplotter/Fishfinder Units and Multifunction Display (MFD) Chartplotters. Based on screen size, the market is segmented into Below 7 Inches, 7–12 Inches and Above 12 Inches. Based on application, the market is segmented into Recreational Boating, Commercial Vessels, Fishing, Sailing & Yachting, Naval & Defense and Others. Based on connectivity, the market is segmented into GPS/GNSS, NMEA 2000, Wi-Fi & Bluetooth and Ethernet. Based on distribution channel, the market is segmented into OEM Sales, Marine Equipment Dealers and Online Retail. Based on region, the market is segmented into North America, Europe, Asia Pacific, Latin America and Middle East & Africa.
The most popular are the combined chartplotter/fishfinder units. With these you can use both navigation and fish finding functions without having to mess with two separate devices. This integration offers simplified cockpit designs, reduced wiring complexity, and improved user ergonomics, attractive to recreational anglers and professional fishermen alike. These units are preferred for the convenience of real time depth and sonar data coupled with chart navigation. The leading choice in marine chartplotters.
However, stand-alone chartplotters are the fastest growing as advances in high resolution displays and modular software platforms are attracting new boat owners looking for customizable navigation solutions. The ability to integrate third party sensors and future proof upgrades is in line with the evolving regulatory demands and consumer desire for scalable systems and is driving rapid adoption and expanding market opportunity.
Bluetooth and Wi-Fi are prominent as they fit well with mobile devices, cloud services and firmware updates, reducing reliance on wires, and improving user experience. Its presence in consumer electronics makes for recreational user adoption and real time data sharing across charts, weather and sensor feeds. The main connectivity option for marine chartplotters, because of its ease and flexibility.
By comparison, the fastest growth is in Ethernet connectivity, driven by commercial operators and naval users who are requiring higher bandwidth, reliable network redundancy and integration with the vessel-wide IT infrastructure. The requirement for sophisticated data analytics, real time AIS integration and cyber secure communications is driving the adoption of Ethernet and opening up new opportunities for vendors to deliver robust enterprise grade solutions.
To get detailed segments analysis, Request a Free Sample Report
The region has a long-standing maritime tradition with a high concentration of shipbuilding activity and a large network of coastal navigation routes. Government support for ocean safety programs drives uptake of sophisticated navigation solutions. Leading technology providers and a strong supply chain make the process of innovation faster, and shorten time to market for new chartplotter features. Collaborative research ecosystems between universities, defence agencies and private firms promote ongoing improvement. High vessel traffic in the busy straits and ports, coupled with the high demand for reliable real-time charting capabilities, further reinforces Asia Pacific’s market leadership.
Japan: The Marine Chartplotter market in Japan is driven by the legacy of sophisticated shipbuilding and the stringent regulatory framework focusing on navigational safety. Because the domestic manufacturers have decades of engineering experience to bring state of the art sensor fusion and user friendly interfaces. They work with maritime academies and equipment makers in order to make sure that the training and product development meet the operational requirements. There is always a need for reliable chartplotting solutions with a focus on high-value vessels such as tankers and research vessels, adding to the country’s important role in the regional ecosystem.
South Korea Marine Chartplotter market is driven by a dynamic shipbuilding industry which emphasizes on advanced navigation technologies to improve vessel efficiency. The strong export orientation means that manufacturers are compelled to meet international standards and to include innovative features attractive to global operators. Government-backed maritime safety programmes also encourage systematic upgrades of fleet equipment, ensuring a continuous pipeline for chartplotter deployment. Collaborative clusters linking component suppliers, software developers and maritime institutes speed up product refinement, making South Korea a key player in the region’s dominance.
There are strict environmental regulations that are forcing vessels to use accurate navigation tools to cut emissions and optimize routes. The continent’s dense network of ports and intricate inland waterways create a demand for high-resolution charting and real-time updates, leading to widespread adoption across commercial and leisure fleets. A lot of research money is being spent on adding intelligence to chartplotters with the integration of AI and autonomous capabilities. The collaborative standards bodies create interoperability between different makers. You get a competitive but consistent market. Meanwhile, strong training programs and safety culture are also driving maritime operators to consider advanced chartplotting solutions and rapid growth in the region.
Germany’s Marine Chartplotter market is well served by a strong engineering tradition and a comprehensive regulatory environment demanding high levels of navigational safety. Precision hardware and advanced software are being combined by major manufacturers to target both offshore vessels and inland barge traffic. Good cooperation with research institutes accelerates the development of predictive routing and integrated environmental monitoring. Germany’s dominant market position is underpinned by the country’s extensive port infrastructure and the large amount of freight movement providing a constant demand for reliable, high-performance chartplotters.
Strong offshore energy sector and a vibrant leisure boating community are driving rapid adoption of the United Kingdom Marine Chartplotter Market. The focus on digital transformation pushes the operators to replace legacy systems with next generation chartplotters with cloud based updates and better user interfaces. Robust maritime training institutions generate familiarity with the latest navigation tools, thereby increasing market penetration. The UK is Europe’s fastest growing market and joint projects between government bodies and technology companies help to ensure ongoing innovation.
France Marine Chartplotter Market is developing as a hotspot for sustainable maritime practices and tourism-driven navigation needs. As safety increasingly becomes a concern at sea and on rivers there is a requirement for compact chartplotters that are easy to use on smaller craft. By investing in maritime research we can include environmentally friendly routing algorithms and real time environmental data. Co-operation between regional ports and technology providers enables pilot projects that demonstrate the benefits of modern chartplotting and supports the gradual development of the market in the country.
North America is gaining market share on the back of high-tech adoption and a strong focus on stringent safety standards. Given the region’s extensive coastline and diverse fleet of vessels, ranging from commercial cargo ships to recreational craft, the potential for chartplotter use is wide. A major investment in research and development is accelerating the introduction of autonomous navigation and high-definition electronic charting. Ecosystems of collaboration between defense, commercial and academic entities enable rapid prototyping and fielding of innovative solutions. The culture of operational excellence and continuous professional training means end users are always upgrading to sophisticated chartplotting platforms cementing North America’s strategic role.
The large commercial shipping network and the robust offshore energy industry requiring accurate navigation and real‑time data integration are driving the United States marine chartplotter market. Early adoption of next-generation chartplotting technology is being encouraged by federal safety mandates. A heavy presence of venture capital is fueling startups targeting artificial intelligence and cloud connectivity, enriching the product landscape. When coastal ports, research universities and equipment manufacturers work together, they speed up the adoption of advanced features and cement the United States as a major market player.
The Canadian marine chartplotter market reflects Canada’s inland waterways and harsh northern navigation conditions. In remote and ice-prone areas you need rugged chartplotters that can hook up to satellite services for safety purposes. Government programs supporting Arctic research are promoting integration of high resolution bathymetric data and environmental monitoring. Partnerships with indigenous communities and maritime training centres expose the user to the product and increase adoption rates, supporting Canada’s growing footprint in the regional market.
To know more about the market opportunities by region and country, click here to
Buy The Complete Report
Rising Demand for Precise Navigation
Integration of IoT Enabled Sensors
High Initial Equipment Cost
Complex Integration with Existing Systems
Request Free Customization of this report to help us to meet your business objectives.
The marine chartplotter market is dominated by major OEMs such as Simrad, Garmin Ltd, FLIR Systems, B&G, Lowrance, Furuno Electric Co. and Humminbird, which compete to integrate advanced sonar, radar and imaging technologies into increasingly integrated navigation suites. These companies use their broad marine electronics portfolios to differentiate product functionality and to capture premium segments.
Our Business Information Services team, the ABIRAW (Advanced Business Intelligence, Research & Analysis Wing) of SkyQuest, Collects, Collates, Correlates and Analyses the Data collected by way of Primary Exploratory Research backed by robust Secondary Desk research.
SkyQuest analysis indicates the global marine chartplotter market is growing at a healthy rate owing primarily to rising demand for accurate navigation that enhances safety and fuel efficiency along with integration of IoT enabled sensors providing real-time data streams that further optimise routing and maintenance. The product landscape is dominated by combo chartplotter fishfinder units because they combine navigation and sonar functions in a single ergonomic interface. Asia Pacific leads the regional outlook with its dense shipping lanes, strong shipbuilding base and supportive safety regulations. But, high cost of equipment in the initial phase is a major restraint and is hampering the adoption among the smaller operators.
| Report Metric | Details |
|---|---|
| Market size value in 2024 | USD 0.98 Billion |
| Market size value in 2033 | USD 1.41 Billion |
| Growth Rate | 4.1% |
| Base year | 2024 |
| Forecast period | (2026-2033) |
| Forecast Unit (Value) | USD Billion |
| Segments covered |
|
| Regions covered | North America (US, Canada), Europe (Germany, France, United Kingdom, Italy, Spain, Rest of Europe), Asia Pacific (China, India, Japan, Rest of Asia-Pacific), Latin America (Brazil, Rest of Latin America), Middle East & Africa (South Africa, GCC Countries, Rest of MEA) |
| Companies covered |
|
| Customization scope | Free report customization with purchase. Customization includes:-
|
To get a free trial access to our platform which is a one stop solution for all your data requirements for quicker decision making. This platform allows you to compare markets, competitors who are prominent in the market, and mega trends that are influencing the dynamics in the market. Also, get access to detailed SkyQuest exclusive matrix.
Table Of Content
Executive Summary
Market overview
Parent Market Analysis
Market overview
Market size
KEY MARKET INSIGHTS
COVID IMPACT
MARKET DYNAMICS & OUTLOOK
Market Size by Region
KEY COMPANY PROFILES
Methodology
For the Marine Chartplotter market, our research methodology involved a mixture of primary and secondary data sources. Key steps involved in the research process are listed below:
1. Information Procurement: This stage involved the procurement of Market data or related information via primary and secondary sources. The various secondary sources used included various company websites, annual reports, trade databases, and paid databases such as Hoover's, Bloomberg Business, Factiva, and Avention. Our team did 45 primary interactions Globally which included several stakeholders such as manufacturers, customers, key opinion leaders, etc. Overall, information procurement was one of the most extensive stages in our research process.
2. Information Analysis: This step involved triangulation of data through bottom-up and top-down approaches to estimate and validate the total size and future estimate of the Marine Chartplotter market.
3. Report Formulation: The final step entailed the placement of data points in appropriate Market spaces in an attempt to deduce viable conclusions.
4. Validation & Publishing: Validation is the most important step in the process. Validation & re-validation via an intricately designed process helped us finalize data points to be used for final calculations. The final Market estimates and forecasts were then aligned and sent to our panel of industry experts for validation of data. Once the validation was done the report was sent to our Quality Assurance team to ensure adherence to style guides, consistency & design.
Analyst Support
Customization Options
With the given market data, our dedicated team of analysts can offer you the following customization options are available for the Marine Chartplotter market:
Product Analysis: Product matrix, which offers a detailed comparison of the product portfolio of companies.
Regional Analysis: Further analysis of the Marine Chartplotter market for additional countries.
Competitive Analysis: Detailed analysis and profiling of additional Market players & comparative analysis of competitive products.
Go to Market Strategy: Find the high-growth channels to invest your marketing efforts and increase your customer base.
Innovation Mapping: Identify racial solutions and innovation, connected to deep ecosystems of innovators, start-ups, academics, and strategic partners.
Category Intelligence: Customized intelligence that is relevant to their supply Markets will enable them to make smarter sourcing decisions and improve their category management.
Public Company Transcript Analysis: To improve the investment performance by generating new alpha and making better-informed decisions.
Social Media Listening: To analyze the conversations and trends happening not just around your brand, but around your industry as a whole, and use those insights to make better Marketing decisions.
REQUEST FOR SAMPLE
 REQUEST FREE CUSTOMIZATION
Global Marine Chartplotter Market size was valued at USD 0.98 Billion in 2024 and is poised to grow from USD 1.02 Billion in 2025 to USD 1.41 Billion by 2033, growing at a CAGR of 4.1% during the forecast period (2026-2033).
The marine chartplotter market is dominated by established OEMs such as Simrad, Garmin Ltd, FLIR Systems, B&G, Lowrance, Furuno Electric Co., and Humminbird, which compete by embedding advanced sonar, radar and imaging technologies into increasingly integrated navigation suites, leveraging their broader marine electronics portfolios to differentiate product functionality and capture premium segments. 'Garmin Ltd.', 'Navico Group', 'Teledyne Technologies Incorporated', 'Furuno Electric Co., Ltd.', 'Johnson Outdoors Inc.', 'Japan Radio Co., Ltd.', 'Koden Electronics Co., Ltd.', 'Samyung ENC Co., Ltd.', 'Onwa Marine Electronics Co., Ltd.', 'Honda Electronics Co., Ltd.', 'Wärtsilä Corporation', 'SRT Marine Systems plc', 'Danelec Marine A/S', 'Orca Technologies AS', 'Ninglu Tech Co., Ltd.', 'SeaNav Systems', 'TZ iBoat', 'Scanstrut Ltd.', 'Nebo Global', 'Digital Yacht Ltd.'
The maritime industry is experiencing heightened emphasis on safety and efficiency, prompting vessel operators to seek chartplotters that deliver precise positional data and real‑time route planning. Advanced electronic navigation reduces human error, enhances compliance with international regulations, and supports complex operational environments such as offshore drilling and coastal fisheries. Consequently, ship owners are increasingly investing in sophisticated chartplotting solutions to mitigate risk, improve fuel management, and uphold reputation, thereby driving robust market expansion. This trend also encourages hardware manufacturers to integrate displays and enhanced processing capabilities, reinforcing adoption across fleets.
Ai‑Driven Predictive Navigation: Marine chartplotters are increasingly embedding artificial intelligence to anticipate route hazards, optimize fuel consumption, and suggest real‑time course adjustments. Leveraging machine‑learning models trained on historic voyage data, these systems can recognize subtle patterns in weather, currents, and traffic density, delivering proactive alerts before operators encounter issues. This shift toward predictive navigation enhances safety, reduces operational costs, and aligns with broader digital transformation initiatives across the shipping industry, fostering greater trust in autonomous decision‑support tools for improved fleet performance and compliance.
Why does Asia Pacific Dominate the Global Marine Chartplotter market? |@12


Want to customize this report? This report can be personalized according to your needs. Our analysts and industry experts will work directly with you to understand your requirements and provide you with customized data in a short amount of time. We offer $1000 worth of FREE customization at the time of purchase.
Feedback From Our Clients


 USA (+1) 351-333-4748

