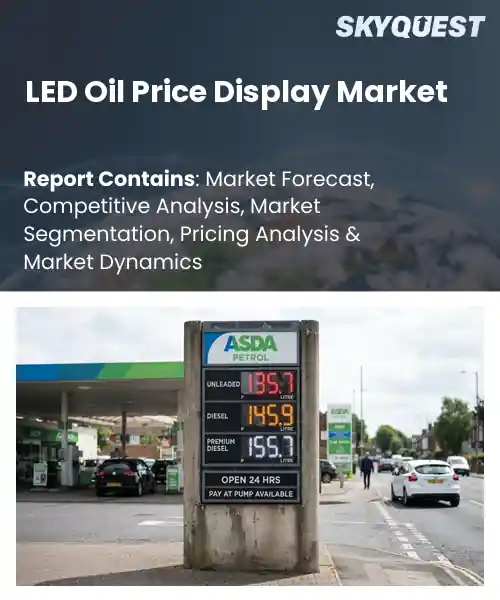
LED Oil Price Display Market
Report ID: SQMIG45I2541
Report ID: SQMIG45I2541
[email protected]
USA +1 351-333-4748
Report ID:
SQMIG45I2541 |
Region:
Global |
Published Date: October, 2026
Pages:
157
|Tables:
117
|Figures:
77


Global Led Oil Price Display Market size was valued at USD 290.0 Million in 2024 and is poised to grow from USD 306.24 Million in 2025 to USD 473.56 Million by 2033, growing at a CAGR of 5.6% during the forecast period (2026-2033).
Integration with IoT transforms LED price displays from static signs to data hubs. Connecting displays to pricing APIs sends updates instantly, removing manual work and lowering errors, which encourages adoption by many stations. The same link permits targeted ads, letting stations earn extra income by showing local promotions alongside prices. For example, a Spanish chain tied its LED panels to a cloud analytics dashboard, raising ancillary sales by 15 % while staying compliant with EU transparency rules. This cause‑and‑effect relationship shows that digital interoperability drives operational efficiency and opens new revenue avenues, fueling market expansion across global retail networks and worldwide. The global LED oil price display market is driven primarily by the need for real‑time fuel pricing communication amid volatile oil markets. Retail stations, convenience stores, and highway plazas rely on programmable LED boards to broadcast price changes instantly, shaping driver decisions and meeting regulatory transparency. Historically, static mechanical signs dominated, but falling LED costs and networking have shifted the sector toward cloud‑managed displays. Major U.S. chains replaced analog panels with LED units in 2022, while European distributors installed similar systems to comply with EU pricing directives. This transition expands market relevance and creates a foundation for accelerated growth.
How is AI improving real-time accuracy of LED oil price display systems?
AI enhances the real‑time accuracy of LED oil price displays by continuously pulling pricing data from multiple sources, cleaning it with machine‑learning filters and instantly pushing corrected values to the screens. Edge processors embedded in the signage run predictive models that anticipate price changes and flag anomalies before they reach the public display. Integration with station management software allows automatic synchronization with pump sensors, eliminating manual entry errors. The market is seeing a shift toward smarter, networked boards that can adapt to regional pricing strategies while reducing downtime. Operators report smoother updates and a more trustworthy customer experience as AI handles the heavy lifting behind the scenes.Daktronics March 2024 introduced an AI‑driven dynamic pricing platform that updates LED fuel boards the moment market rates shift, demonstrating how intelligent automation boosts display reliability and fuels growth in the LED oil price display market.
Market snapshot - (2026-2033)
Global Market Size
USD 290.0 Million
Largest Segment
Outdoor LED Price Displays
Fastest Growth
Indoor LED Price Displays
Growth Rate
5.6% CAGR
To get more insights on this market click here to Request a Free Sample Report
Global led oil price display market is segmented by display type, display configuration, control type, application and region. Based on display type, the market is segmented into Outdoor LED Price Displays and Indoor LED Price Displays. Based on display configuration, the market is segmented into Single-Sided Displays, Double-Sided Displays and Multi-Sided Displays. Based on control type, the market is segmented into Manual-Control Displays, Digitally Programmable Displays and Network-Connected Displays. Based on application, the market is segmented into Gas Stations, Fuel Retail Chains, Commercial Fueling Facilities and Other Fuel Retail Locations. Based on region, the market is segmented into North America, Europe, Asia Pacific, Latin America and Middle East & Africa.
Outdoor LED Price Displays segment dominates because they provide high visibility under varying weather conditions, which is essential for attracting drivers at fuel stations. Their brightness and rugged construction enable 24‑hour operation without degradation, aligning with operators’ need for reliable price communication. Consequently, retailers prioritize outdoor units to ensure brand consistency and compliance with signage regulations, reinforcing their market leadership. They also integrate seamlessly with solar‑powered power systems, reducing operational costs for station owners.
However, Indoor LED Price Displays are witnessing the strongest growth momentum as fuel retailers expand into convenience store environments and indoor service bays. Their compact form factor and lower power consumption meet the aesthetic and energy‑efficiency demands of modern stations, driving wider adoption and opening new revenue avenues through dynamic in‑store promotions.
Network-Connected Displays segment dominates because they allow centralized management of price information across multiple locations, eliminating manual update errors and ensuring real‑time compliance with market fluctuations. Integration with cloud‑based analytics gives operators insight into pricing effectiveness, while remote diagnostics reduce downtime. This connectivity aligns with broader digital transformation goals of fuel retailers, cementing networked units as the preferred choice for operational efficiency and data‑driven decision making.
On the other hand, Digitally Programmable Displays are emerging as the key high‑growth area as stations seek greater flexibility without full network infrastructure. These units support scheduled content changes via USB or local controllers, meeting demand for seasonal pricing and localized promotions. Their lower entry cost accelerates adoption among smaller operators, expanding the overall market reach.
To get detailed segments analysis, Request a Free Sample Report
The Asia Pacific region benefits from a confluence of advanced manufacturing capabilities, robust research ecosystems, and proactive regulatory frameworks that prioritize energy efficiency. Local producers have cultivated deep expertise in LED technology, enabling rapid iteration and cost-effective scaling of price display solutions. Consumer expectations for transparent pricing and the widespread adoption of digital signage across retail and service sectors further reinforce demand. Strong collaboration between technology providers and retail chains accelerates deployment, while government incentives for low‑power visual equipment create a supportive market environment. These combined factors position Asia Pacific as the leading hub for innovation, supply chain efficiency, and market penetration in the LED oil price display arena.
Japan LED Oil Price Display Market
LED Oil Price Display Market in Japan thrives on a tradition of precision engineering and a consumer culture that values clear, real‑time information. Domestic manufacturers leverage cutting‑edge LED modules to create high‑resolution displays that integrate seamlessly with point‑of‑sale systems. Retail networks prioritize these solutions to enhance price transparency and operational efficiency. Collaborative research initiatives between universities and industry drive continuous improvements in display durability and energy consumption, reinforcing Japan’s reputation as a benchmark for quality and reliability in the sector.
South Korea LED Oil Price Display Market
LED Oil Price Display Market in South Korea is propelled by a vibrant electronics industry and aggressive adoption of smart retail technologies. Local firms excel in integrating LED displays with IoT platforms, allowing dynamic pricing updates and remote monitoring. The market benefits from strong government programs that encourage energy‑saving hardware, fostering a climate of innovation. Retail chains swiftly implement these displays to improve customer experience and streamline pricing operations, while export-oriented manufacturers extend their expertise to regional partners, cementing South Korea’s influential role in the global landscape.
North America experiences vigorous growth driven by heightened consumer demand for immediate pricing visibility and the retail sector’s shift toward digitized point‑of‑sale infrastructure. Retailers across the United States and Canada are modernizing storefronts with high‑brightness LED displays that reduce operational costs and support real‑time price adjustments. Energy‑efficiency standards and sustainability initiatives encourage the adoption of low‑power LED solutions, while supply chains benefit from domestic manufacturing hubs that ensure rapid delivery and technical support. The convergence of technology integration, regulatory encouragement, and competitive retail environments fuels a sustained expansion of LED oil price display deployments across the region.
United States LED Oil Price Display Market
LED Oil Price Display Market in the United States is characterized by extensive retail networks seeking scalable, high‑visibility solutions. Domestic manufacturers focus on modular designs that cater to diverse store formats, from large supermarkets to convenience outlets. Integration with cloud‑based pricing engines enables retailers to adjust prices instantly, enhancing responsiveness to market fluctuations. Industry collaborations emphasize durability and low energy consumption, aligning with broader sustainability goals. The United States market remains a proving ground for innovative display applications that set benchmarks for performance and reliability.
Canada LED Oil Price Display Market
LED Oil Price Display Market in Canada reflects a strong emphasis on energy conservation and winter‑resilient hardware. Suppliers develop robust LED units capable of maintaining brightness in low‑temperature conditions, meeting the specific needs of northern retail environments. Retailers adopt these displays to provide clear pricing information while reducing electricity usage, resonating with national sustainability targets. Partnerships between technology firms and provincial trade associations promote knowledge sharing and accelerate the rollout of advanced pricing signage, reinforcing Canada’s commitment to modernizing retail infrastructure with environmentally responsible solutions.
Europe enhances its position through a focus on regulatory alignment, sustainability commitments, and cross‑border collaboration among manufacturers and retailers. The region’s stringent energy‑efficiency directives motivate the transition to low‑consumption LED pricing displays, while sophisticated supply networks facilitate rapid adoption across both mature and emerging markets. Investment in research consortia drives advancements in display clarity, connectivity, and integration with digital commerce platforms. Moreover, European retailers emphasize consumer experience, leveraging LED displays to deliver transparent pricing and dynamic promotional content, thereby reinforcing the continent’s role as a leader in innovative, eco‑friendly retail technology.
Germany LED Oil Price Display Market
LED Oil Price Display Market in Germany benefits from a rigorous engineering culture and strong environmental standards. Domestic producers prioritize high‑efficiency LED modules that align with national energy‑saving regulations. Retail chains incorporate these displays to streamline price communication and reduce operational expenditures. Collaborative efforts between industry groups and research institutes focus on enhancing display longevity and connectivity, ensuring that German solutions remain at the forefront of technological reliability and sustainability in the European marketplace.
United Kingdom LED Oil Price Display Market
LED Oil Price Display Market in the United Kingdom is driven by a vibrant retail sector that values dynamic pricing and visual clarity. Suppliers develop LED displays with adaptable brightness settings suitable for varied store lighting conditions. Integration with centralized pricing systems allows retailers to adjust rates swiftly, supporting competitive positioning. Government encouragement of low‑energy technologies reinforces adoption, while industry forums promote best practices that elevate the overall quality and effectiveness of price display deployments throughout the United Kingdom.
France LED Oil Price Display Market
LED Oil Price Display Market in France reflects a commitment to modern retail aesthetics and ecological responsibility. French manufacturers design LED displays that combine high resolution with minimal power draw, meeting both consumer expectations and regulatory demands. Retail environments leverage these displays to enhance price transparency and engage shoppers with real‑time promotional updates. Collaborative initiatives between technology providers and retail associations foster continuous improvement, ensuring that France remains a key contributor to the evolution of sustainable, high‑performance LED oil price display solutions in Europe.
To know more about the market opportunities by region and country, click here to
Buy The Complete Report
Increasing Energy Efficiency Awareness
Smart Stores leveraging LED Displays
High Initial Capital Expenditure
Limited Compatibility with Legacy Systems
Request Free Customization of this report to help us to meet your business objectives.
The LED oil price display market is shaped by intense rivalry among established manufacturers and agile newcomers, driving rapid product upgrades and cost efficiencies. Competitive pressure has spurred major players to pursue strategic M&A, such as Daktronics’ acquisition of a niche LED signage firm in 2022, while LG Display formed a partnership with a leading petroleum retailer to embed smart connectivity into price boards. Samsung’s recent launch of AI‑driven dynamic pricing displays exemplifies technology‑focused differentiation, reinforcing the market’s shift toward integrated, data‑rich solutions.
Top Player’s Company Profile
Recent Developments
SkyQuest’s ABIRAW (Advanced Business Intelligence, Research & Analysis Wing) is our Business Information Services team that Collects, Collates, Correlates, and Analyses the Data collected by means of Primary Exploratory Research backed by robust Secondary Desk research. As per SkyQuest analysis the global LED oil price display market is being propelled primarily by growing energy‑efficiency awareness that pushes retailers toward lower‑power LED boards, while smart‑store initiatives that embed displays into IoT‑driven signage networks provide a second powerful boost. The outdoor LED price display segment remains the dominant force because its brightness and weather‑proof design deliver maximum brand visibility at fuel stations. Asia Pacific leads the market, benefiting from strong manufacturing capabilities and supportive regulations. However, high upfront capital costs act as a restraint, especially for smaller operators, slowing adoption until financing or cost‑effective models become widely available in the industry.
| Report Metric | Details |
|---|---|
| Market size value in 2024 | USD 290.0 Million |
| Market size value in 2033 | USD 473.56 Million |
| Growth Rate | 5.6% |
| Base year | 2024 |
| Forecast period | (2026-2033) |
| Forecast Unit (Value) | USD Million |
| Segments covered |
|
| Regions covered | North America (US, Canada), Europe (Germany, France, United Kingdom, Italy, Spain, Rest of Europe), Asia Pacific (China, India, Japan, Rest of Asia-Pacific), Latin America (Brazil, Rest of Latin America), Middle East & Africa (South Africa, GCC Countries, Rest of MEA) |
| Companies covered |
|
| Customization scope | Free report customization with purchase. Customization includes:-
|
To get a free trial access to our platform which is a one stop solution for all your data requirements for quicker decision making. This platform allows you to compare markets, competitors who are prominent in the market, and mega trends that are influencing the dynamics in the market. Also, get access to detailed SkyQuest exclusive matrix.
Table Of Content
Executive Summary
Market overview
Parent Market Analysis
Market overview
Market size
KEY MARKET INSIGHTS
COVID IMPACT
MARKET DYNAMICS & OUTLOOK
Market Size by Region
KEY COMPANY PROFILES
Methodology
For the LED Oil Price Display Market, our research methodology involved a mixture of primary and secondary data sources. Key steps involved in the research process are listed below:
1. Information Procurement: This stage involved the procurement of Market data or related information via primary and secondary sources. The various secondary sources used included various company websites, annual reports, trade databases, and paid databases such as Hoover's, Bloomberg Business, Factiva, and Avention. Our team did 45 primary interactions Globally which included several stakeholders such as manufacturers, customers, key opinion leaders, etc. Overall, information procurement was one of the most extensive stages in our research process.
2. Information Analysis: This step involved triangulation of data through bottom-up and top-down approaches to estimate and validate the total size and future estimate of the LED Oil Price Display Market.
3. Report Formulation: The final step entailed the placement of data points in appropriate Market spaces in an attempt to deduce viable conclusions.
4. Validation & Publishing: Validation is the most important step in the process. Validation & re-validation via an intricately designed process helped us finalize data points to be used for final calculations. The final Market estimates and forecasts were then aligned and sent to our panel of industry experts for validation of data. Once the validation was done the report was sent to our Quality Assurance team to ensure adherence to style guides, consistency & design.
Analyst Support
Customization Options
With the given market data, our dedicated team of analysts can offer you the following customization options are available for the LED Oil Price Display Market:
Product Analysis: Product matrix, which offers a detailed comparison of the product portfolio of companies.
Regional Analysis: Further analysis of the LED Oil Price Display Market for additional countries.
Competitive Analysis: Detailed analysis and profiling of additional Market players & comparative analysis of competitive products.
Go to Market Strategy: Find the high-growth channels to invest your marketing efforts and increase your customer base.
Innovation Mapping: Identify racial solutions and innovation, connected to deep ecosystems of innovators, start-ups, academics, and strategic partners.
Category Intelligence: Customized intelligence that is relevant to their supply Markets will enable them to make smarter sourcing decisions and improve their category management.
Public Company Transcript Analysis: To improve the investment performance by generating new alpha and making better-informed decisions.
Social Media Listening: To analyze the conversations and trends happening not just around your brand, but around your industry as a whole, and use those insights to make better Marketing decisions.
REQUEST FOR SAMPLE
 REQUEST FREE CUSTOMIZATION


Want to customize this report? This report can be personalized according to your needs. Our analysts and industry experts will work directly with you to understand your requirements and provide you with customized data in a short amount of time. We offer $1000 worth of FREE customization at the time of purchase.
Feedback From Our Clients


 USA (+1) 351-333-4748

