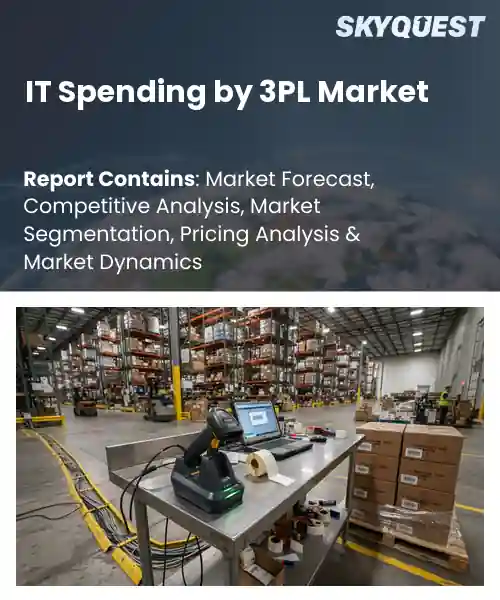
IT Spending by 3PL Market
Report ID: SQMIG45B2397
Report ID: SQMIG45B2397
[email protected]
USA +1 351-333-4748
Report ID:
SQMIG45B2397 |
Region:
Global |
Published Date: August, 2026
Pages:
157
|Tables:
117
|Figures:
77


Global It Spending By 3Pl Market size was valued at USD 31.84 Billion in 2024 and is poised to grow from USD 34.8 Billion in 2025 to USD 70.89 Billion by 2033, growing at a CAGR of 9.3% during the forecast period (2026-2033).
The third‑party logistics (3PL) sector has become a primary conduit for corporate IT investment as firms outsource increasingly complex supply‑chain functions. Historically, 3PLs managed only transportation and warehousing, but the rise of e‑commerce and omnichannel fulfillment forced them to adopt sophisticated platforms for inventory visibility, demand forecasting, and real‑time tracking. This shift created a measurable surge in IT budgets, exemplified by a 2021 adoption of cloud‑based WMS by DHL Supply Chain that reduced order‑processing time by 22 percent. Consequently, the market now represents a critical lever for digital transformation, linking retailer demand to logistics execution across global supply networks, enhancing end‑to‑end efficiency significantly. Among the drivers of global IT spending in the 3PL arena, data integration emerges as the most compelling force because it directly translates fragmented operational silos into actionable intelligence. When shippers connect order management systems with transportation execution platforms, predictive analytics can anticipate bottlenecks, prompting preemptive rerouting that slashes late‑delivery rates. Amazon’s acquisition of robotics firm Canvas in 2022 illustrates this causality: the infusion of AI‑enabled sortation technology into its network reduced handling costs by 15 percent while expanding capacity. The resulting cost efficiencies attract manufacturers seeking leaner supply chains, thereby fueling investment in IoT sensors, blockchain traceability, and APIs across the industry.
How is AI-driven automation reshaping IT spending strategies in the 3PL market?
AI-driven automation is becoming a cornerstone of IT budgeting in the 3PL sector. Providers are shifting spend from legacy systems toward platforms that can predict demand, route shipments, and manage inventory without manual input. This transition is driven by the need for faster decision‑making and tighter cost control as the market expands. Automation tools are integrated into existing ERP stacks, allowing real‑time data flow and reducing the reliance on separate analytics teams. As a result, IT leaders allocate more funds to scalable cloud services and AI models that continuously learn from operational patterns, creating a feedback loop that improves service quality and profitability.In June 2026, a leading 3PL highlighted how AI‑enabled automation is reshaping its IT spending, emphasizing the role of predictive analytics in driving efficiency and supporting growth.
Market snapshot - (2026-2033)
Global Market Size
USD 31.84 Billion
Largest Segment
Software
Fastest Growth
IT Services
Growth Rate
9.3% CAGR
To get more insights on this market click here to Request a Free Sample Report
Global it spending by 3pl market is segmented by spending category, deployment mode, application, enterprise size and region. Based on spending category, the market is segmented into Hardware, Software and IT Services. Based on deployment mode, the market is segmented into On-Premises and Cloud. Based on application, the market is segmented into Warehouse Management, Transportation Management, Supply Chain Visibility, Analytics & Business Intelligence and Cybersecurity. Based on enterprise size, the market is segmented into Large Enterprises and Small & Medium Enterprises. Based on region, the market is segmented into North America, Europe, Asia Pacific, Latin America and Middle East & Africa.
Warehouse Management segment dominates because it directly orchestrates the core physical flows that 3PL firms monetize, linking inbound receipt to outbound shipping. Its ability to automate order picking, slotting, and labor scheduling reduces handling errors and boosts throughput. These functional efficiencies translate into higher contract compliance and client satisfaction, prompting providers to allocate the bulk of their IT budgets toward sophisticated WMS platforms that integrate with existing transport and inventory systems.
Meanwhile, Analytics & Business Intelligence segment is witnessing the strongest growth momentum as 3PL executives seek real time insights to fine tune network design and predict demand spikes. Advanced data visualisation and predictive modelling enable proactive decision making, driving incremental spend on AI enabled dashboards that unlock new revenue streams and deepen client partnerships.
Cloud segment dominates because it offers 3PL firms scalable compute power and flexible licensing that align with fluctuating shipment volumes. By eliminating the need for extensive on site hardware, cloud services reduce capital outlay and accelerate deployment of new functionalities, allowing providers to rapidly integrate emerging technologies such as IoT tracking and machine learning without disrupting existing operations and fostering collaborative ecosystems with carriers and retailers.
Conversely, On Premises segment is emerging as the key high growth area as data sovereignty concerns and latency sensitive applications compel larger 3PLs to retain critical workloads locally. Investments in edge servers and private datacentres enable tighter control over cybersecurity and real time processing, stimulating additional spend that fuels specialized hardware procurement and bespoke integration services.
To get detailed segments analysis, Request a Free Sample Report
North America commands leadership through a convergence of mature logistics networks, deep technology adoption, and a concentration of global supply‑chain operators that prioritize digital transformation. The market benefits from robust investment ecosystems, advanced data analytics capabilities, and a culture of innovation that drives continuous improvement in warehouse management, transportation planning, and customer visibility. Strong collaboration between technology providers and logistics firms creates scalable solutions that set industry benchmarks, reinforcing the region’s role as the reference point for best practices and driving sustained momentum in IT spending across third‑party logistics.
IT Spending by 3PL Market in the United States reflects a relentless pursuit of efficiency through cloud‑based platforms, AI‑driven forecasting, and integrated transport execution systems. Leading carriers and freight forwarders embrace modular solutions that enable real‑time tracking and dynamic routing, while large retailers push for end‑to‑end visibility across complex distribution networks. The ecosystem of startups and established vendors fuels a competitive environment where innovation is rapidly commercialized, reinforcing the United States position as a catalyst for global logistics technology advancement.
IT Spending by 3PL Market in Canada is shaped by a strong emphasis on cross‑border integration and sustainability initiatives that demand sophisticated digital tools. Logistics providers adopt collaborative platforms that facilitate seamless information exchange with United States partners, while also leveraging predictive analytics to optimize inventory placement across vast territories. The focus on resilient supply chains and the adoption of green logistics technologies encourage continued investment in advanced software solutions, positioning Canada as a strategic hub within the North American logistics landscape.
Europe experiences rapid expansion as regulatory harmonization, e‑commerce growth, and a commitment to circular supply chains compel logistics firms to modernize their technology stacks. The region’s emphasis on data privacy and cross‑border interoperability fuels demand for secure, interoperable platforms that connect shippers, carriers, and customers across diverse markets. Collaborative ecosystems among technology innovators, freight forwarders, and manufacturers stimulate the development of modular, cloud‑native solutions that enhance visibility, reduce carbon footprints, and improve service agility. This confluence of policy, market pressure, and innovation creates a fertile environment for accelerated IT investment in third‑party logistics.
IT Spending by 3PL Market in Germany is anchored by a robust manufacturing base that requires precision‑driven logistics coordination. Industry leaders adopt advanced execution systems that integrate with enterprise resource planning tools, enabling synchronized production planning and distribution. The focus on Industry 4.0 principles drives the incorporation of real‑time sensor data, predictive maintenance, and AI‑based demand forecasting into logistics operations. This strategic alignment of technology with manufacturing excellence reinforces Germany’s dominant role in shaping European logistics digitalization.
IT Spending by 3PL Market in the United Kingdom accelerates through a vibrant fintech and tech ecosystem that fuels innovative logistics solutions. Companies prioritize agile, cloud‑first platforms that support rapid scaling of e‑commerce fulfillment and last‑mile delivery services. Emphasis on customer experience drives investment in real‑time tracking, omnichannel integration, and AI‑enhanced route optimization. The collaborative culture between startups, established carriers, and technology providers creates a dynamic pipeline of solutions that positions the United Kingdom as the fastest growing market for logistics IT spending in Europe.
IT Spending by 3PL Market in France reflects an emerging focus on sustainable and digital supply chains within a diversified industrial landscape. Logistics providers adopt platforms that facilitate carbon accounting, multimodal transport coordination, and enhanced visibility for both domestic and international flows. The growing adoption of collaborative tools among small and medium‑sized enterprises encourages broader digital uptake, while government incentives for green logistics reinforce investment momentum. This emerging emphasis on environmentally conscious technology underpins France’s rising prominence in the European logistics technology arena.
Asia Pacific strengthens its position by leveraging rapid e‑commerce adoption, extensive manufacturing networks, and increasing regional trade connectivity that demand sophisticated logistics technology. Market participants embrace cloud‑centric solutions, AI‑enabled demand planning, and integrated transport management systems to handle high volume, diverse product flows. Strategic partnerships between local technology firms and global providers accelerate knowledge transfer and customization of platforms to meet distinct market nuances. This combination of scale, innovation, and collaborative development drives a decisive shift toward higher IT investment within third‑party logistics across the region.
IT Spending by 3PL Market in Japan is characterized by a focus on precision logistics and advanced automation that support high‑value, time‑sensitive goods. Companies integrate robotics, IoT sensors, and data analytics into warehouse and freight operations to achieve ultra‑reliable delivery performance. The cultural emphasis on quality and efficiency fuels adoption of sophisticated transport execution platforms that provide end‑to‑end visibility and predictive insights. This commitment to high‑tech logistics solutions consolidates Japan’s role as a leading contributor to regional IT spending in third‑party logistics.
IT Spending by 3PL Market in South Korea benefits from a vibrant digital infrastructure and a strong focus on smart logistics ecosystems. Leading firms deploy cloud‑based platforms that enable seamless coordination between manufacturers, retailers, and carriers, while leveraging AI for dynamic routing and inventory optimization. The integration of advanced telecommunications, such as 5G networks, supports real‑time data exchange and automated decision‑making across supply chains. This technologically progressive environment positions South Korea as a key driver of heightened IT investment in the Asia Pacific logistics sector.
To know more about the market opportunities by region and country, click here to
Buy The Complete Report
Increasing Cloud Adoption is Transforming Services
Digital Integration and Real-Time Data Utilization
Legacy Systems are Hindering Modernization
Regulatory Compliance and Data Privacy Concerns
Request Free Customization of this report to help us to meet your business objectives.
The competitive landscape of the IT spending by third‑party logistics market is shaped by aggressive M&A activity, strategic partnerships, and rapid technology adoption, as firms seek to capture the expanding digital spend of 3PLs. Recent examples include Armstrong’s acquisition of a regional transport software provider to broaden its data‑analytics portfolio, and Capstone Partners’ joint venture with a cloud‑based warehouse management startup to accelerate AI‑driven visibility solutions, underscoring the focus on integrated tech ecosystems.
Top Player’s Company Profile
Recent Developments
SkyQuest’s ABIRAW (Advanced Business Intelligence, Research & Analysis Wing) is our Business Information Services team that Collects, Collates, Correlates, and Analyses the Data collected by means of Primary Exploratory Research backed by robust Secondary Desk research. As per SkyQuest analysis, the global IT spending by the 3PL market is being propelled primarily by increasing cloud adoption, which gives providers scalable, low‑capital solutions and accelerates deployment of advanced logistics platforms. A second strong driver is digital integration and real‑time data utilization that synchronises transport, warehousing and inventory, delivering immediate visibility and predictive decision‑making. The market is still challenged by legacy systems that lack interoperability, limiting data flow and raising maintenance costs, while stringent data‑privacy regulations add further complexity. North America remains the dominant region, benefiting from mature logistics networks and a culture of rapid tech adoption, and warehouse‑management software continues to command the largest share of spending as it directly orchestrates core physical flows.
| Report Metric | Details |
|---|---|
| Market size value in 2024 | USD 31.84 Billion |
| Market size value in 2033 | USD 70.89 Billion |
| Growth Rate | 9.3% |
| Base year | 2024 |
| Forecast period | (2026-2033) |
| Forecast Unit (Value) | USD Billion |
| Segments covered |
|
| Regions covered | North America (US, Canada), Europe (Germany, France, United Kingdom, Italy, Spain, Rest of Europe), Asia Pacific (China, India, Japan, Rest of Asia-Pacific), Latin America (Brazil, Rest of Latin America), Middle East & Africa (South Africa, GCC Countries, Rest of MEA) |
| Companies covered |
|
| Customization scope | Free report customization with purchase. Customization includes:-
|
To get a free trial access to our platform which is a one stop solution for all your data requirements for quicker decision making. This platform allows you to compare markets, competitors who are prominent in the market, and mega trends that are influencing the dynamics in the market. Also, get access to detailed SkyQuest exclusive matrix.
Table Of Content
Executive Summary
Market overview
Parent Market Analysis
Market overview
Market size
KEY MARKET INSIGHTS
COVID IMPACT
MARKET DYNAMICS & OUTLOOK
Market Size by Region
KEY COMPANY PROFILES
Methodology
For the IT Spending by 3PL Market, our research methodology involved a mixture of primary and secondary data sources. Key steps involved in the research process are listed below:
1. Information Procurement: This stage involved the procurement of Market data or related information via primary and secondary sources. The various secondary sources used included various company websites, annual reports, trade databases, and paid databases such as Hoover's, Bloomberg Business, Factiva, and Avention. Our team did 45 primary interactions Globally which included several stakeholders such as manufacturers, customers, key opinion leaders, etc. Overall, information procurement was one of the most extensive stages in our research process.
2. Information Analysis: This step involved triangulation of data through bottom-up and top-down approaches to estimate and validate the total size and future estimate of the IT Spending by 3PL Market.
3. Report Formulation: The final step entailed the placement of data points in appropriate Market spaces in an attempt to deduce viable conclusions.
4. Validation & Publishing: Validation is the most important step in the process. Validation & re-validation via an intricately designed process helped us finalize data points to be used for final calculations. The final Market estimates and forecasts were then aligned and sent to our panel of industry experts for validation of data. Once the validation was done the report was sent to our Quality Assurance team to ensure adherence to style guides, consistency & design.
Analyst Support
Customization Options
With the given market data, our dedicated team of analysts can offer you the following customization options are available for the IT Spending by 3PL Market:
Product Analysis: Product matrix, which offers a detailed comparison of the product portfolio of companies.
Regional Analysis: Further analysis of the IT Spending by 3PL Market for additional countries.
Competitive Analysis: Detailed analysis and profiling of additional Market players & comparative analysis of competitive products.
Go to Market Strategy: Find the high-growth channels to invest your marketing efforts and increase your customer base.
Innovation Mapping: Identify racial solutions and innovation, connected to deep ecosystems of innovators, start-ups, academics, and strategic partners.
Category Intelligence: Customized intelligence that is relevant to their supply Markets will enable them to make smarter sourcing decisions and improve their category management.
Public Company Transcript Analysis: To improve the investment performance by generating new alpha and making better-informed decisions.
Social Media Listening: To analyze the conversations and trends happening not just around your brand, but around your industry as a whole, and use those insights to make better Marketing decisions.
REQUEST FOR SAMPLE
 REQUEST FREE CUSTOMIZATION


Want to customize this report? This report can be personalized according to your needs. Our analysts and industry experts will work directly with you to understand your requirements and provide you with customized data in a short amount of time. We offer $1000 worth of FREE customization at the time of purchase.
Feedback From Our Clients


 USA (+1) 351-333-4748

