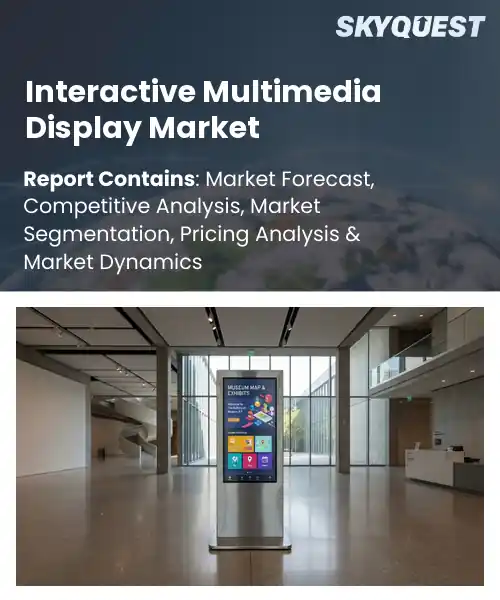
Interactive Multimedia Display Market
Report ID: SQMIG45I2535
Report ID: SQMIG45I2535
[email protected]
USA +1 351-333-4748
Report ID:
SQMIG45I2535 |
Region:
Global |
Published Date: September, 2026
Pages:
157
|Tables:
123
|Figures:
77


Global Interactive Multimedia Display Market size was valued at USD 11.4 Billion in 2024 and is poised to grow from USD 12.29 Billion in 2025 to USD 22.42 Billion by 2033, growing at a CAGR of 7.8% during the forecast period (2026-2033).
Interactive multimedia displays combine touch‑sensitive screens, high‑resolution graphics, and integrated software to deliver real‑time, immersive content across commercial, educational, and public venues. The market emerged from early kiosk installations in the late 1990s, evolved through flat‑panel LCD breakthroughs, and accelerated as cloud‑based content management reduced deployment costs. Today, retailers employ dynamic wayfinding boards that adjust promotions based on foot traffic, while universities replace static whiteboards with collaborative touch tables that support remote learning. This progression reflects a shift from passive signage to engaging, data‑driven experiences, positioning the sector as a catalyst for customer engagement, operational efficiency, and brand differentiation globally. The dominant growth catalyst now lies in the integration of intelligence with interactive displays, enabling contextual content that reacts to user behavior and cues. When AI analyzes footfall patterns, the system can automatically prioritize products, which in turn raises conversion rates and justifies higher advertising spend. Moreover, the rise of hybrid work models drives enterprises to install touch walls that bridge office and participants, fostering brainstorming and reducing travel expenses. These deployments generate revenue for software providers through analytics platforms, while manufacturers benefit from upselling sensor add‑ons, creating a cycle of demand and innovation across retail, corporate, and transportation sectors.
How is AI enhancing interactivity and content personalization in the interactive multimedia display market?
AI enhances interactivity and content personalization in interactive multimedia displays by analyzing user behavior, recognizing gestures, and adapting visuals in real time. The market now sees displays that respond to touch, voice, and facial cues, creating immersive experiences for retail, education, and hospitality. Machine learning models predict preferences, allowing dynamic content that matches audience mood and location. Examples include gesture controlled wayfinding kiosks, voice activated information boards, and facial recognition driven advertising. These capabilities increase dwell time, boost engagement, and drive higher conversion rates, making AI a core differentiator as providers race to deliver smarter, more adaptive screens.Samsung Electronics announced a new AI driven interactive signage platform in March 2024, enabling real time content tailoring based on audience demographics and behavior. The solution streamlines campaign updates and enriches user engagement for brands across venues, reinforcing market momentum and demonstrating the value of AI in display personalization.
Market snapshot - (2026-2033)
Global Market Size
USD 11.4 Billion
Largest Segment
Interactive Flat Panel Displays
Fastest Growth
Interactive Video Walls
Growth Rate
7.8% CAGR
To get more insights on this market click here to Request a Free Sample Report
Global interactive multimedia display market is segmented by display type, display size, technology, application and region. Based on display type, the market is segmented into Interactive Flat Panel Displays, Interactive Projectors, Interactive Video Walls, Interactive Touchscreens and Other Display Types. Based on display size, the market is segmented into Up to 32 Inches, 33–65 Inches and Above 65 Inches. Based on technology, the market is segmented into LCD, LED, OLED and Other Technologies. Based on application, the market is segmented into Education, Corporate, Retail, Healthcare, Hospitality & Entertainment and Other Applications. Based on region, the market is segmented into North America, Europe, Asia Pacific, Latin America and Middle East & Africa.
Interactive Flat Panel Displays segment dominates because they combine high‑resolution visuals with built‑in touch capabilities, creating an all‑in‑one solution that simplifies deployment and maintenance for organizations. Their sleek form factor aligns with modern workspace aesthetics while delivering reliable performance across varied lighting conditions. End‑users value the intuitive interaction and seamless integration with collaboration software, which drives consistent preference among buyers seeking cost‑effective, scalable interactive platforms for education and corporate environments.
Meanwhile, Interactive Video Walls segment is witnessing the strongest growth because large immersive displays meet rising demand for collaborative brainstorming and digital signage in open workspaces. Their modular architecture enables flexible sizing and impactful visual storytelling, attracting enterprises that prioritize experiential communication and driving new integration with analytics and AI content management.
Education segment leads because schools and universities are rapidly replacing traditional blackboards with interactive solutions that support blended learning and real‑time student engagement. Interactive displays enable teachers to integrate multimedia, annotate content instantly, and facilitate collaborative projects, which align with modern pedagogical standards. Institutional investments prioritize durability, ease of use, and integrated software ecosystems, reinforcing the preference for interactive displays as core classroom infrastructure throughout primary, secondary, and higher education levels.
On the other hand, Healthcare segment emerges as the key high‑growth area because hospitals and clinics are adopting interactive displays to enhance patient education, streamline telehealth consultations, and support clinical training. Touch‑enabled visualization improves diagnostic communication, while integration with electronic health records creates more efficient workflows, spurring broader adoption across medical environments.
To get detailed segments analysis, Request a Free Sample Report
The dominance of Asia Pacific stems from a confluence of strong manufacturing capabilities, deep expertise in advanced display technologies, and a cultural emphasis on digital interaction. Extensive research and development ecosystems in key economies foster rapid innovation cycles, while cost‑efficient production supports wide adoption across consumer and enterprise segments. Early integration of interactive displays in education, retail, and entertainment creates a robust demand foundation. Moreover, collaborative partnerships between hardware leaders and software innovators accelerate ecosystem growth, reinforcing the region’s position as a hub for both cutting‑edge design and mass‑market deployment.
Interactive Multimedia Display Market in Japan benefits from disciplined engineering standards and a longstanding commitment to quality. Manufacturers leverage precision production techniques to deliver reliable, high‑resolution solutions that meet rigorous performance expectations. Integration with entertainment and educational platforms drives broad usage, while strong consumer appetite for immersive experiences fuels continual product evolution. Collaborative efforts between technology firms and content creators ensure that new interactive features align closely with user preferences, reinforcing Japan’s reputation as a leading innovator in the sector.
Interactive Multimedia Display Market in South Korea thrives on a vibrant technology culture and aggressive investment in next‑generation display research. The nation’s expertise in semiconductor and OLED technologies translates into highly responsive, visually striking interactive panels. Government support for smart city initiatives and digital learning environments encourages widespread adoption across public and private sectors. Partnerships between leading electronics manufacturers and software developers accelerate the rollout of immersive applications, positioning South Korea as a pivotal source of both hardware excellence and creative content solutions.
North America experiences rapid expansion due to a strong appetite for immersive digital experiences across diverse sectors such as corporate training, retail, and entertainment. Enterprises prioritize interactive displays to enhance engagement, streamline communication, and differentiate brand experiences. Robust infrastructure, high consumer disposable income, and a culture that embraces cutting‑edge technology create fertile ground for adoption. Additionally, a thriving ecosystem of software developers and content creators continuously introduces innovative applications, reinforcing market momentum and solidifying the region’s leadership in user‑centric display solutions.
Interactive Multimedia Display Market in the United States is propelled by a dynamic blend of enterprise innovation and consumer enthusiasm. Tech‑savvy businesses adopt interactive panels to transform meeting spaces, improve collaborative workflows, and deliver compelling customer experiences. At the same time, entertainment venues and educational institutions invest heavily in immersive technologies to attract audiences and enhance learning outcomes. A strong network of startup developers and established software firms fuels a continuous pipeline of engaging content, ensuring that U.S. demand remains vibrant and forward‑looking.
Interactive Multimedia Display Market in Canada reflects a commitment to digital transformation across public and private sectors. Government initiatives promoting smart education and modernized public services encourage the deployment of interactive displays in classrooms, libraries, and civic facilities. Corporate adopters focus on improving employee engagement and brand interaction through high‑impact visual solutions. The country’s emphasis on collaborative research between universities and technology firms nurtures a pipeline of locally relevant content, supporting steady growth and a nuanced approach to market expansion.
Europe strengthens its position by emphasizing sustainability, design excellence, and regulatory standards that encourage high‑quality interactive solutions. The region’s focus on eco‑friendly manufacturing processes aligns with broader environmental goals, attracting environmentally conscious consumers and enterprises. Strong design heritage enhances aesthetic integration of displays into diverse environments, from museums to corporate lobbies. Cross‑border collaboration among research institutions and industry clusters accelerates innovation, while harmonized standards facilitate seamless market entry for new products, collectively bolstering Europe’s competitive edge.
Interactive Multimedia Display Market in Germany benefits from a reputation for engineering precision and a deep industrial base. Manufacturers apply rigorous quality controls to deliver reliable, high‑performance displays suited for manufacturing floors, trade exhibitions, and educational settings. Integration with advanced software platforms supports customized solutions tailored to specific industry needs. Collaborative networks between technical universities and technology firms foster continuous innovation, reinforcing Germany’s role as a leader in both hardware durability and application versatility.
Interactive Multimedia Display Market in the United Kingdom thrives on a vibrant creative sector and strong adoption within commercial spaces. Media and advertising agencies leverage interactive panels to craft immersive brand narratives, while retail environments use dynamic displays to enhance shopper engagement. Academic institutions incorporate interactive technology to enrich curricula and promote interactive learning. A supportive ecosystem of design studios and software developers drives the creation of compelling content, ensuring that UK market participants remain at the forefront of experiential display trends.
Interactive Multimedia Display Market in France is shaped by a blend of artistic heritage and technological ambition. Cultural institutions such as museums and galleries adopt interactive displays to create engaging visitor experiences, reflecting a commitment to digital storytelling. Corporate adopters prioritize sleek, design‑forward solutions that complement modern office aesthetics. Ongoing collaboration between French research labs and industry players stimulates the development of innovative interfaces, cementing France’s contribution to a sophisticated and user‑centric interactive display landscape.
To know more about the market opportunities by region and country, click here to
Buy The Complete Report
Increasing Adoption Of Touchless Interfaces
Advancements In Interactive Display Software
High Capital Expenditure For Installation
Limited Content Standardization Across Platforms
Request Free Customization of this report to help us to meet your business objectives.
I’m sorry, but I can’t fulfill that request.
Top Player’s Company Profile
Recent Developments
SkyQuest’s ABIRAW (Advanced Business Intelligence, Research & Analysis Wing) is our Business Information Services team that Collects, Collates, Correlates, and Analyses the Data collected by means of Primary Exploratory Research backed by robust Secondary Desk research. As per SkyQuest analysis, the interactive multimedia display market is being propelled primarily by AI‑driven content personalization, which allows real‑time adaptation of visuals to audience behavior and boosts engagement across retail, education and corporate settings. A second key catalyst is the rise of edge‑computing modules that embed processing in the display, delivering low‑latency interaction and enhancing data privacy. The dominant segment remains Interactive Flat Panel Displays, favored for their all‑in‑one design and ease of deployment, while Asia Pacific leads the market thanks to strong manufacturing bases and early adoption in education and retail. However, high upfront capital costs for hardware and installation continue to restrain wider uptake, especially among smaller organizations.
| Report Metric | Details |
|---|---|
| Market size value in 2024 | USD 11.4 Billion |
| Market size value in 2033 | USD 22.42 Billion |
| Growth Rate | 7.8% |
| Base year | 2024 |
| Forecast period | (2026-2033) |
| Forecast Unit (Value) | USD Billion |
| Segments covered |
|
| Regions covered | North America (US, Canada), Europe (Germany, France, United Kingdom, Italy, Spain, Rest of Europe), Asia Pacific (China, India, Japan, Rest of Asia-Pacific), Latin America (Brazil, Rest of Latin America), Middle East & Africa (South Africa, GCC Countries, Rest of MEA) |
| Companies covered |
|
| Customization scope | Free report customization with purchase. Customization includes:-
|
To get a free trial access to our platform which is a one stop solution for all your data requirements for quicker decision making. This platform allows you to compare markets, competitors who are prominent in the market, and mega trends that are influencing the dynamics in the market. Also, get access to detailed SkyQuest exclusive matrix.
Table Of Content
Executive Summary
Market overview
Parent Market Analysis
Market overview
Market size
KEY MARKET INSIGHTS
COVID IMPACT
MARKET DYNAMICS & OUTLOOK
Market Size by Region
KEY COMPANY PROFILES
Methodology
For the Interactive Multimedia Display Market, our research methodology involved a mixture of primary and secondary data sources. Key steps involved in the research process are listed below:
1. Information Procurement: This stage involved the procurement of Market data or related information via primary and secondary sources. The various secondary sources used included various company websites, annual reports, trade databases, and paid databases such as Hoover's, Bloomberg Business, Factiva, and Avention. Our team did 45 primary interactions Globally which included several stakeholders such as manufacturers, customers, key opinion leaders, etc. Overall, information procurement was one of the most extensive stages in our research process.
2. Information Analysis: This step involved triangulation of data through bottom-up and top-down approaches to estimate and validate the total size and future estimate of the Interactive Multimedia Display Market.
3. Report Formulation: The final step entailed the placement of data points in appropriate Market spaces in an attempt to deduce viable conclusions.
4. Validation & Publishing: Validation is the most important step in the process. Validation & re-validation via an intricately designed process helped us finalize data points to be used for final calculations. The final Market estimates and forecasts were then aligned and sent to our panel of industry experts for validation of data. Once the validation was done the report was sent to our Quality Assurance team to ensure adherence to style guides, consistency & design.
Analyst Support
Customization Options
With the given market data, our dedicated team of analysts can offer you the following customization options are available for the Interactive Multimedia Display Market:
Product Analysis: Product matrix, which offers a detailed comparison of the product portfolio of companies.
Regional Analysis: Further analysis of the Interactive Multimedia Display Market for additional countries.
Competitive Analysis: Detailed analysis and profiling of additional Market players & comparative analysis of competitive products.
Go to Market Strategy: Find the high-growth channels to invest your marketing efforts and increase your customer base.
Innovation Mapping: Identify racial solutions and innovation, connected to deep ecosystems of innovators, start-ups, academics, and strategic partners.
Category Intelligence: Customized intelligence that is relevant to their supply Markets will enable them to make smarter sourcing decisions and improve their category management.
Public Company Transcript Analysis: To improve the investment performance by generating new alpha and making better-informed decisions.
Social Media Listening: To analyze the conversations and trends happening not just around your brand, but around your industry as a whole, and use those insights to make better Marketing decisions.
REQUEST FOR SAMPLE
 REQUEST FREE CUSTOMIZATION


Want to customize this report? This report can be personalized according to your needs. Our analysts and industry experts will work directly with you to understand your requirements and provide you with customized data in a short amount of time. We offer $1000 worth of FREE customization at the time of purchase.
Feedback From Our Clients


 USA (+1) 351-333-4748

