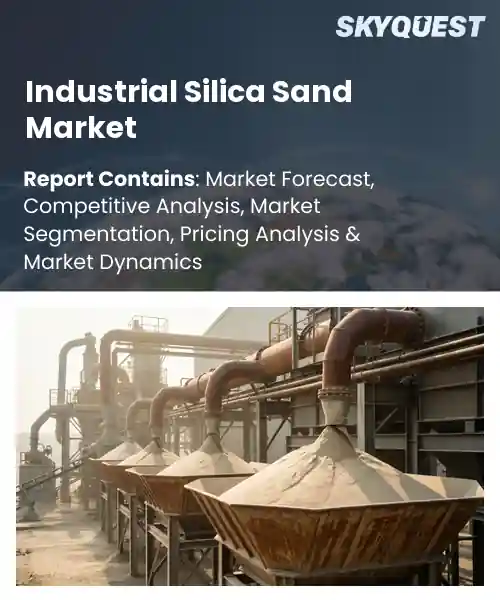
Industrial Silica Sand Market
Report ID: SQMIG15J2187
Report ID: SQMIG15J2187
[email protected]
USA +1 351-333-4748
Report ID:
SQMIG15J2187 |
Region:
Global |
Published Date: June, 2026
Pages:
157
|Tables:
180
|Figures:
79


Global Industrial Silica Sand Market size was valued at USD 15.50 Billion in 2024 and is poised to grow from USD 16.38 Billion in 2025 to USD 25.53 Billion by 2033, growing at a CAGR of 5.7% during the forecast period (2026-2033).
The industrial silica sand market growth is majorly contributed by glass manufacturing. The quality of the raw material, in terms of its physical purity, grain size and chemical stability is a determinant in container glass, flat glass for construction and specialty optics. Industrial silica sand is a high-grade quartz used in foundries, hydraulic fracturing and filtration. It makes a difference because it supports industries from urban construction to solar panel production. Over decades the market evolved from local quarry supply to regional trade as demand became concentrated in manufacturing hubs. For example European container glass plants began sourcing higher purity imports, while US fracking activity created temporary volume spikes.
One major trend influencing the global silica sand market is the rising demand for higher purity grades from renewable energy and modern glass applications, following concentrated demand in manufacturing hubs. Solar panel and architectural glass makers are demanding more controlled grain and fewer contaminants, and producers are investing in processing facilities and beneficiation technologies to meet specifications and receive premium prices. Those investments have increased entry costs, but presented opportunities for specialist processors and logistics companies that move bulk material to coastal refineries. The result has been new mine approvals in Western Australia and upgraded plants across Europe to feed glass manufacturers.
How is AI Optimizing Supply Chain Forecasting in the Industrial Silica sand Market?
Using demand sensing, probabilistic forecasting and real-time operational data, AI improves supply chain forecasting in the industrial silica sand market trends. The key aspects are quality driven demand signals, visibility of suppliers & logistics and anomaly detection that flags off off spec production early. And producers and processors are moving away from fixed monthly plans to constant forecasts that take in market signals from glass makers and semiconductor buyers. This makes lead times more predictable and minimizes costly rework and rush shipments. Energy and transport constraints are modeled with purity constraints allowing planners to prioritize orders and allocate scarce premium material to highest value uses.
Homerun Resources March 2026, announced a binding distribution agreement and cited AI enabled energy and process controls that support steadier throughput and more reliable shipment timing, helping customers and suppliers to align forecasts and reduce supply disruptions.
Market snapshot - (2026-2033)
Global Market Size
USD 15.5 Billion
Largest Segment
Glass Grade Silica Sand
Fastest Growth
Hydraulic Fracturing (Frac) Sand
Growth Rate
5.7% CAGR
To get more insights on this market click here to Request a Free Sample Report
Global industrial silica sand market is segmented by product type, application, grade, end user industry, processing type, distribution channel and region. Based on product type, the market is segmented into glass grade silica sand, foundry grade silica sand, hydraulic fracturing (Frac) sand, chemical grade silica sand, construction grade silica sand and others. Based on application, the market is segmented into glass manufacturing, foundry casting, hydraulic fracturing, construction, chemical production, water filtration and others. Based on grade, the market is segmented into high purity silica sand and standard purity silica sand. Based on end user industry, the market is segmented into glass industry, oil & gas industry, foundry industry, construction industry, chemical industry, water treatment industry and others. Based on processing type, the market is segmented into washed silica sand, dry silica sand and coated silica sand. Based on distribution channel, the market is segmented into direct sales and distributors & traders. Based on region, the market is segmented into North America, Europe, Asia Pacific, Latin America and Middle East & Africa.
The glass grade silica sand segment leads the market as its high purity and controlled particle size distribution are critical in achieving the optical clarity and strength required in glass production, thus ensuring steady demand from established glass manufacturers. Its leadership is reinforced by reliable processing protocols and long term supply agreements with glassmakers, while investment in beneficiation technologies reduces variability and production costs, creating efficient scale advantages that sustain its central role in the industrial silica sand market.
But foundry grade silica sand is showing the highest growth momentum, as foundry users are looking for higher performance sand for precision casting, supported by improvements in reclamation and coating technologies that allow for greater reuse and lower costs, opening up possibilities for smaller foundries and specialized metal component makers.
Distributors & traders segment is expected to hold the largest market share. Broad distribution networks, inventory buffering and relationships with diverse industrial buyers allow efficient matching of silica sand grades to specific application needs. These channel partners can lower procurement complexity and buffer supply volatility through blending, packaging and logistics services, which incentivizes manufacturers to depend on intermediaries for flexible sourcing, while catering to smaller end users and offering technical support to underpin their market position.
But direct sales is experiencing the most momentum in growth as manufacturers seek to source directly to ensure consistent quality, and agree specific supply deals. Digital procurement tools, closer supplier integration and demand for traceable certified grades are driving expansion of direct purchasing. These accelerate supplier partnerships and enable customization led opportunities across end users.
To get detailed segments analysis, Request a Free Sample Report
The dominance of the Asia Pacific is attributed to integrated industrial demand, well established supply chains and concentrated manufacturing clusters that are heavily reliant on high quality silica sand. The strong downstream industry, strategic investment in mining and processing infrastructure and active collaboration between private firms and public agencies to secure access to raw materials, result in regional leadership. Technological adoption in beneficiation, and logistics improvements shorten cycle times and improve consistency, while domestic consumption patterns, export networks and proximity to major end markets reinforce a competitive advantage across the value chain. Research and regulatory frameworks help in resource management and quality standards that enable producers to meet the diverse industrial specifications. Investments in environmental management and circular use also help to align production with evolving procurement requirements. The size, reliability of supply and continuing process improvements ensure that leadership is maintained and further capital and partnerships are attracted from beyond regional boundaries.
Industrial silica sand market share in Japan is more advanced in processing, has higher standards for purity of material and is closely integrated with the precision glass and electronics manufacturers. Local producers highlight quality control, beneficiation technologies and traceability to meet demanding industrial specifications. Collaboration between industry and research institutes helps to ensure continuity of supply and innovation in materials. Logistics networks and strategic sourcing to reduce lead times for a resilient high value downstream applications market through responsive supply.
Industrial silica sand market outlook in South Korea strong industrial demand, coupled with advanced beneficiation knowhow and investment in high purity outputs for electronics and specialty glass sectors. Local producers focus on process optimization, quality assurance and coordination with downstream manufacturers. Technology transfer and logistics efficiency through government and private initiatives. Supply strategies emphasize reliability and responsiveness to manufacturers, reinforcing the role of silica sand as a critical input for precision industries and market stability.
Rapid growth in North America is driven by a diverse demand for end uses, strategic investments in domestic supply chains and a focus on sourcing reliable materials for key industrial sectors. Market momentum is based on joint efforts of producers, industrial consumers and logistics providers to reduce delivery times and increase material consistency. The focus on quality standards, beneficiation capacity and innovation in processing helps push silica sand into higher value applications. Policy frameworks, infrastructure upgrades and partnerships with technology providers enable better resource management and end to end traceability. Emphasizing environmental stewardship and community engagement reduces operational friction and promotes sustainable resource utilization. Customized product offerings cater to specific industrial requirements.
Industrial silica sand market forecast in United States has a diverse demand base for construction, glass, chemicals and specialty manufacturing which requires different size distributions and purity grades. The industry focus is on logistical efficiency, scalable processing and stringent quality assurance to serve industrial customers. The collaboration between producer and end user allows for customized product development and improved chain resilience. Environmental management focus Readies suppliers for changing procurement expectations.
Industrial silica sand market regional outlook in Canada is influenced by an emphasis on responsible resource development, proximity to industrial hubs and cooperative supply agreements with downstream manufacturers. Producers focus on robust beneficiation, strict quality controls and transparent sourcing practices to meet the various specifications of the industrial sector. Investments in logistics and multimodal transport improve access to export markets. Stakeholder engagement and environmental management practices are crucial for ensuring operational continuity and effective alignment of production with corporate and procurement requirements.
Europe is strengthening its position by focusing on quality standards, circular economy practices and close integration between suppliers and sophisticated downstream industries. Harmonised regulatory frameworks supporting responsible extraction, rehabilitation and material stewardship while maintaining high product specifications boost regional competitiveness. Investment in beneficiation technology, material testing and traceability systems allow producers to meet stringent industrial requirements for purity and particle distribution. Cross border logistics networks and collaboration between research institutions and private firms accelerate innovation in processing and sustainable use and support European suppliers in serving demanding markets with reliable, high quality silica sand offerings. Strategic product diversification into specialty grades for glassmaking, electronics and chemical applications enhances market appeal. Tailored products can be developed in shorter development cycles when partnerships connect mining, processing and end use expertise. More focus on environmental compliance and community consultation allows for long term operational permissions and access to markets across jurisdictions.
Industrial silica sand market regional forecast in Germany supported by solid engineering base and high standards for material quality serving glass, foundry and specialty chemical industries. Producers focus on advanced screening, washing and quality assurance to ensure consistent specifications. Collaboration with technical institutes and downstream companies enables tailored material grades. Reliable, traceable supply to industrial customers needing high performance silica sand and consistency is made possible through efficient logistics and strict environmental compliance.
Industrial silica sand market analysis in United Kingdom is analyzed for its compatibility with advanced manufacturing sectors and its high quality requirements for applications in glass, filtration, and chemicals. Suppliers concentrate on beneficiation, particle sizing and documentation to meet stringent procurement standards. Deliveries for industrial customers are supported by investments in processing technology and logistics connectivity. Close coordination with downstream users and providers allows for the development of specialized product grades and increases transparency of the supply chain, which in turn strengthens the credibility of suppliers in export markets.
Industrial silica sand industry trends in France is driven by the glassmaking, construction and specialty chemical sectors with critical purity and consistency requirements. Producers emphasize beneficiation, testing and documentation to meet industrial specifications. Cooperation with research centers and downstream companies helps development of specialized grades and improvements. Logistics efficiency and environmental management practices are aimed at ensuring continuity of supply while supplier responsiveness to procurement requirements is key to enhancing competitiveness in domestic markets regionally.
To know more about the market opportunities by region and country, click here to
Buy The Complete Report
Rising Demand In Construction Sector
Expansion Of Industrial Glass Production
Environmental Regulations on Mining
Scarcity Of High Purity Deposits
Request Free Customization of this report to help us to meet your business objectives.
The global industrial silica sand market is characterized by competitive dynamics of consolidation, secure access to high purity deposits and proprietary processing. Big companies like Sibelco pursue M&A and joint ventures, like its Diatreme joint venture and acquisitions, while private equity moves like Apollo's take private of U.S. Silica change hands. The new entrants are pushing the envelope of extraction and purification innovations like the patent pending process of Sio Silica.
Top Player’s Company Profile
Recent Developments
SkyQuest’s ABIRAW (Advanced Business Intelligence, Research & Analysis Wing) is our Business Information Services team that Collects, Collates, Correlates, and Analyses the Data collected by means of Primary Exploratory Research backed by robust Secondary Desk research. As per SkyQuest analysis, the global industrial silica sand market is propelled by a key driver, the expansion in industrial glass manufacturing which increases demand for high purity, tightly graded sand, while a second driver is rising construction activity that sustains broad volume needs. A major restraint is stringent environmental regulations on mining that raise compliance costs and slow project approvals. Asia Pacific dominates the market supported by integrated industrial clusters, processing capacity and strong downstream demand. The glass grade silica sand segment remains the market leader due to its critical role in optical clarity and strength for container, flat and specialty glass, encouraging beneficiation investments and long term supply agreements.
| Report Metric | Details |
|---|---|
| Market size value in 2024 | USD 15.5 Billion |
| Market size value in 2033 | USD 25.53 Billion |
| Growth Rate | 5.7% |
| Base year | 2024 |
| Forecast period | (2026-2033) |
| Forecast Unit (Value) | USD Billion |
| Segments covered |
|
| Regions covered | North America (US, Canada), Europe (Germany, France, United Kingdom, Italy, Spain, Rest of Europe), Asia Pacific (China, India, Japan, Rest of Asia-Pacific), Latin America (Brazil, Rest of Latin America), Middle East & Africa (South Africa, GCC Countries, Rest of MEA) |
| Companies covered |
|
| Customization scope | Free report customization with purchase. Customization includes:-
|
To get a free trial access to our platform which is a one stop solution for all your data requirements for quicker decision making. This platform allows you to compare markets, competitors who are prominent in the market, and mega trends that are influencing the dynamics in the market. Also, get access to detailed SkyQuest exclusive matrix.
Table Of Content
Executive Summary
Market overview
Parent Market Analysis
Market overview
Market size
KEY MARKET INSIGHTS
COVID IMPACT
MARKET DYNAMICS & OUTLOOK
Market Size by Region
KEY COMPANY PROFILES
Methodology
For the Industrial Silica Sand Market, our research methodology involved a mixture of primary and secondary data sources. Key steps involved in the research process are listed below:
1. Information Procurement: This stage involved the procurement of Market data or related information via primary and secondary sources. The various secondary sources used included various company websites, annual reports, trade databases, and paid databases such as Hoover's, Bloomberg Business, Factiva, and Avention. Our team did 45 primary interactions Globally which included several stakeholders such as manufacturers, customers, key opinion leaders, etc. Overall, information procurement was one of the most extensive stages in our research process.
2. Information Analysis: This step involved triangulation of data through bottom-up and top-down approaches to estimate and validate the total size and future estimate of the Industrial Silica Sand Market.
3. Report Formulation: The final step entailed the placement of data points in appropriate Market spaces in an attempt to deduce viable conclusions.
4. Validation & Publishing: Validation is the most important step in the process. Validation & re-validation via an intricately designed process helped us finalize data points to be used for final calculations. The final Market estimates and forecasts were then aligned and sent to our panel of industry experts for validation of data. Once the validation was done the report was sent to our Quality Assurance team to ensure adherence to style guides, consistency & design.
Analyst Support
Customization Options
With the given market data, our dedicated team of analysts can offer you the following customization options are available for the Industrial Silica Sand Market:
Product Analysis: Product matrix, which offers a detailed comparison of the product portfolio of companies.
Regional Analysis: Further analysis of the Industrial Silica Sand Market for additional countries.
Competitive Analysis: Detailed analysis and profiling of additional Market players & comparative analysis of competitive products.
Go to Market Strategy: Find the high-growth channels to invest your marketing efforts and increase your customer base.
Innovation Mapping: Identify racial solutions and innovation, connected to deep ecosystems of innovators, start-ups, academics, and strategic partners.
Category Intelligence: Customized intelligence that is relevant to their supply Markets will enable them to make smarter sourcing decisions and improve their category management.
Public Company Transcript Analysis: To improve the investment performance by generating new alpha and making better-informed decisions.
Social Media Listening: To analyze the conversations and trends happening not just around your brand, but around your industry as a whole, and use those insights to make better Marketing decisions.
REQUEST FOR SAMPLE
 REQUEST FREE CUSTOMIZATION
Global Industrial Silica Sand Market size was valued at USD 15.5 Billion in 2024 and is poised to grow from USD 16.38 Billion in 2025 to USD 25.53 Billion by 2033, growing at a CAGR of 5.7% during the forecast period (2026-2033).
Competitive dynamics in the global industrial silica sand market center on consolidation, secure access to high purity deposits and proprietary processing. Major firms pursue M&A and joint ventures, for example Sibelco's acquisitions and its Diatreme joint venture, while private equity moves such as Apollo's take private of U.S. Silica change ownership. New entrants advance extraction and purification innovations exemplified by Sio Silica's patent pending process. 'U.S. Silica Holdings', 'Sibelco', 'Covia Holdings', 'Quarzwerke Group', 'Badger Mining Corporation', 'Mitsubishi Corporation', 'VRX Silica', 'Tochu Corporation', 'Australian Silica Quartz Group', 'SIL Industrial Minerals', 'Pattison Company', 'Minerali Industriali', 'Sunstate Sands', 'JFE Mineral & Alloy Company', 'Adwan Chemical Industries', 'G3 Minerals', 'Cape Flattery Silica Mines', 'Terengganu Silica Consortium', 'Smart Sand', 'SRC Sands'
Silica sand serves as a fundamental raw material in concrete, mortar, and numerous construction products, and growing construction activity elevates steady demand for high purity sand. Producers expand extraction and processing capacities to meet specification requirements, which supports investment throughout the supply chain and encourages upgrades in handling and logistics. Sustained procurement needs from building materials manufacturers prompt suppliers to secure consistent quality and reliable delivery, thereby reinforcing market expansion through increased production capability, improved access to end users, and stronger commercial confidence.
Specialty Silica Applications Expanding: Demand is shifting toward specialty silica grades tailored for high value end uses, driving suppliers to develop purer products and customized particle shapes. Manufacturers are collaborating with end users to co develop formulations that enhance performance in batteries, high performance coatings and advanced ceramics. This trend elevates margins and incentivizes investments in processing technology and quality systems. It also encourages vertical integration and strategic partnerships that secure offtake and enable faster commercialization of silica based material solutions across industrial applications.
Why does Asia Pacific Dominate the Global Industrial Silica Sand Market? |@12


Want to customize this report? This report can be personalized according to your needs. Our analysts and industry experts will work directly with you to understand your requirements and provide you with customized data in a short amount of time. We offer $1000 worth of FREE customization at the time of purchase.
Feedback From Our Clients


 USA (+1) 351-333-4748

