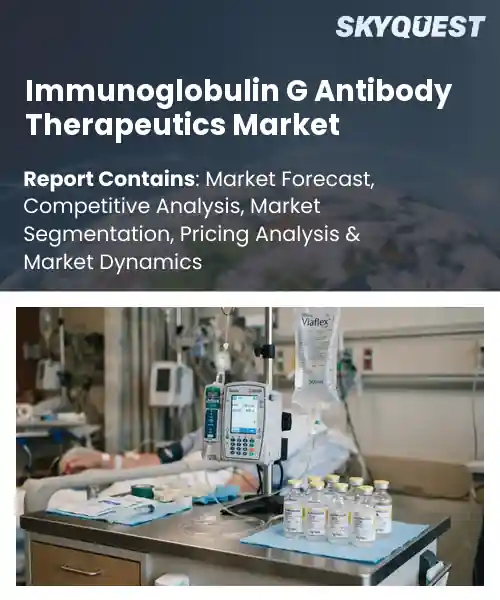
Immunoglobulin G Antibody Therapeutics Market
Report ID: SQMIG35H2740
Report ID: SQMIG35H2740
[email protected]
USA +1 351-333-4748
Report ID:
SQMIG35H2740 |
Region:
Global |
Published Date: September, 2026
Pages:
157
|Tables:
148
|Figures:
78


Global Immunoglobulin G Antibody Therapeutics Market size was valued at USD 14.8 Billion in 2024 and is poised to grow from USD 15.9 Billion in 2025 to USD 28.14 Billion by 2033, growing at a CAGR of 7.4% during the forecast period (2026-2033).
The global immunoglobulin G (IgG) antibody therapeutics market encompasses biologics that harness the specificity of IgG molecules to treat a range of diseases, from oncology to autoimmune disorders. Its importance stems from the ability of IgG to engage immune effector functions such as antibody‑dependent cellular cytotoxicity, driving superior clinical outcomes compared with small‑molecule drugs. Historically, the market emerged in the late 1990s with the approval of rituximab, and momentum accelerated as biosimilar pathways opened, enabling cost‑effective copies of trastuzumab and adalimumab. This evolution has broadened the therapeutic pipeline, encouraging investment in engineered Fc variants that prolong half‑life and enhance potency. The principal growth driver is the convergence of advanced protein‑engineering platforms with expanding indications for IgG‑based therapies, fueling pipeline diversification and market expansion. As manufacturers adopt glyco‑optimization and bispecific design, they achieve higher affinity and reduced immunogenicity, translating into faster regulatory approvals and larger patient populations. Examples include the launch of amivantamab for non‑small‑cell lung cancer and the use of Fc‑engineered eculizumab in complement‑mediated hemolytic anemia, each generating multi‑billion‑dollar revenues. Consequently, investors allocate capital toward contract‑development and manufacturing organizations that specialize in high‑yield CHO cell lines, creating a virtuous cycle of capacity growth and price compression that further stimulates adoption.
How is AI accelerating target discovery in the Immunoglobulin G antibody therapeutics market?
AI is reshaping target discovery for IgG antibody therapeutics by integrating deep learning, structural modeling and high throughput screening. Algorithms predict antigen binding sites and prioritize disease relevant epitopes faster than traditional methods. This reduces the time from concept to candidate and lowers experimental waste. Companies now feed large proteomic datasets into generative models that suggest novel antibody frameworks. The market benefits from a pipeline filled with candidates that have higher affinity and better developability. Recent collaborations between biotech firms and cloud AI providers illustrate the shift toward data centric discovery. As a result investors see a more efficient path to clinical candidates.Regeneron June 2024, launched an AI driven platform that screens millions of protein structures to identify IgG targets, cutting early discovery cycles dramatically. The tool accelerates candidate selection and supports market growth by delivering more potent antibodies faster and reduces development risk across multiple disease areas.
Market snapshot - (2026-2033)
Global Market Size
USD 14.8 Billion
Largest Segment
Monoclonal Antibodies
Fastest Growth
Bispecific Antibodies
Growth Rate
7.4% CAGR
To get more insights on this market click here to Request a Free Sample Report
Global immunoglobulin g antibody therapeutics market is segmented by therapeutic type, igg subclass, therapeutic area, route of administration, end user and region. Based on therapeutic type, the market is segmented into Monoclonal Antibodies, Bispecific Antibodies, Antibody-Drug Conjugates and Other IgG-Based Therapeutics. Based on igg subclass, the market is segmented into IgG1, IgG2, IgG3 and IgG4. Based on therapeutic area, the market is segmented into Oncology, Autoimmune & Inflammatory Diseases, Infectious Diseases, Neurological Disorders and Other Therapeutic Areas. Based on route of administration, the market is segmented into Intravenous, Subcutaneous and Other Routes. Based on end user, the market is segmented into Hospitals & Clinics, Specialty Centers and Other Healthcare Providers. Based on region, the market is segmented into North America, Europe, Asia Pacific, Latin America and Middle East & Africa.
Monoclonal Antibodies segment dominates because it has established clinical validation across multiple disease indications, offering predictable pharmacokinetics and a well understood safety profile. Its long history of regulatory approvals builds confidence among developers and payers, encouraging continued investment. The breadth of platform technologies and scalable manufacturing further reinforce its leadership, making it the cornerstone of the immunoglobulin g antibody therapeutics market and driving pipeline diversification across emerging modalities for future growth.
Meanwhile, Bispecific Antibodies segment emerges as the most rapidly expanding area because it enables simultaneous targeting of two disease pathways, offering enhanced efficacy and reduced resistance. Ongoing clinical breakthroughs and strategic partnerships accelerate its adoption, while regulatory incentives for innovative therapies boost investor confidence, propelling market expansion and new opportunity creation.
IgG1 segment dominates because its strong effector functions and high affinity for Fc receptors make it ideal for most therapeutic designs. The subclass’s proven safety record and versatility across multiple platforms encourage its selection for both oncology and inflammatory indications, reinforcing its central position in the igg antibody therapeutics landscape. Its robust manufacturing yields and predictable pharmacodynamics also lower development risk, attracting broad investment and accelerating pipeline progression for diverse disease targets.
Conversely, IgG4 segment is witnessing the strongest growth momentum because its reduced effector activity minimizes immune related adverse events, making it attractive for chronic autoimmune therapies. Emerging platform technologies that engineer Fc regions to enhance half life while preserving safety are driving its adoption, and regulatory pathways favoring low immunogenicity biologics further accelerate market uptake and future expansion.
To get detailed segments analysis, Request a Free Sample Report
North America maintains leadership because of advanced research ecosystems, integrated supply chains, and strong reimbursement frameworks that encourage adoption of high‑cost biologics. Robust investment from major biotech firms and academic collaborations accelerates pipeline development, while regulatory agencies provide clear pathways for approval. The presence of world‑class manufacturing facilities ensures reliable product quality and capacity to meet global demand. Healthcare providers in the region exhibit high familiarity with antibody therapies, supporting rapid uptake. Additionally, patient advocacy groups and well‑established insurance mechanisms create a supportive environment that reduces barriers to market entry, reinforcing the region’s position at the forefront of immunoglobulin G innovation.
Immunoglobulin G Antibody Therapeutics Market in the United States benefits from a dense network of research universities and leading pharmaceutical companies that drive continuous innovation. A proactive regulatory environment encourages early‑stage clinical exploration, while extensive insurance coverage facilitates patient access. Strong intellectual property protection attracts foreign investment, and a mature distribution infrastructure supports rapid product launch across major medical centers and fostering collaborative networks that enhance therapy development pathways today.
Immunoglobulin G Antibody Therapeutics Market in Canada is supported by a health research ecosystem that links government agencies, universities and biotech incubators. Clear regulatory guidance promotes streamlined approval processes, while funded health services ensure equitable patient access. Strong emphasis on cost‑effectiveness drives adoption of proven therapies, and an established network of specialty pharmacies facilitates distribution to remote communities. This synergy sustains growth and positions Canada as a North American hub.
Europe experiences rapid expansion due to strong public healthcare commitments, sophisticated clinical research networks, and a collaborative regulatory landscape that harmonizes standards across member states. Government‑funded programs encourage early‑stage innovation, while an extensive tradition of academic excellence fuels a pipeline of novel candidates. Reimbursement policies that prioritize therapeutic value enable broader patient reach, and the presence of several global biotech hubs fosters cross‑border collaborations. Furthermore, rising awareness of immune‑mediated diseases among clinicians and patients drives demand for targeted antibody solutions. The combined effect of policy support, scientific depth and market openness positions Europe as a vibrant arena for immunoglobulin G therapeutic development and adoption.
Immunoglobulin G Antibody Therapeutics Market in Germany benefits from a dense concentration of research institutes and pharmaceutical giants that champion clinical programs. A transparent regulatory framework aligned with European standards accelerates product entry, while health insurance schemes provide coverage for advanced therapies. Robust manufacturing capabilities support domestic consumption and export, and strong physician networks promote early adoption in care centers. This environment consolidates Germany’s status as a leading European market.
Immunoglobulin G Antibody Therapeutics Market in the United Kingdom is propelled by a biotech cluster centered on leading research hospitals and startups. Streamlined regulatory pathways under a unified authority enable clinical progression, and national health services prioritize treatments through commissioning. Academic‑industry collaborations generate a flow of novel candidates, while specialist centres adopt therapies quickly, feeding evidence. This ecosystem underpins the United Kingdom’s position as the fastest growing market in Europe.
Immunoglobulin G Antibody Therapeutics Market in France is emerging thanks to strong governmental incentives that nurture biotech ventures and foster translational research. A harmonized regulatory environment aligned with European criteria simplifies trial initiation, while national health insurance embraces innovative biologics under agreements. Growing networks of hospitals accelerate patient enrollment, and consortia between academia and industry nurture a pipeline of antibody candidates. These elements drive France’s ascent in the European landscape.
Asia Pacific is strengthening its position through a combination of expanding clinical research capacity, government‑backed funding mechanisms and a surge in domestic biopharma manufacturing. Nations across the region are investing heavily in biotech parks that integrate R&D with production, reducing reliance on imports and accelerating time‑to‑market. Regulatory agencies are adopting expedited pathways that align with international standards, encouraging multinational collaborations. Rising prevalence of immune‑related conditions fuels demand, while increasing awareness among clinicians drives early adoption of antibody therapies. Together, these factors create a fertile ecosystem that propels the Asia Pacific region toward greater influence in the global immunoglobulin G therapeutic arena.
Immunoglobulin G Antibody Therapeutics Market in Japan benefits from a mature pharmaceutical sector supported by research institutions and a clear regulatory roadmap for biologics. Comprehensive national health coverage ensures patient access to advanced treatments, while public‑private partnerships stimulate innovation pipelines. Strong emphasis on quality manufacturing and stringent approval standards uphold product integrity, and specialty hospitals facilitate clinical uptake. This synergy positions Japan as a pivotal player in the regional market.
Immunoglobulin G Antibody Therapeutics Market in South Korea is accelerated by government initiatives that fund biotech startups and streamline clinical trial approvals. Collaboration between universities and contract manufacturing organizations creates a loop of innovation and scale. National health reimbursement schemes increasingly cover high‑cost antibody products, expanding patient eligibility. Adoption by hospitals and expertise in biologics manufacturing reinforce South Korea’s emerging status as a contributor to the Asia Pacific regional market.
To know more about the market opportunities by region and country, click here to
Buy The Complete Report
Increasing Demand for Targeted Therapies
Advancements in Antibody Engineering Techniques
High Production Cost Challenges
Stringent Regulatory Approval Processes
Request Free Customization of this report to help us to meet your business objectives.
The IgG antibody therapeutics market is shaped by intense rivalry as leading firms pursue M&A, strategic alliances and platform innovations to secure pipeline advantage; Pfizer’s 2023 acquisition of Seagen bolsters its ADC and IgG capabilities, while Novartis’ 2021 partnership with Amgen accelerates bispecific IgG development, and Roche’s collaboration with Genmab expands its bispecific antibody portfolio, driving competitive pressure and rapid product differentiation.
Top Player’s Company Profile
Recent Developments
SkyQuest’s ABIRAW (Advanced Business Intelligence, Research & Analysis Wing) is our Business Information Services team that Collects, Collates, Correlates, and Analyses the Data collected by means of Primary Exploratory Research backed by robust Secondary Desk research. As per SkyQuest analysis the global IgG antibody therapeutics market is propelled primarily by the rising demand for targeted therapies that allow clinicians to treat cancers and autoimmune diseases with greater precision while a second strong catalyst comes from rapid advancements in antibody engineering that improve half‑life, affinity and safety. The market is still led by monoclonal antibodies which benefit from extensive clinical validation and scalable manufacturing. North America remains the dominant region thanks to its robust research ecosystem, supportive reimbursement and advanced manufacturing capacity. However, high production costs continue to limit wider adoption and create pricing pressure especially for smaller developers.
| Report Metric | Details |
|---|---|
| Market size value in 2024 | USD 14.8 Billion |
| Market size value in 2033 | USD 28.14 Billion |
| Growth Rate | 7.4% |
| Base year | 2024 |
| Forecast period | (2026-2033) |
| Forecast Unit (Value) | USD Billion |
| Segments covered |
|
| Regions covered | North America (US, Canada), Europe (Germany, France, United Kingdom, Italy, Spain, Rest of Europe), Asia Pacific (China, India, Japan, Rest of Asia-Pacific), Latin America (Brazil, Rest of Latin America), Middle East & Africa (South Africa, GCC Countries, Rest of MEA) |
| Companies covered |
|
| Customization scope | Free report customization with purchase. Customization includes:-
|
To get a free trial access to our platform which is a one stop solution for all your data requirements for quicker decision making. This platform allows you to compare markets, competitors who are prominent in the market, and mega trends that are influencing the dynamics in the market. Also, get access to detailed SkyQuest exclusive matrix.
Table Of Content
Executive Summary
Market overview
Parent Market Analysis
Market overview
Market size
KEY MARKET INSIGHTS
COVID IMPACT
MARKET DYNAMICS & OUTLOOK
Market Size by Region
KEY COMPANY PROFILES
Methodology
For the Immunoglobulin G Antibody Therapeutics Market, our research methodology involved a mixture of primary and secondary data sources. Key steps involved in the research process are listed below:
1. Information Procurement: This stage involved the procurement of Market data or related information via primary and secondary sources. The various secondary sources used included various company websites, annual reports, trade databases, and paid databases such as Hoover's, Bloomberg Business, Factiva, and Avention. Our team did 45 primary interactions Globally which included several stakeholders such as manufacturers, customers, key opinion leaders, etc. Overall, information procurement was one of the most extensive stages in our research process.
2. Information Analysis: This step involved triangulation of data through bottom-up and top-down approaches to estimate and validate the total size and future estimate of the Immunoglobulin G Antibody Therapeutics Market.
3. Report Formulation: The final step entailed the placement of data points in appropriate Market spaces in an attempt to deduce viable conclusions.
4. Validation & Publishing: Validation is the most important step in the process. Validation & re-validation via an intricately designed process helped us finalize data points to be used for final calculations. The final Market estimates and forecasts were then aligned and sent to our panel of industry experts for validation of data. Once the validation was done the report was sent to our Quality Assurance team to ensure adherence to style guides, consistency & design.
Analyst Support
Customization Options
With the given market data, our dedicated team of analysts can offer you the following customization options are available for the Immunoglobulin G Antibody Therapeutics Market:
Product Analysis: Product matrix, which offers a detailed comparison of the product portfolio of companies.
Regional Analysis: Further analysis of the Immunoglobulin G Antibody Therapeutics Market for additional countries.
Competitive Analysis: Detailed analysis and profiling of additional Market players & comparative analysis of competitive products.
Go to Market Strategy: Find the high-growth channels to invest your marketing efforts and increase your customer base.
Innovation Mapping: Identify racial solutions and innovation, connected to deep ecosystems of innovators, start-ups, academics, and strategic partners.
Category Intelligence: Customized intelligence that is relevant to their supply Markets will enable them to make smarter sourcing decisions and improve their category management.
Public Company Transcript Analysis: To improve the investment performance by generating new alpha and making better-informed decisions.
Social Media Listening: To analyze the conversations and trends happening not just around your brand, but around your industry as a whole, and use those insights to make better Marketing decisions.
REQUEST FOR SAMPLE
 REQUEST FREE CUSTOMIZATION


Want to customize this report? This report can be personalized according to your needs. Our analysts and industry experts will work directly with you to understand your requirements and provide you with customized data in a short amount of time. We offer $1000 worth of FREE customization at the time of purchase.
Feedback From Our Clients


 USA (+1) 351-333-4748

