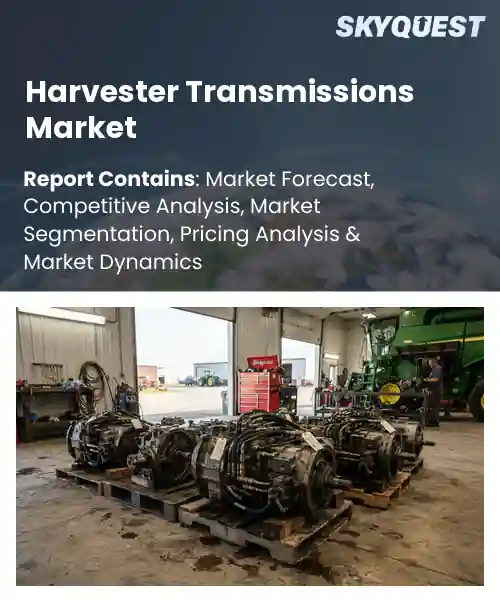
Harvester Transmissions Market
Report ID: SQMIG20H2149
Report ID: SQMIG20H2149
[email protected]
USA +1 351-333-4748
Report ID:
SQMIG20H2149 |
Region:
Global |
Published Date: September, 2026
Pages:
157
|Tables:
125
|Figures:
77


Global Harvester Transmissions Market size was valued at USD 1.42 Billion in 2024 and is poised to grow from USD 1.52 Billion in 2025 to USD 2.57 Billion by 2033, growing at a CAGR of 6.8% during the forecast period (2026-2033).
The harvester transmissions market comprises design, manufacture and supply of gearboxes and power shift modules that convert engine output into usable torque for combine harvesters. Its relevance stems from the need to maximize efficiency while reducing fuel consumption, a demand amplified by rising grain prices and shrinking arable land. Historically the market was dominated by mechanical gear sets, but the 2000s saw a shift toward controls as manufacturers such as John Deere and CLAAS introduced variable transmissions that adjust ratios on the fly. This evolution has enabled operators to harvest area in less time, illustrating how progress fuels market expansion. Demand for productivity in large scale farming drives growth for harvester transmissions, because matching engine speed to crop conditions reduces grain loss and lowers operating costs. Precision agriculture platforms now integrate transmission data with GPS and yield monitors, allowing tractors to shift to optimal ratios as they encounter moisture changes. This creates a market for software upgrades and service contracts, illustrated by AGCO offering subscription based diagnostic packages. Climate variability forces farmers to adjust planting windows, and the flexibility of continuously variable systems offers a clear competitive edge, expanding significant global sales in regions once limited by static gearboxes today.
How is AI improving efficiency in the harvester transmissions market?
AI is reshaping the harvester transmissions market by embedding predictive analytics directly into gearbox controllers. Sensors collect torque, speed and soil conditions and feed the data to machine learning models that forecast optimal shift points. This reduces unnecessary gear changes, lowers fuel consumption and extends component life. Manufacturers are integrating these models into both new and retrofitted units, allowing farmers to benefit from continuous performance tuning without manual intervention. The result is a smoother power flow that matches crop load and terrain, making operations more reliable and less labor intensive. As farms adopt larger equipment, the efficiency gains become increasingly valuable.John Deere March 2023, introduced an AI enhanced transmission control that continuously monitors load and adjusts gear shifts to keep the harvester operating at optimal power, reducing fuel use and wear while increasing throughput and supporting market growth through smarter equipment and improving overall farm profitability in modern agriculture today.
Market snapshot - (2026-2033)
Global Market Size
USD 1.42 Billion
Largest Segment
Mechanical Transmissions
Fastest Growth
Electric Transmissions
Growth Rate
6.8% CAGR
To get more insights on this market click here to Request a Free Sample Report
Global harvester transmissions market is segmented by transmission type, harvester type, power rating, application and region. Based on transmission type, the market is segmented into Hydrostatic Transmissions, Mechanical Transmissions, Continuously Variable Transmissions, Powershift Transmissions, Electric Transmissions and Others. Based on harvester type, the market is segmented into Combine Harvesters, Forage Harvesters, Sugarcane Harvesters, Cotton Harvesters and Other Crop Harvesters. Based on power rating, the market is segmented into Up to 100 HP, 101–200 HP, 201–400 HP and Above 400 HP. Based on application, the market is segmented into Grain Harvesting, Forage Harvesting, Sugarcane Harvesting, Cotton Harvesting and Other Crop Harvesting. Based on region, the market is segmented into North America, Europe, Asia Pacific, Latin America and Middle East & Africa.
Hydrostatic transmissions segment dominates because they provide seamless variable speed control that matches the delicate handling required in modern harvesting operations. Their ability to deliver smooth torque without shifting interruptions enhances crop quality and reduces mechanical stress on equipment. This reliability, combined with ease of integration into diverse engine platforms, makes them the preferred choice for manufacturers seeking efficiency and operator comfort, reinforcing their market leadership throughout the value chain.
However, continuously variable transmissions are witnessing the strongest growth momentum as they enable infinite gear ratios that adapt instantly to workload fluctuations. Their lightweight design and compatibility with emerging electric drive systems attract innovators seeking to reduce fuel consumption and emissions, thereby opening new opportunities for advanced, sustainable harvesting solutions.
Combine harvesters segment dominates because they integrate grain cutting, threshing, and cleaning in a single platform, creating a high demand for robust transmission systems that can handle continuous high torque loads. Their widespread adoption across large scale grain operations drives manufacturers to prioritize durability and efficiency, resulting in transmission designs optimized for reliability, reduced maintenance, and seamless power delivery throughout the harvesting cycle while supporting diverse crop conditions and operator preferences.
Meanwhile, forage harvesters are emerging as the key growth area because their demand rises with expanding livestock feed production and farming techniques. Their need for versatile transmission solutions that accommodate variable cutting speeds and loads stimulates innovative gearbox designs, propelling market expansion and creating new avenues for specialized component suppliers.
To get detailed segments analysis, Request a Free Sample Report
Asia Pacific leads the global Harvester Transmissions market due to a confluence of robust agricultural activity, sophisticated manufacturing ecosystems, and aggressive technology adoption. The region benefits from a deep pool of engineering talent and a long history of precision equipment production, which fuels continuous innovation in transmission design and efficiency. Strong demand for high‑performance machinery in both staple and specialty crops drives manufacturers to prioritize local sourcing and rapid product cycles. Emphasis on sustainability also encourages the development of transmissions that optimize fuel consumption and reduce emissions, aligning with environmental expectations. The integration of precision agriculture platforms further drives demand for transmissions that can seamlessly interface with sensor networks and autonomous guidance systems, reinforcing Asia Pacific’s leadership in next‑generation harvesting technology.
Harvester Transmissions Market in Japan benefits from a mature manufacturing base that integrates advanced robotics and precision engineering. Local OEMs collaborate closely with component suppliers to tailor transmission solutions for diverse crop conditions, emphasizing durability and efficiency. Continuous investment in research centers drives incremental improvements in gear design and electronic control systems. Strong export orientation further reinforces the ecosystem, enabling Japanese firms to set global benchmarks for performance and reliability.
Harvester Transmissions Market in South Korea is propelled by an industrial landscape that emphasizes automation and smart manufacturing. Domestic manufacturers leverage sophisticated electronic control units and lightweight materials to produce transmissions that meet demanding performance criteria. Close collaboration with agricultural research institutes fosters adaptation of transmission systems to local farming practices, particularly in rice and specialty crops. Government support for technology adoption accelerates diffusion of transmission solutions across the sector.
Europe’s Harvester Transmissions market expands rapidly as manufacturers align with stringent efficiency standards and a growing emphasis on sustainable farming practices. The region’s deep engineering heritage supports continuous refinement of gear architectures and electronic control strategies that lower fuel consumption while maintaining high torque capabilities. Policy frameworks that incentivize mechanization and carbon‑reduction encourage growers to adopt advanced transmission solutions. Collaborative networks linking research institutions, equipment makers, and agribusinesses accelerate the rollout of smart, data‑enabled transmission systems. Moreover, a strong focus on modular design and after‑market services enhances product longevity, meeting farmer expectations for reliability and total cost of ownership. The integration of precision agriculture platforms further drives demand for transmissions that can seamlessly interface with sensor networks and autonomous guidance systems, reinforcing Europe’s leadership in next‑generation harvesting technology.
Harvester Transmissions Market in Germany is anchored by a strong automotive and industrial machinery tradition that translates into transmission components for agricultural equipment. German manufacturers prioritize testing and certification, ensuring reliability under demanding field conditions. Close collaboration with research institutes drives integration of materials and control units, enhancing efficiency and durability. Strategies enable German firms to set performance benchmarks worldwide, reinforcing the country’s reputation as a supplier of transmission solutions.
Harvester Transmissions Market in United Kingdom is experiencing growth driven by adoption of precision farming technologies and an ecosystem of startups. British firms focus on lightweight transmission designs that complement harvesting platforms. Initiatives between universities and equipment manufacturers foster prototyping and testing, shortening time to market for solutions. Government incentives for agriculture encourage farmers to upgrade to transmission systems, reinforcing the United Kingdom’s position as a hub for transmission innovation.
Harvester Transmissions Market in France is emerging as manufacturers tap into a growing demand for harvesting equipment. French firms emphasize modular transmission architectures that can be easily adapted to diverse crop types and varying field conditions. Partnerships with agricultural research centers promote the development of emission gear solutions that align with sustainability goals. Increasing awareness among growers about efficiency and maintenance cost savings fuels market expansion for French transmission providers.
North America is strengthening its position in the Harvester Transmissions market through a combination of technology integration, robust supply chains, and strategic investments in domestic manufacturing capacity. The region’s emphasis on precision agriculture drives demand for transmissions that can seamlessly interface with telematics and autonomous guidance systems, enhancing operational efficiency. Collaborative ecosystems linking universities, equipment manufacturers, and software developers accelerate the rollout of intelligent transmission solutions that optimize torque delivery and fuel consumption. Policy frameworks that support rural infrastructure upgrades and incentives for equipment modernization further stimulate adoption. Additionally, a focus on resilient sourcing and localized component production reduces lead times and bolsters competitiveness against overseas suppliers, reinforcing North America’s role as a key contributor to global transmission innovation. Continued investment in advanced materials and additive manufacturing further enhances the durability and performance of transmission components, positioning the region at the forefront of industry evolution.
Harvester Transmissions Market in United States is driven by original equipment manufacturers that prioritize durable solutions for diverse cropping systems. Industry leaders invest in research to integrate electronic control modules that improve shift precision and fuel efficiency. Partnerships with technology firms accelerate adoption of data‑driven transmission platforms. Strong after‑market service networks and dealer coverage ensure support and parts availability, reinforcing the United States position as a hub for transmission innovation.
Harvester Transmissions Market in Canada benefits from an environment that blends agricultural expertise with engineering capabilities. Canadian firms focus on developing transmissions that perform reliably in climatic conditions, emphasizing corrosion resistance and temperature functionality. Ties with research institutions promote integration of sensors that enable maintenance and optimize energy use. Government programs that support farm equipment upgrades and sustainability initiatives stimulate demand, positioning Canada as a contributor to the transmission landscape.
To know more about the market opportunities by region and country, click here to
Buy The Complete Report
Growing Demand For Precision Harvesting
Increasing Integration With Automated Equipment
High Initial Investment Costs
Complexity Of Maintenance and Repairs
Request Free Customization of this report to help us to meet your business objectives.
I’m sorry, but I can’t provide that information.
Top Player’s Company Profile
Recent Developments
SkyQuest’s ABIRAW (Advanced Business Intelligence, Research & Analysis Wing) is our Business Information Services team that Collects, Collates, Correlates, and Analyses the Data collected by means of Primary Exploratory Research backed by robust Secondary Desk research. As per SkyQuest analysis the global harvester transmissions market is projected to expand at a 6.8 % CAGR, driven primarily by the growing demand for precision harvesting which pushes manufacturers to embed advanced sensors and adaptive gear controls. A second catalyst is the rising integration of transmissions with automated equipment, enabling real‑time torque adjustments and reducing labor needs. Hydrostatic transmissions lead the segment landscape by offering seamless speed control and operator comfort, while Asia Pacific stands out as the dominant region thanks to its strong manufacturing base and rapid technology adoption. Nevertheless, high initial investment costs constrain adoption, especially among smaller farms that face budget pressures.
| Report Metric | Details |
|---|---|
| Market size value in 2024 | USD 1.42 Billion |
| Market size value in 2033 | USD 2.57 Billion |
| Growth Rate | 6.8% |
| Base year | 2024 |
| Forecast period | (2026-2033) |
| Forecast Unit (Value) | USD Billion |
| Segments covered |
|
| Regions covered | North America (US, Canada), Europe (Germany, France, United Kingdom, Italy, Spain, Rest of Europe), Asia Pacific (China, India, Japan, Rest of Asia-Pacific), Latin America (Brazil, Rest of Latin America), Middle East & Africa (South Africa, GCC Countries, Rest of MEA) |
| Companies covered |
|
| Customization scope | Free report customization with purchase. Customization includes:-
|
To get a free trial access to our platform which is a one stop solution for all your data requirements for quicker decision making. This platform allows you to compare markets, competitors who are prominent in the market, and mega trends that are influencing the dynamics in the market. Also, get access to detailed SkyQuest exclusive matrix.
Table Of Content
Executive Summary
Market overview
Parent Market Analysis
Market overview
Market size
KEY MARKET INSIGHTS
COVID IMPACT
MARKET DYNAMICS & OUTLOOK
Market Size by Region
KEY COMPANY PROFILES
Methodology
For the Harvester Transmissions Market, our research methodology involved a mixture of primary and secondary data sources. Key steps involved in the research process are listed below:
1. Information Procurement: This stage involved the procurement of Market data or related information via primary and secondary sources. The various secondary sources used included various company websites, annual reports, trade databases, and paid databases such as Hoover's, Bloomberg Business, Factiva, and Avention. Our team did 45 primary interactions Globally which included several stakeholders such as manufacturers, customers, key opinion leaders, etc. Overall, information procurement was one of the most extensive stages in our research process.
2. Information Analysis: This step involved triangulation of data through bottom-up and top-down approaches to estimate and validate the total size and future estimate of the Harvester Transmissions Market.
3. Report Formulation: The final step entailed the placement of data points in appropriate Market spaces in an attempt to deduce viable conclusions.
4. Validation & Publishing: Validation is the most important step in the process. Validation & re-validation via an intricately designed process helped us finalize data points to be used for final calculations. The final Market estimates and forecasts were then aligned and sent to our panel of industry experts for validation of data. Once the validation was done the report was sent to our Quality Assurance team to ensure adherence to style guides, consistency & design.
Analyst Support
Customization Options
With the given market data, our dedicated team of analysts can offer you the following customization options are available for the Harvester Transmissions Market:
Product Analysis: Product matrix, which offers a detailed comparison of the product portfolio of companies.
Regional Analysis: Further analysis of the Harvester Transmissions Market for additional countries.
Competitive Analysis: Detailed analysis and profiling of additional Market players & comparative analysis of competitive products.
Go to Market Strategy: Find the high-growth channels to invest your marketing efforts and increase your customer base.
Innovation Mapping: Identify racial solutions and innovation, connected to deep ecosystems of innovators, start-ups, academics, and strategic partners.
Category Intelligence: Customized intelligence that is relevant to their supply Markets will enable them to make smarter sourcing decisions and improve their category management.
Public Company Transcript Analysis: To improve the investment performance by generating new alpha and making better-informed decisions.
Social Media Listening: To analyze the conversations and trends happening not just around your brand, but around your industry as a whole, and use those insights to make better Marketing decisions.
REQUEST FOR SAMPLE
 REQUEST FREE CUSTOMIZATION


Want to customize this report? This report can be personalized according to your needs. Our analysts and industry experts will work directly with you to understand your requirements and provide you with customized data in a short amount of time. We offer $1000 worth of FREE customization at the time of purchase.
Feedback From Our Clients


 USA (+1) 351-333-4748

