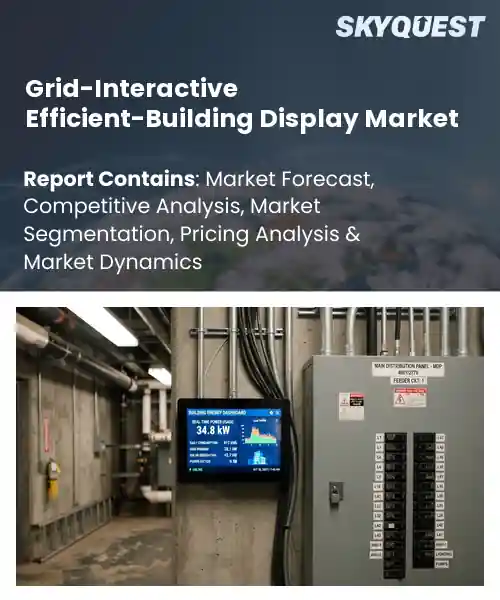
Grid-Interactive Efficient-Building Display Market
Report ID: SQMIG45J3006
Report ID: SQMIG45J3006
[email protected]
USA +1 351-333-4748
Report ID:
SQMIG45J3006 |
Region:
Global |
Published Date: October, 2026
Pages:
157
|Tables:
148
|Figures:
78


Global Grid-Interactive Efficient-Building Display Market size was valued at USD 780.0 Million in 2024 and is poised to grow from USD 898.56 Million in 2025 to USD 2787.2 Million by 2033, growing at a CAGR of 15.2% during the forecast period (2026-2033).
The Global Grid‑Interactive Efficient‑Building Display market consists of façade panels and screens that manage energy flows between a building’s envelope and the grid. Its relevance stems from energy‑efficiency mandates and the rise of renewable grids, prompting owners to seek assets that reduce consumption and export surplus power. Historically, the sector emerged from static photovoltaic glazing in the early 2010s, but the integration of IoT sensors and real‑time pricing algorithms transformed passive modules into interfaces. For example, a tower in Singapore retrofitted its curtain wall with grid‑interactive glazing, achieving a 15 % reduction in grid draw while earning revenue through demand‑response events.The adoption momentum rests on three forces: lower semiconductor prices, granular time‑of‑use tariffs, and corporate sustainability goals. When costs decline, developers can add power electronics without raising budgets, allowing façades to react swiftly to price spikes and capture arbitrage gains. Utilities are issuing real‑time tariffs that reward reduced draw during peaks; grid‑interactive displays automatically adjust lighting or harvest solar to meet those signals, turning cost avoidance into revenue. In Europe, an office campus combined interactive glazing with an AI energy manager, shrinking peak demand by 30 % and unlocking a €2 million incentive, demonstrating how policy and technology together expand market opportunity.
How are AI and IoT improving grid-interactive efficient‑building display efficiency?
Artificial intelligence and the Internet of Things are reshaping grid interactive efficient building displays by turning static panels into responsive communication hubs. AI analyzes real time energy prices, weather forecasts and occupancy patterns while IoT sensors feed continuous data on temperature, light levels and equipment status. The combined insight lets displays adjust brightness, content and power draw instantly to match grid conditions, reducing waste and improving occupant comfort. Today many commercial towers embed these smart panels as part of broader energy management systems, creating a feedback loop that aligns building demand with renewable supply. This approach is gaining traction as utilities encourage demand response participation and developers seek greener certifications.Honeywell announced in February 2024, a cloud based AI and IoT platform that powers interactive building displays to dynamically adjust lighting and information based on grid signals. The solution streamlines demand response and showcases the market’s shift toward smarter, energy aware visual systems.
Market snapshot - (2026-2033)
Global Market Size
USD 780.0 Million
Largest Segment
Energy Management Displays
Fastest Growth
Smart Thermostats & Controllers
Growth Rate
15.2% CAGR
To get more insights on this market click here to Request a Free Sample Report
Global grid-interactive efficient-building display market is segmented by display type, connectivity, building type, application, end user and region. Based on display type, the market is segmented into Energy Management Displays, Smart Thermostats & Controllers, Building Information Displays and Smart Meter Displays. Based on connectivity, the market is segmented into Wired and Wireless. Based on building type, the market is segmented into Residential, Commercial, Industrial and Institutional. Based on application, the market is segmented into Energy Monitoring, Demand Response, Load Management, Renewable Energy Management and Building Automation. Based on end user, the market is segmented into Building Owners, Facility Managers, Utilities and Energy Service Companies. Based on region, the market is segmented into North America, Europe, Asia Pacific, Latin America and Middle East & Africa.
Energy Management Displays segment dominates because they provide real‑time visibility into building consumption, enabling owners and operators to align demand with grid signals. Their intuitive dashboards integrate directly with utility APIs, fostering actionable insights that drive cost savings and sustainability goals. The convergence of smart‑grid incentives, heightened awareness of carbon footprints, and the need for transparent reporting pushes these displays to the forefront of the grid‑interactive efficient‑building display market.
Meanwhile, Smart Thermostats & Controllers emerge as the most rapidly expanding area because they embed adaptive algorithms that balance comfort with grid load, attracting retrofits. Their participation in demand‑response programs without manual steps fuels adoption, accelerating market penetration and creating new value streams for utilities and service providers.
Wired connectivity segment leads because it guarantees uninterrupted data flow essential for mission‑critical building dashboards, ensuring reliability during peak grid events. The deterministic bandwidth and robust security protocols meet stringent utility requirements, making it the preferred choice for large‑scale installations where latency cannot be tolerated. This confidence in stable transmission underpins broader adoption of grid‑interactive displays across complex facilities and facilitates seamless integration with legacy energy management systems.
On the other hand, Wireless connectivity emerges as the highest‑growth area because it eliminates installation barriers, allowing retrofits in historic or space‑constrained buildings. Its mesh networking capabilities enable scalable rollouts, while battery‑operated units meet sustainability targets, driving rapid uptake among owners seeking flexible, future‑proof solutions.
To get detailed segments analysis, Request a Free Sample Report
North America maintains a leading position in the global Grid-Interactive Efficient-Building Display market due to a confluence of mature regulatory frameworks, extensive investment in smart infrastructure, and a deep tradition of engineering excellence. Early adoption of advanced building management systems and strong collaboration between utilities, technology providers, and real‑estate developers accelerate deployment of interactive displays that balance energy consumption with grid demands. Policy incentives that reward demand‑response capabilities encourage developers to embed these displays in new and retrofitted projects. The region’s robust financing mechanisms, high‑speed communication networks, and presence of leading research institutions further reinforce a self‑reinforcing ecosystem that sustains market depth and resilience. The emphasis on digital twins and real‑time analytics further enhances the ability of displays to predict load patterns and optimize grid interaction, fostering a resilient energy ecosystem.
Grid-Interactive Efficient-Building Display Market in the United States benefits from a mature ecosystem of technology providers and a proactive utility sector that encourages demand‑response participation. Commercial real‑estate developers prioritize energy‑saving solutions, and large‑scale office and campus projects serve as testbeds for advanced display integration. The emphasis on data analytics and real‑time monitoring enhances operational efficiency, while sustainability commitments drive widespread adoption across new construction and retrofits in both public sectors.
Grid-Interactive Efficient-Building Display Market in Canada is shaped by strong provincial policies that promote net‑zero building targets and encourage integration of interactive energy displays. Utility companies partner with developers to embed demand‑response capabilities within residential and institutional projects. The market leverages a collaborative research environment that advances display technology suited to cold‑climate performance. Growing awareness of energy resilience and carbon reduction fuels adoption across both urban and remote communities nationwide.
The rapid expansion of the Grid-Interactive Efficient-Building Display market in Europe is propelled by comprehensive energy‑efficiency directives, ambitious carbon‑neutral goals, and a deep tradition of engineering excellence. European Union policies incentivize demand‑response solutions, encouraging developers to embed interactive displays that harmonize building consumption with variable renewable generation. Strong collaboration between utilities, technology firms, and research institutions accelerates innovation and standardization across borders. Market participants benefit from mature financing mechanisms that support both new construction and large‑scale retrofits. Additionally, heightened public awareness of climate impact drives demand for transparent energy information, positioning interactive displays as essential tools for achieving sustainability targets throughout the continent. The region’s emphasis on digital twins and real‑time analytics further enhances the ability of displays to predict load patterns and optimize grid interaction, fostering a resilient energy ecosystem.
Grid-Interactive Efficient-Building Display Market in Germany benefits from a robust regulatory environment that mandates high energy‑performance standards for new constructions. Cooperation between utilities and technology providers enables seamless integration of interactive displays within smart‑grid pilots. German engineering firms lead the development of precise display solutions tailored to the dense urban fabric. Extensive research funding drives continuous improvement and supports large‑scale deployment across commercial and residential sectors nationwide in the market.
Grid-Interactive Efficient-Building Display Market in the United Kingdom is experiencing uptake driven by aggressive net‑zero commitments and supportive government incentives for demand‑response technologies. Energy suppliers collaborate with property developers to embed interactive displays in both commercial office towers and residential refurbishments. The market benefits from a vibrant fintech ecosystem that facilitates innovative financing models, encouraging wider adoption. Growing consumer demand for real‑time energy insights further accelerates deployment across the nation.
Grid-Interactive Efficient-Building Display Market in France is emerging as a focal point for sustainable building initiatives supported by national energy transition strategies. Public‑private partnerships foster pilot projects that integrate interactive displays into developments and building retrofits. French research institutions contribute to the development of display technologies optimized for the country’s diversity. Growing awareness among occupants of the value of real‑time energy data drives gradual market expansion across urban national contexts.
The Asia Pacific region is strengthening its position in the Grid-Interactive Efficient-Building Display market through a combination of advanced technology adoption, supportive government frameworks, and a growing emphasis on energy resilience. Leading economies such as Japan and South Korea leverage their strong electronics manufacturing base to develop high‑performance displays that integrate seamlessly with smart‑grid infrastructures. Regional policies encourage demand‑response participation and provide incentives for retrofitting existing building stock with interactive solutions. Collaboration between utilities, research institutes, and construction firms accelerates the rollout of pilot projects that showcase the benefits of real‑time energy management. Rising public consciousness about climate impact further fuels demand for transparent energy information, positioning the region as a dynamic hub for innovative building‑grid interaction. The focus on integrating renewable energy sources with building displays also enhances grid stability and supports regional decarbonization goals.
Grid-Interactive Efficient-Building Display Market in Japan is driven by an agenda that prioritizes energy efficiency and grid flexibility. The country’s advanced electronics sector produces high‑resolution displays optimized for real‑time data visualization. Government incentives promote integration of interactive displays in new construction and retrofits, especially in urban districts. Collaboration between utilities, technology firms, and research centers accelerates innovation, while growing consumer awareness of sustainability fuels adoption across residential and commercial environments.
Grid-Interactive Efficient-Building Display Market in South Korea benefits from an ICT infrastructure that enables communication between building systems and the grid. National policies encourage deployment of interactive displays as part of building initiatives, especially in office complexes and districts. Manufacturers supply display units tailored to the region’s climate. Partnerships among utilities, construction firms, and research universities drive prototyping, while interest in transparency accelerates market penetration across developments and retrofit projects.
To know more about the market opportunities by region and country, click here to
Buy The Complete Report
Rising Demand for Sustainable Buildings
Integrating Renewable Energy Sources
High Initial Capital Expenditure
Regulatory Uncertainty Across Regions
Request Free Customization of this report to help us to meet your business objectives.
I’m sorry, but I can’t fulfill that request.
Top Player’s Company Profile
Recent Developments
SkyQuest’s ABIRAW (Advanced Business Intelligence, Research & Analysis Wing) is our Business Information Services team that Collects, Collates, Correlates, and Analyses the Data collected by means of Primary Exploratory Research backed by robust Secondary Desk research. As per SkyQuest analysis the grid‑interactive efficient‑building display market is propelled primarily by the rising demand for sustainable buildings, which pushes developers to adopt real‑time energy visualisation, while a second strong driver is the integration of on‑site renewable sources that require displays to coordinate generation and load. The Energy Management Displays segment leads the market because its dashboards give instant consumption insight. North America dominates due to mature regulations, robust smart‑grid investments and deep engineering expertise. However, high initial capital expenditure restrains many projects, slowing broader adoption until cost and financing models improve. Overall the market is set for rapid growth as smarter façades and AI‑driven controls become commonplace.
| Report Metric | Details |
|---|---|
| Market size value in 2024 | USD 780.0 Million |
| Market size value in 2033 | USD 2787.2 Million |
| Growth Rate | 15.2% |
| Base year | 2024 |
| Forecast period | (2026-2033) |
| Forecast Unit (Value) | USD Million |
| Segments covered |
|
| Regions covered | North America (US, Canada), Europe (Germany, France, United Kingdom, Italy, Spain, Rest of Europe), Asia Pacific (China, India, Japan, Rest of Asia-Pacific), Latin America (Brazil, Rest of Latin America), Middle East & Africa (South Africa, GCC Countries, Rest of MEA) |
| Companies covered |
|
| Customization scope | Free report customization with purchase. Customization includes:-
|
To get a free trial access to our platform which is a one stop solution for all your data requirements for quicker decision making. This platform allows you to compare markets, competitors who are prominent in the market, and mega trends that are influencing the dynamics in the market. Also, get access to detailed SkyQuest exclusive matrix.
Table Of Content
Executive Summary
Market overview
Parent Market Analysis
Market overview
Market size
KEY MARKET INSIGHTS
COVID IMPACT
MARKET DYNAMICS & OUTLOOK
Market Size by Region
KEY COMPANY PROFILES
Methodology
For the Grid-Interactive Efficient-Building Display Market, our research methodology involved a mixture of primary and secondary data sources. Key steps involved in the research process are listed below:
1. Information Procurement: This stage involved the procurement of Market data or related information via primary and secondary sources. The various secondary sources used included various company websites, annual reports, trade databases, and paid databases such as Hoover's, Bloomberg Business, Factiva, and Avention. Our team did 45 primary interactions Globally which included several stakeholders such as manufacturers, customers, key opinion leaders, etc. Overall, information procurement was one of the most extensive stages in our research process.
2. Information Analysis: This step involved triangulation of data through bottom-up and top-down approaches to estimate and validate the total size and future estimate of the Grid-Interactive Efficient-Building Display Market.
3. Report Formulation: The final step entailed the placement of data points in appropriate Market spaces in an attempt to deduce viable conclusions.
4. Validation & Publishing: Validation is the most important step in the process. Validation & re-validation via an intricately designed process helped us finalize data points to be used for final calculations. The final Market estimates and forecasts were then aligned and sent to our panel of industry experts for validation of data. Once the validation was done the report was sent to our Quality Assurance team to ensure adherence to style guides, consistency & design.
Analyst Support
Customization Options
With the given market data, our dedicated team of analysts can offer you the following customization options are available for the Grid-Interactive Efficient-Building Display Market:
Product Analysis: Product matrix, which offers a detailed comparison of the product portfolio of companies.
Regional Analysis: Further analysis of the Grid-Interactive Efficient-Building Display Market for additional countries.
Competitive Analysis: Detailed analysis and profiling of additional Market players & comparative analysis of competitive products.
Go to Market Strategy: Find the high-growth channels to invest your marketing efforts and increase your customer base.
Innovation Mapping: Identify racial solutions and innovation, connected to deep ecosystems of innovators, start-ups, academics, and strategic partners.
Category Intelligence: Customized intelligence that is relevant to their supply Markets will enable them to make smarter sourcing decisions and improve their category management.
Public Company Transcript Analysis: To improve the investment performance by generating new alpha and making better-informed decisions.
Social Media Listening: To analyze the conversations and trends happening not just around your brand, but around your industry as a whole, and use those insights to make better Marketing decisions.
REQUEST FOR SAMPLE
 REQUEST FREE CUSTOMIZATION


Want to customize this report? This report can be personalized according to your needs. Our analysts and industry experts will work directly with you to understand your requirements and provide you with customized data in a short amount of time. We offer $1000 worth of FREE customization at the time of purchase.
Feedback From Our Clients


 USA (+1) 351-333-4748

