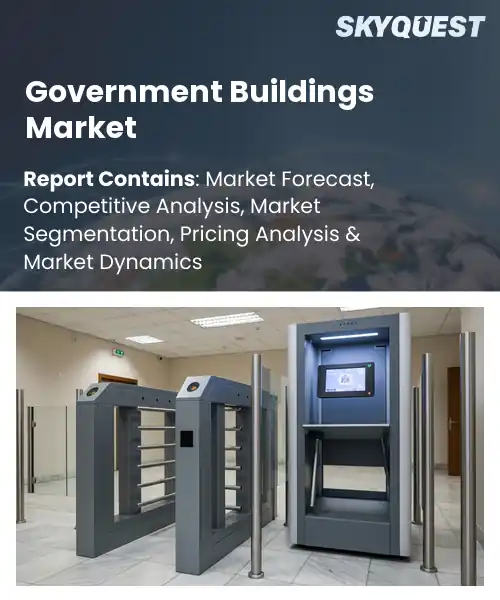
Government Buildings Market
Report ID: SQMIG60K2008
Report ID: SQMIG60K2008
[email protected]
USA +1 351-333-4748
Report ID:
SQMIG60K2008 |
Region:
Global |
Published Date: July, 2026
Pages:
157
|Tables:
144
|Figures:
78


Global Government Buildings Market size was valued at USD 8.96 Trillion in 2024 and is poised to grow from USD 9.42 Trillion in 2025 to USD 14.02 Trillion by 2033, growing at a CAGR of 5.1% during the forecast period (2026-2033).
The global government buildings market comprises the planning, design, construction, and maintenance of facilities such as courthouses, legislative halls, and municipal offices. Its primary driver is public sector investment, which rises when governments allocate budgets for infrastructure modernization and disaster resilience. Over the past two decades, many nations have replaced aging structures with energy‑efficient complexes, exemplified by the U.K.'s refurbishment of the Parliament Estate and Singapore's Smart Nation‑aligned municipal hubs. This shift matters because upgraded facilities enhance service delivery, reduce operating costs, and signal fiscal commitment to citizens. As fiscal cycles repeat, the market expands in tandem with policy agendas.
The second factor shaping the market is the transition toward architecture, which generates demand for retrofits and openings for technology providers. When regulations such as LEED certification or the EU’s Energy Performance of Buildings Directive become compulsory, public agencies must invest in solar façades, smart HVAC systems, and IoT platforms. This regulatory pressure has spurred projects like the Washington D.C. Federal Center’s retrofit and Canada's Whitby City Hall solar retrofit, creating revenue streams for engineering and renewable‑energy firms. Consequently, the convergence of environmental policy and digital transformation drives capital allocation, expanding the market’s scope beyond construction into long‑term facility‑management services.
How is AI-driven Automation Reshaping Energy Efficiency In The Government Buildings Market?
AI driven automation is changing how government facilities manage heating, cooling, lighting and occupancy. Machine learning models analyze sensor data in real time, predict load patterns and adjust controls without human intervention. The technology reduces waste, improves comfort and lowers operating costs. In the public sector many agencies are retrofitting older buildings with smart thermostats, predictive maintenance platforms and cloud based energy dashboards. These tools create a feedback loop that continuously refines performance as usage changes. The shift is supported by growing demand for sustainable operations and tighter budget pressures, making efficiency a strategic priority for municipalities.
Skanska, in February 2026, announced the deployment of an AI powered building management system across office complexes, enabling automated HVAC optimization that cuts waste and advances goals. The platform links occupancy sensors with weather forecasts to fine tune temperature set points, delivering savings and showing how AI automation can scale in the building portfolio.
Market snapshot - (2026-2033)
Global Market Size
USD 8.96 Trillion
Largest Segment
Administrative Buildings
Fastest Growth
Public Safety Buildings
Growth Rate
5.1% CAGR
To get more insights on this market click here to Request a Free Sample Report
Global government buildings market is segmented by building type, construction type, application, ownership level, project type and region. Based on building type, the market is segmented into Administrative Buildings, Legislative Buildings, Judicial Buildings and Public Safety Buildings. Based on construction type, the market is segmented into New Construction and Renovation & Retrofit. Based on application, the market is segmented into Office Administration, Public Services, Security & Defense and Civic Operations. Based on ownership level, the market is segmented into Federal/National, State/Provincial and Local/Municipal. Based on project type, the market is segmented into Publicly Funded and Public-Private Partnership (PPP). Based on region, the market is segmented into North America, Europe, Asia Pacific, Latin America and Middle East & Africa.
Renovation & retrofit segment dominates because governments prioritize extending the lifespan of existing assets while meeting stricter energy efficiency mandates. Legacy structures present measurable cost savings compared with ground‑up builds, and policy incentives encourage retrofitting to reduce carbon footprints. This focus fuels demand for specialized design, modular upgrades, and integrated building management systems, positioning renovation as the primary engine of activity within the government buildings market across public sectors today globally.
Meanwhile, new construction segment emerges as the fastest growing area as governments launch flagship campuses that showcase digital twin technologies and resilient design. Investment in state‑of‑the‑art facilities is propelled by modernization agendas, demand for flexible workspaces, and the need to embed advanced security infrastructure, accelerating overall future market expansion continues.
Federal/National ownership segment dominates because it controls the majority of budgetary resources and sets overarching regulatory frameworks that shape building standards. Central agencies drive large‑scale procurement, enforce uniform sustainability criteria, and fund long‑term asset strategies, creating consistent demand for high‑performance infrastructure across the government buildings market. These entities also coordinate inter‑agency collaborations, leverage economies of scale, and prioritize security enhancements, which reinforces their central role and sustains continuous project pipelines throughout fiscal cycles.
Conversely, local/municipal ownership segment is witnessing the strongest growth momentum as cities prioritize community‑centric facilities and rapid response spaces. Grass‑roots funding mechanisms, smart‑city initiatives, and decentralized decision‑making accelerate investments in adaptable civic hubs, fostering innovative design approaches that expand the market and generate new opportunities for localized service delivery in future.
To get detailed segments analysis, Request a Free Sample Report
North America leads the global Government Buildings market due to a confluence of mature procurement mechanisms, aggressive sustainability agendas, and deep technological integration. Federal and state agencies prioritize energy‑efficient design, leveraging advanced building information modeling and smart‑grid connectivity. A well‑established supply chain supports high‑performance materials and retrofitting services, while robust financing structures reduce risk for public projects. Collaborative research institutions drive continuous innovation in resilient construction and renewable‑energy integration. The region’s regulatory environment enforces rigorous performance benchmarks, encouraging continual upgrades. Moreover, a skilled workforce and strong vendor ecosystem ensure rapid implementation of complex public infrastructure, reinforcing North America’s dominant position. Public‑private partnerships further accelerate deployment, creating scalable solutions that other regions emulate.
Government Buildings Market in the United States reflects a strong emphasis on sustainability and digital transformation. Federal guidelines promote net‑zero targets, driving adoption of smart sensors, automated lighting, and renewable energy sources within public facilities. State incentives complement these efforts, fostering pilot projects that showcase energy‑saving technologies. A broad network of design‑build firms and engineering consultants supports rapid project delivery, while ongoing training programs maintain a qualified workforce capable of meeting evolving regulatory demands.
Government Buildings Market in Canada is characterized by strong federal green building policies and a collaborative provincial approach. Nationwide standards encourage high‑performance envelopes, low‑impact materials, and integrated renewable systems. Public agencies work closely with academic research centers, which provide guidance on climate‑responsive design and lifecycle assessment. The market benefits from a cohesive supply chain that supplies sustainable construction products, and a commitment to Indigenous partnership enhances community‑focused infrastructure projects across the country.
Europe’s rapid expansion is propelled by an unprecedented alignment of policy ambition, financial support, and technological readiness. The European Union’s climate framework establishes stringent energy‑performance targets for public structures, compelling member states to adopt high‑efficiency design standards. Substantial funding mechanisms enable large‑scale retrofits of historic buildings, while cross‑border research collaborations accelerate the diffusion of innovative materials and smart‑system integration. National governments reinforce these efforts through incentive programs that prioritize low‑carbon construction and renewable‑energy incorporation. The region also benefits from a mature supply chain that delivers sustainable building components at scale, and a skilled workforce adept at navigating complex regulatory landscapes. Together, these dynamics position Europe as a leading hub for environmentally responsible government infrastructure. This holistic approach also stimulates private sector involvement, creating a vibrant ecosystem of innovation and sustainable development across the continent.
Government Buildings Market in Germany benefits from stringent energy efficiency legislation and a culture of engineering excellence. National standards push for high‑performance façades, district heating integration, and advanced building automation. Federal funding programs incentivize large‑scale retrofits of historic public structures, while strong collaboration between research institutes and construction firms accelerates the adoption of cutting‑edge renewable technologies. The market is further reinforced by a skilled labor pool and a well‑developed supply chain for sustainable building components.
Government Buildings Market in the United Kingdom is experiencing the fastest growth as ambitious net‑zero commitments reshape public infrastructure. Central and local authorities implement procurement frameworks that prioritize low‑carbon solutions, encouraging modular construction and digital twins for efficient design. Public investment focuses on upgrading aging school and healthcare facilities, while policy incentives stimulate private sector participation in public‑private partnership models. The market leverages a fintech ecosystem to secure innovative financing for green building projects.
Government Buildings Market in France is anchored by comprehensive environmental regulations and a longstanding emphasis on public sector modernization. National energy transition laws drive integration of passive design, photovoltaic installations, and smart building management across municipal facilities. Collaborative platforms connect government bodies with leading architectural firms, fostering solutions that balance heritage preservation with contemporary performance. A national research network contributes to low‑embodied‑carbon material development, reinforcing France’s position as a dominant player in the European landscape.
Asia Pacific is strengthening its position through a synergistic blend of modernization initiatives, strategic public investment, and rapid adoption of digital building technologies. Governments across the region are prioritizing the renovation of aging public infrastructure, embedding energy‑efficiency measures and resilient design principles. The rise of smart‑city programs fosters the integration of Internet‑of‑Things sensors and AI‑driven energy management within government facilities, delivering measurable reductions in operational costs. Robust policy frameworks encourage the use of low‑carbon materials and renewable‑energy systems, while regional cooperation platforms facilitate knowledge sharing among nations. Coupled with a burgeoning construction talent pool and an agile supply chain, these factors collectively enhance the competitiveness of Asia Pacific in the global Government Buildings arena. These combined efforts not only improve building performance but also position the region as a benchmark for sustainable public architecture worldwide.
Government Buildings Market in Japan is advancing through a strategic focus on resilience, energy efficiency, and aging infrastructure renewal. Government initiatives encourage the adoption of advanced insulation, seismic‑responsive designs, and integrated renewable energy systems within public buildings. Collaboration between public agencies and leading technology firms accelerates the deployment of building‑automation platforms that optimize resource consumption. The market also benefits from a strong tradition of craftsmanship and a mature supply chain that provides high‑quality, low‑carbon materials, supporting nationwide efforts to achieve carbon neutrality.
Government Buildings Market in South Korea is characterized by rapid digitalization and aggressive sustainability targets set by national policy. Public projects increasingly adopt smart building technologies, including IoT‑based monitoring and AI‑driven energy management, to enhance operational efficiency. Government incentives promote the retrofitting of existing facilities with high‑performance glazing and efficient HVAC systems. A dynamic construction sector, supported by strong engineering education and research collaborations, delivers innovative solutions that position South Korea as a growing influence within the regional Government Buildings landscape.
To know more about the market opportunities by region and country, click here to
Buy The Complete Report
Increasing Public Infrastructure Investment
Adoption Of Sustainable Building Practices
Stringent Budgetary Constraints
Complex Regulatory Approval Processes
Request Free Customization of this report to help us to meet your business objectives.
Intense rivalry among GovTech firms and construction‑tech innovators drives the Global Government Buildings market, where securing municipal contracts and modernizing legacy facilities are key catalysts. Leaders such as Contech’s acquisition of a smart‑sensor startup and a joint venture between a facilities‑management platform and a major utilities provider illustrate how M&A, strategic partnerships and AI‑based building analytics are reshaping procurement and operational efficiency.
SkyQuest’s ABIRAW (Advanced Business Intelligence, Research & Analysis Wing) is our Business Information Services team that Collects, Collates, Correlates, and Analyses the Data collected by means of Primary Exploratory Research backed by robust Secondary Desk research.
As per SkyQuest analysis, the global government buildings market is propelled primarily by rising public infrastructure investment, which fuels steady demand for new civic facilities and upgrades. A second important driver is the growing adoption of sustainable building practices and AI‑driven automation that improve energy efficiency and lower operating costs. The renovation and retrofit segment leads the market because governments prefer extending the life of existing assets while meeting stricter energy mandates. North America dominates the arena due to mature procurement systems, strong sustainability agendas, and advanced technology integration. However, stringent budgetary constraints can curb project launches, creating a notable restraint on overall growth.
| Report Metric | Details |
|---|---|
| Market size value in 2024 | USD 8.96 Trillion |
| Market size value in 2033 | USD 14.02 Trillion |
| Growth Rate | 5.1% |
| Base year | 2024 |
| Forecast period | (2026-2033) |
| Forecast Unit (Value) | USD Trillion |
| Segments covered |
|
| Regions covered | North America (US, Canada), Europe (Germany, France, United Kingdom, Italy, Spain, Rest of Europe), Asia Pacific (China, India, Japan, Rest of Asia-Pacific), Latin America (Brazil, Rest of Latin America), Middle East & Africa (South Africa, GCC Countries, Rest of MEA) |
| Companies covered |
|
| Customization scope | Free report customization with purchase. Customization includes:-
|
To get a free trial access to our platform which is a one stop solution for all your data requirements for quicker decision making. This platform allows you to compare markets, competitors who are prominent in the market, and mega trends that are influencing the dynamics in the market. Also, get access to detailed SkyQuest exclusive matrix.
Table Of Content
Executive Summary
Market overview
Parent Market Analysis
Market overview
Market size
KEY MARKET INSIGHTS
COVID IMPACT
MARKET DYNAMICS & OUTLOOK
Market Size by Region
KEY COMPANY PROFILES
Methodology
For the Government Buildings Market, our research methodology involved a mixture of primary and secondary data sources. Key steps involved in the research process are listed below:
1. Information Procurement: This stage involved the procurement of Market data or related information via primary and secondary sources. The various secondary sources used included various company websites, annual reports, trade databases, and paid databases such as Hoover's, Bloomberg Business, Factiva, and Avention. Our team did 45 primary interactions Globally which included several stakeholders such as manufacturers, customers, key opinion leaders, etc. Overall, information procurement was one of the most extensive stages in our research process.
2. Information Analysis: This step involved triangulation of data through bottom-up and top-down approaches to estimate and validate the total size and future estimate of the Government Buildings Market.
3. Report Formulation: The final step entailed the placement of data points in appropriate Market spaces in an attempt to deduce viable conclusions.
4. Validation & Publishing: Validation is the most important step in the process. Validation & re-validation via an intricately designed process helped us finalize data points to be used for final calculations. The final Market estimates and forecasts were then aligned and sent to our panel of industry experts for validation of data. Once the validation was done the report was sent to our Quality Assurance team to ensure adherence to style guides, consistency & design.
Analyst Support
Customization Options
With the given market data, our dedicated team of analysts can offer you the following customization options are available for the Government Buildings Market:
Product Analysis: Product matrix, which offers a detailed comparison of the product portfolio of companies.
Regional Analysis: Further analysis of the Government Buildings Market for additional countries.
Competitive Analysis: Detailed analysis and profiling of additional Market players & comparative analysis of competitive products.
Go to Market Strategy: Find the high-growth channels to invest your marketing efforts and increase your customer base.
Innovation Mapping: Identify racial solutions and innovation, connected to deep ecosystems of innovators, start-ups, academics, and strategic partners.
Category Intelligence: Customized intelligence that is relevant to their supply Markets will enable them to make smarter sourcing decisions and improve their category management.
Public Company Transcript Analysis: To improve the investment performance by generating new alpha and making better-informed decisions.
Social Media Listening: To analyze the conversations and trends happening not just around your brand, but around your industry as a whole, and use those insights to make better Marketing decisions.
REQUEST FOR SAMPLE
 REQUEST FREE CUSTOMIZATION
Global Government Buildings Market size was valued at USD 8.96 Trillion in 2024 and is poised to grow from USD 9.42 Trillion in 2025 to USD 14.02 Trillion by 2033, growing at a CAGR of 5.1% during the forecast period (2026-2033).
Intense rivalry among GovTech firms and construction‑tech innovators drives the Global Government Buildings market, where securing municipal contracts and modernizing legacy facilities are key catalysts. Leaders such as Contech’s acquisition of a smart‑sensor startup and a joint venture between a facilities‑management platform and a major utilities provider illustrate how M&A, strategic partnerships and AI‑based building analytics are reshaping procurement and operational efficiency. 'Turner Construction Company', 'Bechtel Corporation', 'AECOM', 'Jacobs Solutions Inc.', 'Fluor Corporation', 'Skanska AB', 'VINCI S.A.', 'Bouygues S.A.', 'Hochtief AG', 'Balfour Beatty plc', 'Kiewit Corporation', 'Gilbane Building Company', 'Clark Construction Group, LLC', 'Mortenson Company', 'Suffolk Construction Company, Inc.', 'McCarthy Building Companies, Inc.', 'Larsen & Toubro Limited', 'Shapoorji Pallonji & Company Private Limited', 'China State Construction Engineering Corporation Limited', 'Power Construction Corporation of China'
Governments worldwide are allocating larger portions of fiscal budgets to construct new civic facilities, modernize existing structures, and expand service capacity. This heightened spending creates steady demand for design, engineering, and construction services tailored to government specifications. As public agencies prioritize resilient and technologically advanced buildings, vendors experience robust order pipelines that support revenue growth. The consistent flow of projects also encourages long‑term partnerships, fostering market stability and motivating firms to invest in specialized capabilities that further accelerate sector expansion.
Smart Renovation Drives Efficiency: Governments are increasingly adopting integrated digital platforms to modernize legacy facilities, leveraging IoT sensors, advanced building management systems, and cloud analytics. This shift enables real‑time monitoring of energy use, occupant comfort, and maintenance needs, fostering proactive decision‑making and reducing operational disruptions. As public agencies prioritize sustainability and cost‑effectiveness, smart renovation initiatives align technology with policy objectives, creating agile infrastructure that can adapt to evolving service demands while improving transparency and stakeholder confidence, and fostering long‑term public value through collaborative governance frameworks.
Why does North America Dominate the Global Government Buildings Market? |@12


Want to customize this report? This report can be personalized according to your needs. Our analysts and industry experts will work directly with you to understand your requirements and provide you with customized data in a short amount of time. We offer $1000 worth of FREE customization at the time of purchase.
Feedback From Our Clients


 USA (+1) 351-333-4748

