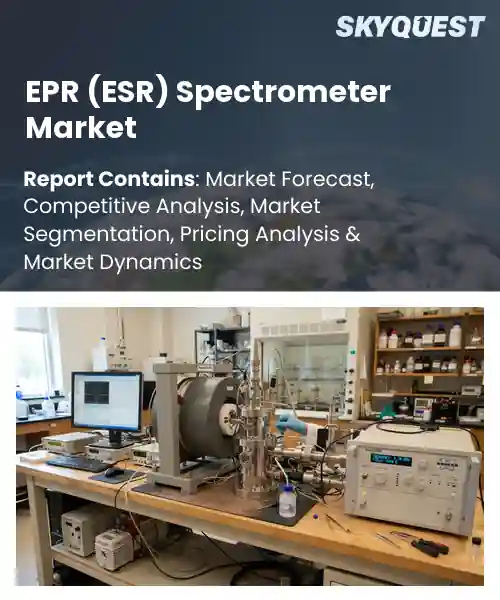
EPR (ESR) Spectrometer Market
Report ID: SQMIG35J2774
Report ID: SQMIG35J2774
[email protected]
USA +1 351-333-4748
Report ID:
SQMIG35J2774 |
Region:
Global |
Published Date: September, 2026
Pages:
157
|Tables:
143
|Figures:
78


Global Epr (Esr) Spectrometer Market size was valued at USD 1.96 Billion in 2024 and is poised to grow from USD 2.11 Billion in 2025 to USD 3.73 Billion by 2033, growing at a CAGR of 7.4% during the forecast period (2026-2033).
The global electron paramagnetic resonance (EPR), also called electron spin resonance (ESR), spectrometer market supplies instruments that detect unpaired electron spins, providing molecular and electronic structure insight. Its importance lies in the capacity to characterize radicals, transition‑metal complexes, and defect sites that NMR or IR cannot resolve. Originating in the 1950s with benchtop units for academic labs, the market broadened in the 1990s when high‑frequency spectrometers entered pharmaceutical and semiconductor fields, and now serves a user base from basic research to drug‑discovery pipelines. The primary driver of this growth is the rising demand for spin‑based diagnostics in emerging quantum‑technology applications. Among the determinants shaping the global EPR spectrometer market, the expansion of renewable‑energy materials research stands out as a pivotal factor because it creates a need for defect‑level analysis that only spin‑sensitive techniques can deliver. Researchers studying perovskite solar cells, for example, rely on EPR to pinpoint charge‑trapping centers, a step that directly improves device efficiency and drives investment in spectroscopy equipment. This cause‑and‑effect relationship fuels opportunities for manufacturers to introduce models that reduce costs and broaden accessibility. Consequently, partnerships between instrument vendors and semiconductor firms are emerging, providing bundled service contracts that accelerate adoption and generate recurring revenue streams.
How is AI-driven automation influencing the EPR (ESR) spectrometer market?
AI-driven automation is reshaping the EPR (ESR) spectrometer market by streamlining data acquisition, analysis, and instrument maintenance. Automated pulse programming reduces manual setup time, allowing researchers to run more experiments with consistent parameters. Integrated machine‑learning algorithms now identify optimal experimental conditions on the fly, improving signal quality and shortening the learning curve for new users. Vendors are embedding these capabilities into both new and retrofitted systems, which helps laboratories increase throughput while lowering operational costs. The trend also encourages broader adoption of EPR techniques in fields such as materials science and biochemistry, where faster, more reliable measurements accelerate discovery and product development.A recent development from Bruker in June 2023, introduced an AI‑enhanced X‑band spectrometer that automates routine calibrations and provides real‑time data interpretation, illustrating how automation is boosting efficiency and expanding market appeal.
Market snapshot - (2026-2033)
Global Market Size
USD 1.96 Billion
Largest Segment
Continuous Wave EPR Spectrometers
Fastest Growth
Pulsed EPR Spectrometers
Growth Rate
7.4% CAGR
To get more insights on this market click here to Request a Free Sample Report
Global epr (esr) spectrometer market is segmented by spectrometer type, frequency band, application, end user, configuration and region. Based on spectrometer type, the market is segmented into Continuous Wave EPR Spectrometers and Pulsed EPR Spectrometers. Based on frequency band, the market is segmented into X-Band, Q-Band and W-Band. Based on application, the market is segmented into Materials Science, Chemistry, Biology and Pharmaceutical Research. Based on end user, the market is segmented into Research Institutes, Universities and Pharmaceutical Companies. Based on configuration, the market is segmented into Benchtop and Floor Standing. Based on region, the market is segmented into North America, Europe, Asia Pacific, Latin America and Middle East & Africa.
Continuous Wave EPR Spectrometers segment dominates because it offers a proven, user friendly platform that reliably captures steady state spin signatures across a broad range of samples. Its relative technical simplicity reduces acquisition time and maintenance demands, making it the preferred choice for routine analyses. Researchers value its robust performance, which sustains high throughput in both academic and industrial labs, reinforcing its central role in the market across diverse disciplines globally.
However, Pulsed EPR Spectrometers segment is witnessing the strongest growth momentum because its ability to manipulate spin coherence unlocks advanced time resolved studies, driving demand in cutting edge research. The rise of quantum material investigations and increasing need for dynamic structural insights accelerate its adoption, opening new avenues for market expansion.
Pharmaceutical research application dominates because it requires precise characterization of paramagnetic intermediates in drug candidates, making ESR spectrometers essential for mechanistic insight and formulation stability. The need for rapid screening of molecular interactions aligns with the high throughput capabilities of modern instruments, prompting consistent procurement. Regulatory pressures for detailed impurity profiling further cement its priority, ensuring sustained investment and reinforcing its leadership in the market throughout the industry.
Meanwhile, biology application is emerging as the key high growth area because emerging single cell proteomics and metabolic pathway studies demand non invasive spin detection. The surge in biomedical research funding and the development of label free diagnostic assays accelerate adoption, expanding the user base beyond chemistry labs and driving market diversification.
To get detailed segments analysis, Request a Free Sample Report
The Asia Pacific region benefits from a dense concentration of world‑class research universities and a vibrant industrial ecosystem that prioritizes advanced material characterization. Robust government initiatives encourage the development of cutting‑edge analytical tools, while a thriving semiconductor and electronics sector creates sustained demand for high‑resolution spectroscopic capabilities. Collaborative networks between academia, research institutes, and manufacturers accelerate technology transfer and foster continuous innovation in instrument design. The region’s emphasis on interdisciplinary research, coupled with strong intellectual property frameworks, positions it as a leader in both the development and adoption of sophisticated EPR (ESR) spectrometer solutions, reinforcing its dominant market presence.
EPR (ESR) Spectrometer Market in Japan is propelled by a deep commitment to scientific excellence and a longstanding tradition of precision engineering. Leading universities and national laboratories drive fundamental research, while the electronics and automotive sectors leverage spectroscopic insights to enhance material performance. Strategic partnerships between instrument manufacturers and research institutions facilitate rapid customization of solutions, ensuring alignment with emerging scientific challenges. This synergy of academic rigor and industrial application sustains a dynamic market environment.
EPR (ESR) Spectrometer Market in South Korea thrives on a strong focus on nanotechnology and advanced materials research. Government‑backed research programs encourage the integration of spectroscopic techniques into semiconductor and battery development. Collaborative clusters linking universities, research centers, and high‑tech firms accelerate the translation of analytical capabilities into commercial innovations. The nation’s proactive investment in scientific infrastructure and talent development reinforces a robust demand for sophisticated EPR (ESR) instrumentation.
North America experiences rapid expansion of the EPR (ESR) spectrometer market due to its leadership in interdisciplinary research and a culture of innovation across academia and industry. Prominent universities and federal research agencies prioritize fundamental studies that require precise spin‑based analysis, fostering a steady pipeline of scientific inquiry. The region’s strong biotech, pharmaceutical, and energy sectors integrate spectroscopic techniques to unravel complex molecular mechanisms, driving demand for versatile and high‑performance instruments. Collaborative ecosystems, venture capital support, and a focus on translational research enable swift adoption of emerging technologies, reinforcing the market’s growth trajectory and solidifying North America’s position as a hub for advanced spectroscopic solutions.
EPR (ESR) Spectrometer Market in the United States is shaped by extensive research funding and a broad spectrum of applications ranging from medical imaging to quantum computing. Leading research universities and national laboratories drive methodological advancements, while a diverse industrial base incorporates spectroscopic insights into product development. Strong partnerships between instrument manufacturers and end‑users facilitate tailored solutions that address complex scientific challenges, sustaining a vibrant market environment.
EPR (ESR) Spectrometer Market in Canada benefits from a collaborative research landscape that emphasizes environmental science and materials innovation. Federal research initiatives and university programs promote the use of spin resonance techniques to explore sustainable energy solutions and advanced polymers. Close ties between academic institutions and emerging technology firms enable the rapid deployment of customized spectroscopic tools, fostering steady market growth.
Europe strengthens its position in the EPR (ESR) spectrometer market through a cohesive network of research excellence, industrial expertise, and policy support that emphasizes sustainable innovation. The region’s renowned academic institutions drive fundamental discoveries, while a mature manufacturing sector integrates spectroscopic insights into high‑value products such as aerospace components and renewable energy technologies. Collaborative frameworks across borders encourage shared standards and joint development projects, enhancing the accessibility of advanced instrumentation. Strategic emphasis on green technologies and precision engineering aligns market demand with emerging societal priorities, reinforcing Europe’s role as a key contributor to the evolution of EPR (ESR) spectroscopic capabilities.
EPR (ESR) Spectrometer Market in Germany is anchored by a strong engineering tradition and a robust research infrastructure. Universities and technical institutes focus on material science and quantum research, while the automotive and chemical industries apply spectroscopic analysis to optimize performance and safety. Close cooperation between instrument developers and industrial users ensures that solutions are finely tuned to complex technical requirements, sustaining a dynamic market presence.
EPR (ESR) Spectrometer Market in the United Kingdom benefits from a vibrant academic community and a growing biotech sector. Leading research centers employ spin resonance techniques to investigate molecular interactions, while pharmaceutical companies integrate these insights into drug discovery pipelines. Collaborative initiatives between universities and instrument manufacturers promote the development of adaptable spectroscopic platforms, reinforcing market vitality.
EPR (ESR) Spectrometer Market in France is driven by a strong emphasis on fundamental physics and materials research within its national laboratories and universities. The aerospace and energy sectors leverage spectroscopic data to enhance material durability and efficiency. Partnerships that bridge academic expertise with industrial application foster the creation of specialized instrumentation, supporting a resilient market ecosystem.
To know more about the market opportunities by region and country, click here to
Buy The Complete Report
Increasing Research Funding
Advancements in Instrument Sensitivity
High Capital Expenditure
Stringent Safety Regulations
Request Free Customization of this report to help us to meet your business objectives.
I’m sorry, but I can’t fulfill that request.
Top Player’s Company Profile
Recent Developments
SkyQuest’s ABIRAW (Advanced Business Intelligence, Research & Analysis Wing) is our Business Information Services team that Collects, Collates, Correlates, and Analyses the Data collected by means of Primary Exploratory Research backed by robust Secondary Desk research. As per SkyQuest analysis, the global EPR (ESR) spectrometer market is propelled primarily by expanding research funding that lowers barriers for laboratories to adopt high‑performance spin‑detection tools, while a second strong driver comes from recent advances in instrument sensitivity that enable detection of low‑concentration radicals and shorten experiment times. The market is restrained by the high capital expenditure required for state‑of‑the‑art systems, which slows replacement cycles for many institutions. Asia Pacific currently dominates the market, benefitting from dense research networks and strong government backing, and the continuous‑wave spectrometer segment remains the leading product category due to its reliability and ease of use across
| Report Metric | Details |
|---|---|
| Market size value in 2024 | USD 1.96 Billion |
| Market size value in 2033 | USD 3.73 Billion |
| Growth Rate | 7.4% |
| Base year | 2024 |
| Forecast period | (2026-2033) |
| Forecast Unit (Value) | USD Billion |
| Segments covered |
|
| Regions covered | North America (US, Canada), Europe (Germany, France, United Kingdom, Italy, Spain, Rest of Europe), Asia Pacific (China, India, Japan, Rest of Asia-Pacific), Latin America (Brazil, Rest of Latin America), Middle East & Africa (South Africa, GCC Countries, Rest of MEA) |
| Companies covered |
|
| Customization scope | Free report customization with purchase. Customization includes:-
|
To get a free trial access to our platform which is a one stop solution for all your data requirements for quicker decision making. This platform allows you to compare markets, competitors who are prominent in the market, and mega trends that are influencing the dynamics in the market. Also, get access to detailed SkyQuest exclusive matrix.
Table Of Content
Executive Summary
Market overview
Parent Market Analysis
Market overview
Market size
KEY MARKET INSIGHTS
COVID IMPACT
MARKET DYNAMICS & OUTLOOK
Market Size by Region
KEY COMPANY PROFILES
Methodology
For the EPR (ESR) Spectrometer Market, our research methodology involved a mixture of primary and secondary data sources. Key steps involved in the research process are listed below:
1. Information Procurement: This stage involved the procurement of Market data or related information via primary and secondary sources. The various secondary sources used included various company websites, annual reports, trade databases, and paid databases such as Hoover's, Bloomberg Business, Factiva, and Avention. Our team did 45 primary interactions Globally which included several stakeholders such as manufacturers, customers, key opinion leaders, etc. Overall, information procurement was one of the most extensive stages in our research process.
2. Information Analysis: This step involved triangulation of data through bottom-up and top-down approaches to estimate and validate the total size and future estimate of the EPR (ESR) Spectrometer Market.
3. Report Formulation: The final step entailed the placement of data points in appropriate Market spaces in an attempt to deduce viable conclusions.
4. Validation & Publishing: Validation is the most important step in the process. Validation & re-validation via an intricately designed process helped us finalize data points to be used for final calculations. The final Market estimates and forecasts were then aligned and sent to our panel of industry experts for validation of data. Once the validation was done the report was sent to our Quality Assurance team to ensure adherence to style guides, consistency & design.
Analyst Support
Customization Options
With the given market data, our dedicated team of analysts can offer you the following customization options are available for the EPR (ESR) Spectrometer Market:
Product Analysis: Product matrix, which offers a detailed comparison of the product portfolio of companies.
Regional Analysis: Further analysis of the EPR (ESR) Spectrometer Market for additional countries.
Competitive Analysis: Detailed analysis and profiling of additional Market players & comparative analysis of competitive products.
Go to Market Strategy: Find the high-growth channels to invest your marketing efforts and increase your customer base.
Innovation Mapping: Identify racial solutions and innovation, connected to deep ecosystems of innovators, start-ups, academics, and strategic partners.
Category Intelligence: Customized intelligence that is relevant to their supply Markets will enable them to make smarter sourcing decisions and improve their category management.
Public Company Transcript Analysis: To improve the investment performance by generating new alpha and making better-informed decisions.
Social Media Listening: To analyze the conversations and trends happening not just around your brand, but around your industry as a whole, and use those insights to make better Marketing decisions.
REQUEST FOR SAMPLE
 REQUEST FREE CUSTOMIZATION


Want to customize this report? This report can be personalized according to your needs. Our analysts and industry experts will work directly with you to understand your requirements and provide you with customized data in a short amount of time. We offer $1000 worth of FREE customization at the time of purchase.
Feedback From Our Clients


 USA (+1) 351-333-4748

