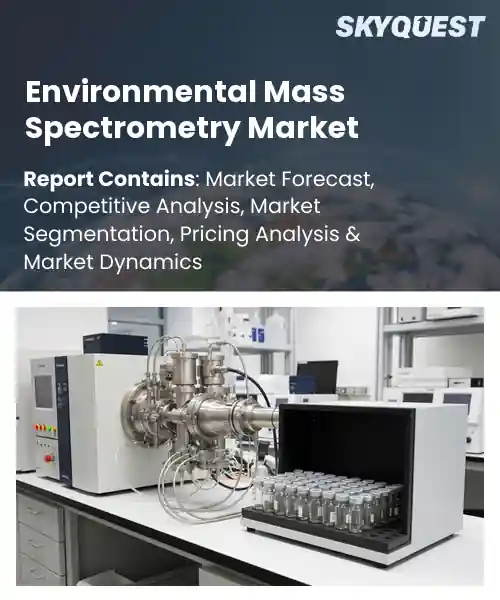
Environmental Mass Spectrometry Market
Report ID: SQMIG45J2658
Report ID: SQMIG45J2658
[email protected]
USA +1 351-333-4748
Report ID:
SQMIG45J2658 |
Region:
Global |
Published Date: July, 2026
Pages:
157
|Tables:
91
|Figures:
76


Global Environmental Mass Spectrometry Market size was valued at USD 2.84 Billion in 2024 and is poised to grow from USD 3.06 Billion in 2025 to USD 5.49 Billion by 2033, growing at a CAGR of 7.6% during the forecast period (2026-2033).
The global environmental mass spectrometry market comprises analytical instruments and services used to detect pollutants, trace metals, and organic contaminants in air, water, soil, and waste streams. Its significance stems from the growing regulatory pressure to monitor emissions and the rising public demand for clean ecosystems, which together propel investments in high‑resolution, rapid‑response spectrometers. Historically, the market evolved from bulky, laboratory‑bound gas chromatography‑mass spectrometers of the 1970s to today’s portable, tandem‑MS platforms that can be deployed on‑site for real‑time data acquisition. In the 2010s, the introduction of the use of time-of-flight MS technology to municipal water testing programs has sped up compliance with stricter EPA regulations, showing how the two, while bringing about technological advancement and more stringent regulations, led to growth in the industry.
A decisive factor fueling the market’s expansion is the integration of mass spectrometry with advanced data analytics and sensor networks, which transforms raw spectra into actionable intelligence for environmental managers. This synergy allows for the predictive maintenance of industrial sites by flagging emissions as soon as they are detected thus reducing downtime and penalties. Real‑life implementations, such as the application of ambient ionization MS technology and cloud‑based dashboards in European steel industries, demonstrate that continuous monitoring allows for savings and improved sustainability reporting. Companies in manufacturing thus focus their research and development funding on miniaturized, low power instruments and software for interpretation based on AI which creates space for new entrants and forces existing players to expand their solution offer. The cause‑effect chain regulatory demand drives technology adoption, which in turn unlocks efficiency gains underpins the market’s robust outlook and signals sustained growth across the next decade.
How is Ai-Driven Automation Influencing the Environmental Mass Spectrometry Market?
The impact of automation driven by artificial intelligence (AI) in environmental mass spectrometry results in faster sample preparation, testing and analysis. The innovative applications of machine learning allow for the prediction of ideal ionization characteristics, and automated testing of samples increases throughput results. There are also integrated workflows that form a bridge between sensor information and analysis in the cloud, thereby ensuring real-time monitoring of contaminants and quick responses to new challenges. Laboratories are benefiting from reducing the amount of manual work to be done, having fewer errors, and obtaining more consistent results. In this case, they can afford using high-resolution techniques and research not only in specialized research centers but also elsewhere.
In June 2025, Bruker Corporation introduced the timsMetabo™ platform with AI/ML-ready digital metabolome archives that automate molecular annotation and improve identification of PFAS and other environmental contaminants. By combining advanced ion mobility with machine learning-enabled data analysis, the system accelerates environmental mass spectrometry workflows and enhances confidence in trace pollutant detection.
Market snapshot - (2026-2033)
Global Market Size
USD 2.84 Billion
Largest Segment
Liquid Chromatography Mass Spectrometry
Fastest Growth
Inductively Coupled Plasma Mass Spectrometry
Growth Rate
7.6% CAGR
To get more insights on this market click here to Request a Free Sample Report
Global environmental mass spectrometry market is segmented by instrument inlet interface, target application matrix, testing operator and region. Based on instrument inlet interface, the market is segmented into gas chromatography mass spectrometry, liquid chromatography mass spectrometry and inductively coupled plasma mass spectrometry. Based on target application matrix, the market is segmented into water quality pollutant analysis, air quality volatile compound tracking, soil agriculture contamination screening and industrial solid waste hazard testing. Based on testing operator, the market is segmented into government environmental agencies, independent industrial testing laboratories and academic earth science research centers. Based on region, the market is segmented into North America, Europe, Asia Pacific, Latin America and Middle East & Africa.
Gas chromatography mass spectrometry segment dominates because it provides unparalleled separative power for complex volatile mixtures, allowing precise identification of trace pollutants that are central to environmental monitoring. The high degree of stability and the well-established implementation technology make it the most accepted choice of ordinary regulatory laboratories. An easy transfer of method, a huge library support, and the ability to use well-known procedures contribute to its leadership, leading to the permanent demand in various environmental tests and their widespread application.
However, liquid chromatography mass spectrometry is witnessing the strongest growth momentum as emerging polar and semi polar contaminant classes demand higher sensitivity in aqueous matrices. Innovations in microfluidic columns and high resolution orbitrap detectors are expanding its applicability to emerging contaminants and biomarker tracking. The adoption of such technologies enables more growth of the market and new chances for advanced environmental analytics.
Water quality pollutant analysis segment dominates because it directly tackles the most regulated and public health critical contaminants, such as heavy metals, pesticides, and emerging organic pollutants, which require precise quantification for safe drinking water. The wide range of analytes, strict compliance standards, and need for continuous monitoring result in significant investment in high-performance mass spectrometric methods. This is why laboratories give priority to these capabilities, confirming the industry’s top position in environmental testing.
Meanwhile, air quality volatile compound tracking emerges as the key high growth area as industrial emissions intensify the need for airborne pollutant surveillance. Advancements in mobile inflow systems and mass spectrometers with fast scanning capabilities allow for the detection of minor amounts of vapors directly on-site, increasing the applications for this technology.
To get detailed segments analysis, Request a Free Sample Report
North America maintains a leading position because of its robust research ecosystem, extensive funding for environmental monitoring programs, and a dense network of academic and industrial laboratories. The highly developed region is able to benefit from early adoption of new analytical technologies and successful collaboration of government agencies, higher education units, and producers of equipment. The presence of an established regulatory framework leads to steady requirements in precision instrumentation while the ability of people's expertise to advance methods of research. All these aspects help develop a favorable atmosphere for leadership in technology and allow suppliers from all over the world to reach this area.
United States Environmental Mass Spectrometry Market
Environmental mass spectrometry market in the United States is propelled by a high concentration of federal and state environmental agencies that prioritize rigorous pollutant tracking. The presence of renowned institutions of higher education along with research establishments encourages continual progress in analytical techniques while the active commercial sector pushes forward development of new tools very quickly. The close cooperation between different scientific disciplines boosts stability of the market.
Canada Environmental Mass Spectrometry Market
Environmental mass spectrometry market in Canada is shaped by a strong emphasis on natural resource management and water quality monitoring. Clean technology research is backed by federal measures, paving the way for wider use of these tools. The collaboration established between academic research institutions and companies allows for the easy implementation of innovations discovered via research in practice and strengthens the country’s standing in the local market.
Europe’s expansion is fueled by stringent environmental legislation, substantial public investment in sustainable technologies, and a collaborative research culture across borders. The drive of the continent to reduce emissions and protect the environment creates the high demand for accurate analytical capabilities. The interlinked networks of research groups and industry clusters make it easier to disperse knowledge and speed up the development of purpose-built solutions for complicated environmental issues. Moreover, the commitment to green innovation makes Europe a leader in the development of new mass spectrometry technologies.
Germany Environmental Mass Spectrometry Market
Environmental mass spectrometry market in Germany benefits from a highly organized industrial base and a tradition of engineering excellence. Programs backed by the government that facilitate the monitoring of emissions and soil assessment lead to continuous demand whereas various reputable research institutions come up with new analytical techniques. The synergy between precision manufacturing and scientific expertise sustains Germany’s dominant market role.
United Kingdom Environmental Mass Spectrometry Market
Environmental mass spectrometry market in the United Kingdom experiences rapid growth driven by aggressive policy targets for air quality and climate mitigation. Financial incentives for clean tech adoption encourage widespread deployment of advanced analytical tools. A dynamic academic sector, combined with emerging start‑ups focused on portable spectrometry solutions, fuels market momentum and positions the United Kingdom as a fast‑moving leader.
France Environmental Mass Spectrometry Market
Environmental mass spectrometry market in France is emerging through concerted efforts to modernize environmental monitoring infrastructure. National initiatives aimed at water and soil quality enhancement stimulate demand for high‑resolution analytical platforms. Collaborative projects between research laboratories and biotechnology firms nurture the development of customized applications, supporting France’s growing presence in the market.
Asia Pacific is advancing by leveraging rapid industrialization, heightened environmental awareness, and strong governmental commitments to pollution control. The investment made into state-of-the-art laboratories, as well as in extensive academic programs, creates a skilled workforce competent in working with sophisticated equipment. Regional trade agreements allow for technology transfer, whereas new local producers begin providing affordable solutions and thus expanding the market access. All of the mentioned processes increase the capacity of the region to resolve complicated environmental problems using the latest mass spectrometric methods.
Japan Environmental Mass Spectrometry Market
Environmental mass spectrometry market in Japan is driven by a long‑standing focus on precision engineering and a proactive approach to environmental stewardship. Collaboration between elite academic institutions and manufacturers speeds up the improvement process of sensitive devices. Government regulations focused on water and air quality assurance ensure strong demand for such products, securing Japan’s advantageous position in the marketplace.
South Korea Environmental Mass Spectrometry Market
Environmental mass spectrometry market in South Korea gains momentum through vigorous support for green technology research and an expanding network of environmental testing laboratories. The collaboration between those operating in the technological sector and academia allows for the rapid prototyping of ground-breaking spectrometry technologies. The commitment of the nation to adhere to strict environmental regulations leads to ongoing growth of the industry.
To know more about the market opportunities by region and country, click here to
Buy The Complete Report
Increasing Regulatory Scrutiny
Adopting Sustainable Sample Preparation
High Capital Investment Requirements
Complex Data Interpretation Challenges
Request Free Customization of this report to help us to meet your business objectives.
The competitive landscape is shaped by aggressive capital inflows into portable and AI‑driven mass spectrometry platforms, prompting firms to secure market share through strategic alliances and technology integration. Recent examples include Enveda’s $360 million financing round that fuels its AI‑mass‑spec analytics pipeline, and a surge of venture‑backed partnerships targeting real‑time environmental monitoring hardware, accelerating product roll‑outs and reinforcing barriers to entry.
Top Player’s Company Profile
Recent Developments
SkyQuest’s ABIRAW (Advanced Business Intelligence, Research & Analysis Wing) is our Business Information Services team that Collects, Collates, Correlates, and Analyses the Data collected by means of Primary Exploratory Research backed by robust Secondary Desk research.
As per SkyQuest analysis, the global environmental mass spectrometry market is being propelled primarily by heightened regulatory scrutiny that demands precise, high‑sensitivity pollutant detection, while a second catalyst is the shift toward sustainable sample‑preparation methods that lower solvent use and waste, appealing to eco‑conscious laboratories. However, the high capital outlay required for advanced instruments remains a notable restraint limiting adoption, especially among smaller labs. North America continues to dominate the market thanks to its strong research ecosystem, extensive funding, and mature regulatory framework, and within the product landscape, gas chromatography‑mass spectrometry retains the leading share because of its robust separative power for complex volatile mixtures.
| Report Metric | Details |
|---|---|
| Market size value in 2024 | USD 2.84 Billion |
| Market size value in 2033 | USD 5.49 Billion |
| Growth Rate | 7.6% |
| Base year | 2024 |
| Forecast period | (2026-2033) |
| Forecast Unit (Value) | USD Billion |
| Segments covered |
|
| Regions covered | North America (US, Canada), Europe (Germany, France, United Kingdom, Italy, Spain, Rest of Europe), Asia Pacific (China, India, Japan, Rest of Asia-Pacific), Latin America (Brazil, Rest of Latin America), Middle East & Africa (South Africa, GCC Countries, Rest of MEA) |
| Companies covered |
|
| Customization scope | Free report customization with purchase. Customization includes:-
|
To get a free trial access to our platform which is a one stop solution for all your data requirements for quicker decision making. This platform allows you to compare markets, competitors who are prominent in the market, and mega trends that are influencing the dynamics in the market. Also, get access to detailed SkyQuest exclusive matrix.
Table Of Content
Executive Summary
Market overview
Parent Market Analysis
Market overview
Market size
KEY MARKET INSIGHTS
COVID IMPACT
MARKET DYNAMICS & OUTLOOK
Market Size by Region
KEY COMPANY PROFILES
Methodology
For the Environmental Mass Spectrometry Market, our research methodology involved a mixture of primary and secondary data sources. Key steps involved in the research process are listed below:
1. Information Procurement: This stage involved the procurement of Market data or related information via primary and secondary sources. The various secondary sources used included various company websites, annual reports, trade databases, and paid databases such as Hoover's, Bloomberg Business, Factiva, and Avention. Our team did 45 primary interactions Globally which included several stakeholders such as manufacturers, customers, key opinion leaders, etc. Overall, information procurement was one of the most extensive stages in our research process.
2. Information Analysis: This step involved triangulation of data through bottom-up and top-down approaches to estimate and validate the total size and future estimate of the Environmental Mass Spectrometry Market.
3. Report Formulation: The final step entailed the placement of data points in appropriate Market spaces in an attempt to deduce viable conclusions.
4. Validation & Publishing: Validation is the most important step in the process. Validation & re-validation via an intricately designed process helped us finalize data points to be used for final calculations. The final Market estimates and forecasts were then aligned and sent to our panel of industry experts for validation of data. Once the validation was done the report was sent to our Quality Assurance team to ensure adherence to style guides, consistency & design.
Analyst Support
Customization Options
With the given market data, our dedicated team of analysts can offer you the following customization options are available for the Environmental Mass Spectrometry Market:
Product Analysis: Product matrix, which offers a detailed comparison of the product portfolio of companies.
Regional Analysis: Further analysis of the Environmental Mass Spectrometry Market for additional countries.
Competitive Analysis: Detailed analysis and profiling of additional Market players & comparative analysis of competitive products.
Go to Market Strategy: Find the high-growth channels to invest your marketing efforts and increase your customer base.
Innovation Mapping: Identify racial solutions and innovation, connected to deep ecosystems of innovators, start-ups, academics, and strategic partners.
Category Intelligence: Customized intelligence that is relevant to their supply Markets will enable them to make smarter sourcing decisions and improve their category management.
Public Company Transcript Analysis: To improve the investment performance by generating new alpha and making better-informed decisions.
Social Media Listening: To analyze the conversations and trends happening not just around your brand, but around your industry as a whole, and use those insights to make better Marketing decisions.
REQUEST FOR SAMPLE
 REQUEST FREE CUSTOMIZATION
Global Environmental Mass Spectrometry Market size was valued at USD 2.84 Billion in 2024 and is poised to grow from USD 3.06 Billion in 2025 to USD 5.49 Billion by 2033, growing at a CAGR of 7.6% during the forecast period (2026-2033).
The competitive landscape is shaped by aggressive capital inflows into portable and AI‑driven mass spectrometry platforms, prompting firms to secure market share through strategic alliances and technology integration. Recent examples include Enveda’s $360 million financing round that fuels its AI‑mass‑spec analytics pipeline, and a surge of venture‑backed partnerships targeting real‑time environmental monitoring hardware, accelerating product roll‑outs and reinforcing barriers to entry. 'Thermo Fisher Scientific', 'Agilent Technologies', 'Danaher Corporation', 'Waters Corporation', 'Bruker Corporation', 'Shimadzu Corporation', 'PerkinElmer', 'Jeol Ltd', 'Hitachi', 'Horiba', 'Rigaku Corporation', 'Oxford Instruments', 'Inficon Holding', 'Teledyne Technologies', 'Ametek', 'Honeywell International', 'Siemens AG', 'Emerson Electric', 'Yokogawa Electric', 'Endress+Hauser'
Stringent environmental regulations worldwide demand accurate detection of pollutants, and mass spectrometry offers unparalleled sensitivity and specificity. As agencies enforce tighter limits on emissions and contamination, laboratories require advanced analytical tools to meet compliance. This regulatory pressure drives adoption of environmental mass spectrometry platforms, prompting manufacturers to innovate and expand product portfolios. Consequently, the market experiences sustained growth as stakeholders prioritize compliance, risk mitigation, and reliable data generation to satisfy legal obligations and protect public health and support long‑term environmental stewardship.
Sustainable Analytical Instrumentation: Growing demand for environmentally friendly mass spectrometry solutions is driving manufacturers to adopt greener designs, such as reduced solvent consumption, energy‑efficient components, and recyclable consumables, aligning product portfolios with corporate sustainability goals and regulatory pressures while meeting customer expectations for lower ecological footprints.
Why does North America Dominate the Global Environmental Mass Spectrometry Market? |@12


Want to customize this report? This report can be personalized according to your needs. Our analysts and industry experts will work directly with you to understand your requirements and provide you with customized data in a short amount of time. We offer $1000 worth of FREE customization at the time of purchase.
Feedback From Our Clients


 USA (+1) 351-333-4748

