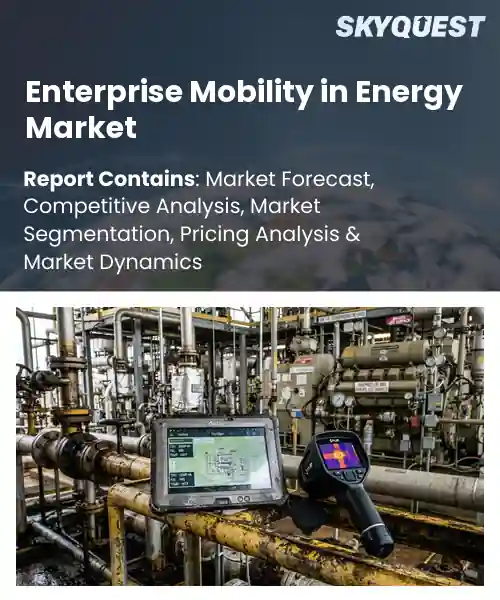
Enterprise Mobility in Energy Market
Report ID: SQMIG45B2411
Report ID: SQMIG45B2411
[email protected]
USA +1 351-333-4748
Report ID:
SQMIG45B2411 |
Region:
Global |
Published Date: September, 2026
Pages:
157
|Tables:
122
|Figures:
77


Global Enterprise Mobility In Energy Market size was valued at USD 14.8 Billion in 2024 and is poised to grow from USD 16.65 Billion in 2025 to USD 42.73 Billion by 2033, growing at a CAGR of 12.5% during the forecast period (2026-2033).
The engine driving enterprise mobility in the energy sector is the push for data visibility across assets. Utilities and oil‑and‑gas firms manage thousands of remote sites, and mobile platforms let technicians capture sensor readings, safety checklists, and maintenance logs instantly, eliminating lag inherent in paper processes. Historically, the market moved from simple handheld scanners in the early 2000s to today’s 5G tablets that sync with cloud analytics hubs. This shift matters because it shortens outage durations, cuts operating costs, and strengthens compliance, as shown by a utility that reduced dispatch time by 30 percent after adopting a mobile work‑order system. The convergence of analytics with edge computing acts as a catalyst reshaping mobility in energy because processed insights returned to field crews enable corrective actions that avert failures. Devices gather turbine or pipeline measurements, edge nodes filter the data, and alerts appear on handheld dashboards, prompting technicians to address issues before they trigger shutdowns. This loop drives demand for predictive‑maintenance platforms; a European offshore wind operator cut turbine downtime by 15 percent after deploying an AI‑enhanced interface that visualizes vibration trends in time. Demonstrated ROI pushes energy firms to invest in network solutions, expanding migration of SCADA functions onto terminals.
How is AI-driven enterprise mobility enhancing operational efficiency in the energy sector?
AI driven enterprise mobility links field crews, control rooms and analytics through smart devices that understand context and predict needs. It enables real time data capture, remote diagnostics and automated work orders, cutting manual paperwork and travel time. Operators see equipment health on tablets, receive AI generated safety alerts and can adjust settings without returning to a central hub. The market moves from legacy handhelds to integrated platforms that combine edge computing, cloud insights and voice assistance. Companies adopt these tools to streamline maintenance, improve asset uptime and lower operational costs.Siemens announced its AI driven mobile operations platform in March 2024, giving field technicians predictive analytics on handhelds and instant repair coordination, which speeds response and fuels market growth. The solution merges sensor data, machine learning and secure communications, helping energy firms cut downtime and boost efficiency.
Market snapshot - (2026-2033)
Global Market Size
USD 14.8 Billion
Largest Segment
Mobile Device Management
Fastest Growth
Mobile Workforce Management
Growth Rate
12.5% CAGR
To get more insights on this market click here to Request a Free Sample Report
Global enterprise mobility in energy market is segmented by mobility solution, deployment, application, end user and region. Based on mobility solution, the market is segmented into Mobile Device Management, Enterprise Mobility Management, Mobile Workforce Management, Mobile Applications and Mobile Security Solutions. Based on deployment, the market is segmented into Cloud-Based, On-Premise and Hybrid. Based on application, the market is segmented into Field Service Management, Asset & Infrastructure Management, Workforce Safety & Compliance, Operations & Maintenance and Other Applications. Based on end user, the market is segmented into Oil & Gas, Power Generation, Utilities and Renewable Energy. Based on region, the market is segmented into North America, Europe, Asia Pacific, Latin America and Middle East & Africa.
Field Service Management segment leads because it orchestrates dispatch, work order tracking, and remote assistance through mobile interfaces, directly tying field activities to central planning systems. This coordination reduces downtime, optimizes resource allocation, and ensures compliance with industry standards, making it the backbone of productivity improvements for energy operators embracing mobile workforces. By delivering real time visibility into task progress and enabling predictive maintenance decisions, it also supports strategic cost reduction and enhances overall operational resilience across the enterprise.
Meanwhile, Workforce Safety and Compliance segment experiences the strongest growth because regulatory scrutiny and the need for real time incident reporting push firms to adopt mobile safety tools. These solutions embed checklists, geofencing, and automated alerts, driving higher adoption across sites and creating new demand for integrated safety ecosystems that expand the market’s scope.
Mobile Device Management segment dominates because it provides the core control layer that unifies device provisioning, policy enforcement, and lifecycle management across dispersed field assets, enabling energy firms to maintain regulatory compliance while reducing operational risk. Its ability to integrate with existing IT infrastructure and enforce security standards creates a trusted foundation for any mobile initiative, making it indispensable for the sector’s digital transformation and supports seamless updates across heterogeneous hardware platforms.
However, Mobile Applications segment emerges as the fastest growing because developers are creating purpose built tools that digitize inspection, permit real time data capture, and integrate AI insights directly on field devices. This innovation fuels higher adoption rates, expands use cases beyond traditional reporting, and positions mobile apps as a catalyst for broader market expansion.
To get detailed segments analysis, Request a Free Sample Report
North America’s leadership in enterprise mobility for the energy sector stems from a confluence of deep technological expertise, mature capital markets and proactive regulatory frameworks. The region benefits from a dense network of research institutions that continuously feed innovative mobile applications into oil, gas and utility operations. Established energy companies collaborate closely with leading software vendors and telecom providers, enabling rapid deployment of secure, data‑rich mobile platforms. Strong investment appetites accelerate adoption of cloud‑based asset management, predictive maintenance and field‑service solutions. In addition, policy incentives encourage digital transformation aimed at efficiency and emissions reduction, reinforcing an ecosystem where mobile‑first strategies become integral to operational resilience and competitive advantage. This environment also nurtures a skilled workforce adept at integrating IoT and AI into field operations.
Enterprise Mobility in Energy Market in the United States is propelled by an integrated telecommunications backbone combined with a culture of rapid innovation. Leading oil and utility firms partner with premier software developers to embed analytics into field devices, enhancing safety and reducing downtime. Robust venture ecosystems fund startups that specialize in mobile asset tracking and predictive maintenance, while regulatory encouragement for low‑carbon operations accelerates digital rollout across energy assets.
Enterprise Mobility in Energy Market in Canada benefits from programs that align energy transition goals with mobile technology adoption. Provincial utilities and oil firms work closely with hubs to pilot sensor‑rich field applications that improve operational visibility. A supportive regulatory climate encourages data sharing across stakeholders, while an expanding broadband footprint enables reliable connectivity in remote extraction zones. This approach accelerates the integration of mobile solutions into renewable energy projects.
Europe’s rapid expansion in enterprise mobility for the energy arena is driven by ambitious climate objectives, extensive regulatory support and a deep engineering heritage. Nations across the region invest heavily in digital infrastructure that links grid operators, oil and gas producers, and emerging renewables through mobile platforms. Collaborative research programs bring together utilities, technology firms and academic centers to create interoperable solutions for asset monitoring, predictive maintenance and remote field coordination. Strong emphasis on data security and standardization builds trust among stakeholders, encouraging wider adoption of mobile‑first workflows. Incentive schemes that reward efficiency gains and emissions reductions further motivate companies to embed advanced mobile applications, positioning Europe as a hub of innovative, sustainable energy operations. Cross‑border data sharing initiatives further streamline operations, allowing firms to leverage best practices across national grids and supply chains.
Enterprise Mobility in Energy Market in Germany is anchored by an industrial base and an agenda focused on energy transition. Leading utilities collaborate with engineering firms to deploy mobile diagnostics that enhance turbine efficiency and grid reliability. Public‑private partnerships fund pilot projects integrating AI‑driven analytics into field devices, while stringent data protection standards assure information flow. This ecosystem accelerates the rollout of mobile solutions across conventional and renewable energy assets.
Enterprise Mobility in Energy Market in the United Kingdom is experiencing fastest growth as operators leverage mobile platforms to meet stringent decarbonisation targets. Major oil and utility players partner with fintech and software innovators to embed emissions monitoring into devices used by field crews. Government incentives promote adoption of low‑power wide‑area networks, extending connectivity to remote offshore sites. This convergence of policy, technology and investment fuels scalability of energy solutions.
Enterprise Mobility in Energy Market in France is emerging as a focal point for initiatives that blend renewable integration with field operations. French utilities collaborate with research institutes to test mobile applications that synchronize wind farm diagnostics and solar asset monitoring. Standards for data exchange simplify connectivity across heterogeneous equipment, while government grants support deployments. These coordinated efforts create an environment for scaling mobile technologies throughout the evolving energy landscape.
Asia Pacific is strengthening its role in enterprise mobility for the energy sector by leveraging rapid digital adoption, expansive telecom networks and accelerating energy transitions. Nations across the region invest in high‑speed connectivity that reaches remote offshore fields and rugged on‑shore sites, enabling real‑time data capture from mobile devices. Leading energy corporations partner with regional technology firms to embed AI‑enhanced diagnostics and predictive maintenance into field operations, improving safety and operational efficiency. Government initiatives promote low‑carbon strategies and provide incentives for mobile‑first solutions, while a burgeoning startup ecosystem introduces innovative sensor platforms and edge‑computing services. This combination of infrastructure, policy support and entrepreneurial vigor positions Asia Pacific as a dynamic hub for next‑generation mobile energy management. Regional partnerships also facilitate shared standards, allowing operators to extend mobile workflows across borders and supply chains.
Enterprise Mobility in Energy Market in Japan is characterized by automation and an emphasis on safety for offshore and on‑shore operations. Japanese utilities collaborate with robotics and IoT providers to embed mobile sensor suites that monitor equipment health and environmental conditions. Government programs prioritize twins and analytics, fostering rapid integration of mobile platforms into generation and renewable assets. This disciplined approach drives reliability and efficiency across the nation’s energy infrastructure.
Enterprise Mobility in Energy Market in South Korea is powered by a manufacturing sector and digital‑government policies focused on energy efficiency. Leading energy firms cooperate with domestic semiconductor and software companies to create compact terminals for monitoring of conventional plants and offshore wind farms. National programs promote 5G rollout, providing low‑latency links for field decisions. This ecosystem speeds adoption of solutions that improve operational agility across the nation’s energy portfolio.
To know more about the market opportunities by region and country, click here to
Buy The Complete Report
Rising Demand for Remote Operations
Enhanced Connectivity Through 5G Networks
High Capital Investment Requirements
Data Security and Privacy Concerns
Request Free Customization of this report to help us to meet your business objectives.
The enterprise mobility segment in the energy sector is shaped by intense competition as incumbents and new entrants vie to embed connectivity, AI and renewable integration into fleet operations. Market pressure drives M&A such as Siemens’ acquisition of a mobility‑software firm, while Schneider Electric’s partnership with a telecom carrier expands edge‑compute services, and ABB’s launch of a digital‑twin platform accelerates predictive maintenance for mobile assets.
Top Player’s Company Profile
Recent Developments
SkyQuest’s ABIRAW (Advanced Business Intelligence, Research & Analysis Wing) is our Business Information Services team that Collects, Collates, Correlates, and Analyses the Data collected by means of Primary Exploratory Research backed by robust Secondary Desk research. As per SkyQuest analysis the global enterprise mobility market in energy is projected to rise from $16.65 billion in 2025 to $42.73 billion by 2033, driven primarily by the rising demand for remote operations that let technicians capture data instantly and cut travel costs. A second catalyst is the rollout of 5G networks which provides the bandwidth and low latency needed for real‑time monitoring and AI‑enhanced diagnostics. The leading segment is mobile device management because it supplies the secure backbone for all field devices, while the dominant region remains North America thanks to its mature tech ecosystem and strong investment climate. However, the high upfront capital required for rugged hardware and secure infrastructure continues to temper adoption.
| Report Metric | Details |
|---|---|
| Market size value in 2024 | USD 14.8 Billion |
| Market size value in 2033 | USD 42.73 Billion |
| Growth Rate | 12.5% |
| Base year | 2024 |
| Forecast period | (2026-2033) |
| Forecast Unit (Value) | USD Billion |
| Segments covered |
|
| Regions covered | North America (US, Canada), Europe (Germany, France, United Kingdom, Italy, Spain, Rest of Europe), Asia Pacific (China, India, Japan, Rest of Asia-Pacific), Latin America (Brazil, Rest of Latin America), Middle East & Africa (South Africa, GCC Countries, Rest of MEA) |
| Companies covered |
|
| Customization scope | Free report customization with purchase. Customization includes:-
|
To get a free trial access to our platform which is a one stop solution for all your data requirements for quicker decision making. This platform allows you to compare markets, competitors who are prominent in the market, and mega trends that are influencing the dynamics in the market. Also, get access to detailed SkyQuest exclusive matrix.
Table Of Content
Executive Summary
Market overview
Parent Market Analysis
Market overview
Market size
KEY MARKET INSIGHTS
COVID IMPACT
MARKET DYNAMICS & OUTLOOK
Market Size by Region
KEY COMPANY PROFILES
Methodology
For the Enterprise Mobility in Energy Market, our research methodology involved a mixture of primary and secondary data sources. Key steps involved in the research process are listed below:
1. Information Procurement: This stage involved the procurement of Market data or related information via primary and secondary sources. The various secondary sources used included various company websites, annual reports, trade databases, and paid databases such as Hoover's, Bloomberg Business, Factiva, and Avention. Our team did 45 primary interactions Globally which included several stakeholders such as manufacturers, customers, key opinion leaders, etc. Overall, information procurement was one of the most extensive stages in our research process.
2. Information Analysis: This step involved triangulation of data through bottom-up and top-down approaches to estimate and validate the total size and future estimate of the Enterprise Mobility in Energy Market.
3. Report Formulation: The final step entailed the placement of data points in appropriate Market spaces in an attempt to deduce viable conclusions.
4. Validation & Publishing: Validation is the most important step in the process. Validation & re-validation via an intricately designed process helped us finalize data points to be used for final calculations. The final Market estimates and forecasts were then aligned and sent to our panel of industry experts for validation of data. Once the validation was done the report was sent to our Quality Assurance team to ensure adherence to style guides, consistency & design.
Analyst Support
Customization Options
With the given market data, our dedicated team of analysts can offer you the following customization options are available for the Enterprise Mobility in Energy Market:
Product Analysis: Product matrix, which offers a detailed comparison of the product portfolio of companies.
Regional Analysis: Further analysis of the Enterprise Mobility in Energy Market for additional countries.
Competitive Analysis: Detailed analysis and profiling of additional Market players & comparative analysis of competitive products.
Go to Market Strategy: Find the high-growth channels to invest your marketing efforts and increase your customer base.
Innovation Mapping: Identify racial solutions and innovation, connected to deep ecosystems of innovators, start-ups, academics, and strategic partners.
Category Intelligence: Customized intelligence that is relevant to their supply Markets will enable them to make smarter sourcing decisions and improve their category management.
Public Company Transcript Analysis: To improve the investment performance by generating new alpha and making better-informed decisions.
Social Media Listening: To analyze the conversations and trends happening not just around your brand, but around your industry as a whole, and use those insights to make better Marketing decisions.
REQUEST FOR SAMPLE
 REQUEST FREE CUSTOMIZATION


Want to customize this report? This report can be personalized according to your needs. Our analysts and industry experts will work directly with you to understand your requirements and provide you with customized data in a short amount of time. We offer $1000 worth of FREE customization at the time of purchase.
Feedback From Our Clients


 USA (+1) 351-333-4748

