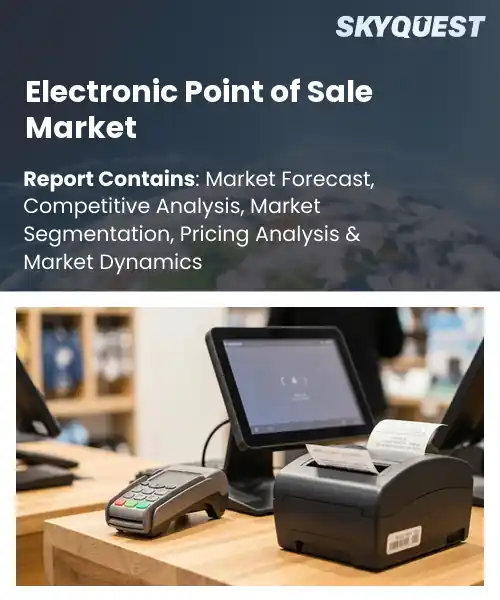
Electronic Point of Sale Market
Report ID: SQMIG45I2471
Report ID: SQMIG45I2471
[email protected]
USA +1 351-333-4748
Report ID:
SQMIG45I2471 |
Region:
Global |
Published Date: July, 2026
Pages:
157
|Tables:
117
|Figures:
77


Global Electronic Point Of Sale Market size was valued at USD 32.6 Billion in 2024 and is poised to grow from USD 35.79 Billion in 2025 to USD 75.62 Billion by 2033, growing at a CAGR of 9.8% during the forecast period (2026-2033).
The global electronic point‑of‑sale (EPOS) market comprises integrated hardware and software systems that capture transaction data, manage inventory, and enable omnichannel commerce. Its relevance stems from the shift away from cash registers toward digital ecosystems that provide real‑time analytics for retailers of all sizes. The primary driver behind this transformation is the widespread adoption of cloud computing, which reduces upfront capital costs and allows vendors to roll out updates instantly. Early adopters such as Starbucks and Zara demonstrated how cloud‑based EPOS platforms streamlined promotions and supply‑chain coordination, prompting a rapid expansion that has continued through successive generations of mobile‑first solutions. A second critical factor shaping the EPOS market is the integration of artificial‑intelligence analytics, which converts transaction streams into predictive insights that drive inventory optimization and personalized marketing. As retailers collect data, AI‑enabled dashboards reveal purchasing patterns, prompting re‑stock orders that reduce out‑of‑stock incidents and improve cash flow. This capability has opened opportunities for niche players such as small‑batch coffee shops that can now compete with large chains by tailoring offers in time based on foot‑traffic analysis. Consequently, investment in AI modules accelerates vendor differentiation, fuels subscription services, and expands the market’s value across hospitality, grocery, and specialty retail sectors.
How is AI-driven automation reshaping the electronic point‑of‑sale market?
AI driven automation is turning electronic point of sale systems into intelligent hubs that do more than capture transactions. Machine learning models analyze each sale in real time, adjusting inventory recommendations, personalising offers and flagging suspicious activity. Cloud based POS platforms now embed these capabilities, allowing retailers to scale insights across locations without heavy IT overhead. The shift reduces checkout friction, speeds up staff training and frees managers to focus on strategy rather than manual data entry. As merchants adopt contactless and mobile payments, the embedded AI ensures a seamless experience that adapts to shopper behaviour and operational demands.In June 2025, a leading POS vendor launched an AI enhanced terminal that predicts stock shortages and suggests reorders before shelves run empty, streamlining supply chains and cutting downtime. The rollout illustrates how automation fuels efficiency and supports the market’s rapid expansion.
Market snapshot - (2026-2033)
Global Market Size
USD 32.6 Billion
Largest Segment
Hardware
Fastest Growth
Software
Growth Rate
9.8% CAGR
To get more insights on this market click here to Request a Free Sample Report
Global electronic point of sale market is segmented by component, product type, deployment, end user and region. Based on component, the market is segmented into Hardware, Software and Services. Based on product type, the market is segmented into Fixed POS, Mobile POS and Self-Service POS. Based on deployment, the market is segmented into Cloud and On-Premises. Based on end user, the market is segmented into Retail, Hospitality, Healthcare and Entertainment. Based on region, the market is segmented into North America, Europe, Asia Pacific, Latin America and Middle East & Africa.
Software segment dominates because it provides the core intelligence that connects payment processing, inventory management, and customer relationship tools into a unified experience. Vendors focus on modular architecture that enables rapid updates and seamless integration with third party ecosystems, which reduces deployment friction and operational risk. This flexibility fuels widespread adoption across diverse retailer sizes, reinforcing its central position in market dynamics. It also encourages long term vendor loyalty by offering scalable licensing models aligned with business growth.
However, Hardware segment expands rapidly as merchants seek tactile devices that support contactless interactions, biometric authentication, and durability for high traffic environments. Continuous innovation in form factor and battery efficiency creates new use cases in pop up locations and outdoor venues, unlocking fresh revenue streams and prompting retailers to upgrade physical interfaces frequently.
Fixed POS segment dominates because it delivers a stable, high throughput environment that meets the rigorous transaction speed and reliability expectations of brick and mortar establishments. The mature hardware ecosystem, coupled with entrenched software integrations, simplifies compliance with payment standards and reduces downtime, making it the preferred choice for large volume retailers seeking consistent operational performance. Additionally, its proven track record lowers risk for investors and accelerates rollout of ancillary services such as loyalty programs and real time analytics.
Meanwhile, Mobile POS segment experiences the strongest growth momentum as consumers increasingly demand flexible shopping experiences that blend in store and online interactions. Lightweight devices equipped with wireless connectivity and omnichannel software enable rapid checkout on the shop floor, pop up events, and curbside services, driving adoption across small and medium merchants seeking agility and cost effective scaling.
To get detailed segments analysis, Request a Free Sample Report
The region combines a deep integration of cutting‑edge hardware and software solutions with a cultural emphasis on speed and convenience in retail environments. Robust manufacturing capabilities enable rapid production of sophisticated terminals, while a tech‑savvy consumer base readily embraces contactless and mobile payment experiences. Collaborative ecosystems among retailers, fintech innovators, and regulatory bodies foster continuous improvement and early adoption of emerging standards. Additionally, strong focus on seamless omnichannel experiences drives retailers to invest in versatile POS platforms that unify in‑store and digital channels, reinforcing the region’s leadership in market dynamics.
Electronic Point of Sale Market in Japan reflects a sophisticated blend of legacy retail practices and forward‑looking digital innovations. High consumer expectations for service quality push retailers to deploy intuitive interfaces and integrated loyalty programs. Partnerships between local technology firms and global payment networks accelerate the rollout of secure, cloud‑based solutions, while a regulatory climate that emphasizes data protection supports trust in electronic transactions.
Electronic Point of Sale Market in South Korea thrives on an environment of rapid technology diffusion and strong consumer appetite for mobile commerce. Retailers prioritize seamless integration of QR code payments and NFC solutions, driving demand for adaptable hardware. Close ties between leading electronics manufacturers and software developers foster continual enhancements in system reliability and user experience, reinforcing the country’s role as a catalyst for regional POS advancement.
The market benefits from a pervasive focus on customer experience that encourages retailers to adopt flexible, cloud‑enabled POS platforms. A culture of innovation, supported by leading technology firms, fuels the development of advanced analytics and AI‑driven insights that enhance operational efficiency. Consumer preferences for integrated loyalty programs and real‑time inventory visibility propel retailers toward omnichannel solutions. Collaborative partnerships between payment processors, hardware providers, and software developers create a vibrant ecosystem that accelerates deployment of secure, contactless payment options, reinforcing the region’s momentum.
Electronic Point of Sale Market in United States showcases a dynamic landscape where large retail chains and emerging boutique stores alike pursue highly customizable solutions. Emphasis on real‑time data integration and personalized customer engagement drives adoption of sophisticated POS software. Strong venture capital activity fuels startups that introduce innovative payment methods, while extensive developer communities contribute to a rich ecosystem of add‑on applications that broaden functionality and improve store efficiency.
Electronic Point of Sale Market in Canada reflects a balanced blend of tradition and modernity, with retailers valuing both reliability and technological advancement. Focus on secure, interoperable payment infrastructures encourages the uptake of contactless and mobile payment options. Collaborative initiatives between financial institutions and technology vendors emphasize compliance and data privacy, fostering confidence among merchants and shoppers alike, while supporting gradual transition toward integrated, cloud‑centric POS environments.
European stakeholders emphasize regulatory harmonization and data security, creating a trusted environment for electronic transactions across borders. Investment in research and development by a network of universities and tech hubs fuels innovations such as open‑architecture POS systems and sustainable energy‑efficient hardware. Retailers adopt unified platforms that enable seamless integration of loyalty schemes, inventory management, and analytics, enhancing operational agility. A strong commitment to sustainability drives the incorporation of eco‑friendly components and practices, reinforcing Europe’s reputation as a forward‑looking market for advanced POS solutions.
Electronic Point of Sale Market in Germany benefits from a meticulous approach to engineering excellence and precision. Manufacturers prioritize durable hardware designed for high‑volume environments, while software providers focus on robust security protocols. Retailers seek integrated solutions that align with stringent data protection standards, encouraging the adoption of modular platforms that can be tailored to diverse retail formats across the country.
Electronic Point of Sale Market in United Kingdom exhibits a strong orientation toward customer‑centric innovations, with retailers embracing omnichannel strategies that blend physical storefronts with digital experiences. Emphasis on swift payment processing and seamless loyalty integration drives the proliferation of contactless and mobile payment options, while collaborative ecosystems among fintech firms and POS vendors accelerate the rollout of adaptable, cloud‑based solutions.
Electronic Point of Sale Market in France reflects a cultural emphasis on personalized service and boutique retail experiences. Retailers prioritize POS systems that support rich, multilingual interfaces and detailed customer profiling. Partnerships with local technology innovators encourage the development of solutions that balance aesthetic design with functional efficiency, fostering a market environment that values both elegance and technological progress.
To know more about the market opportunities by region and country, click here to
Buy The Complete Report
Increasing Adoption Of Mobile Payments
Cloud Based POS Solutions Expanding
High Initial Capital Investment
Regulatory Compliance Complexity Across Regions
Request Free Customization of this report to help us to meet your business objectives.
The competitive landscape is shaped by established hardware leaders such as Verifone and Ingenico expanding into cloud‑based services, while fintech firms like Square and Stripe accelerate POS integration through strategic acquisitions and partnerships, exemplified by Square’s acquisition of Afterpay and Stripe’s launch of Terminal hardware to capture merchant ecosystems. Companies are also racing to embed AI‑driven analytics and contactless payment capabilities, driving rapid product innovation and collaborative ecosystems across the market.
Top Player’s Company Profile
Recent Developments
SkyQuest’s ABIRAW (Advanced Business Intelligence, Research & Analysis Wing) is our Business Information Services team that Collects, Collates, Correlates, and Analyses the Data collected by means of Primary Exploratory Research backed by robust Secondary Desk research. According to SkyQuest analysis the global electronic point‑of‑sale market is being propelled primarily by the rapid adoption of mobile payments, which streamlines checkout and boosts shopper loyalty, while a second strong catalyst comes from cloud‑based POS platforms that cut upfront infrastructure costs and enable seamless updates across locations. The software segment leads the market because it provides the intelligence that links payment processing, inventory and customer engagement. Asia Pacific dominates the landscape, driven by advanced manufacturing and a tech‑savvy consumer base. However, high initial capital investment remains a notable restraint, especially for small and medium retailers that hesitate to upgrade legacy systems, tempering the overall pace of adoption.
| Report Metric | Details |
|---|---|
| Market size value in 2024 | USD 32.6 Billion |
| Market size value in 2033 | USD 75.62 Billion |
| Growth Rate | 9.8% |
| Base year | 2024 |
| Forecast period | (2026-2033) |
| Forecast Unit (Value) | USD Billion |
| Segments covered |
|
| Regions covered | North America (US, Canada), Europe (Germany, France, United Kingdom, Italy, Spain, Rest of Europe), Asia Pacific (China, India, Japan, Rest of Asia-Pacific), Latin America (Brazil, Rest of Latin America), Middle East & Africa (South Africa, GCC Countries, Rest of MEA) |
| Companies covered |
|
| Customization scope | Free report customization with purchase. Customization includes:-
|
To get a free trial access to our platform which is a one stop solution for all your data requirements for quicker decision making. This platform allows you to compare markets, competitors who are prominent in the market, and mega trends that are influencing the dynamics in the market. Also, get access to detailed SkyQuest exclusive matrix.
Table Of Content
Executive Summary
Market overview
Parent Market Analysis
Market overview
Market size
KEY MARKET INSIGHTS
COVID IMPACT
MARKET DYNAMICS & OUTLOOK
Market Size by Region
KEY COMPANY PROFILES
Methodology
For the Electronic Point of Sale Market, our research methodology involved a mixture of primary and secondary data sources. Key steps involved in the research process are listed below:
1. Information Procurement: This stage involved the procurement of Market data or related information via primary and secondary sources. The various secondary sources used included various company websites, annual reports, trade databases, and paid databases such as Hoover's, Bloomberg Business, Factiva, and Avention. Our team did 45 primary interactions Globally which included several stakeholders such as manufacturers, customers, key opinion leaders, etc. Overall, information procurement was one of the most extensive stages in our research process.
2. Information Analysis: This step involved triangulation of data through bottom-up and top-down approaches to estimate and validate the total size and future estimate of the Electronic Point of Sale Market.
3. Report Formulation: The final step entailed the placement of data points in appropriate Market spaces in an attempt to deduce viable conclusions.
4. Validation & Publishing: Validation is the most important step in the process. Validation & re-validation via an intricately designed process helped us finalize data points to be used for final calculations. The final Market estimates and forecasts were then aligned and sent to our panel of industry experts for validation of data. Once the validation was done the report was sent to our Quality Assurance team to ensure adherence to style guides, consistency & design.
Analyst Support
Customization Options
With the given market data, our dedicated team of analysts can offer you the following customization options are available for the Electronic Point of Sale Market:
Product Analysis: Product matrix, which offers a detailed comparison of the product portfolio of companies.
Regional Analysis: Further analysis of the Electronic Point of Sale Market for additional countries.
Competitive Analysis: Detailed analysis and profiling of additional Market players & comparative analysis of competitive products.
Go to Market Strategy: Find the high-growth channels to invest your marketing efforts and increase your customer base.
Innovation Mapping: Identify racial solutions and innovation, connected to deep ecosystems of innovators, start-ups, academics, and strategic partners.
Category Intelligence: Customized intelligence that is relevant to their supply Markets will enable them to make smarter sourcing decisions and improve their category management.
Public Company Transcript Analysis: To improve the investment performance by generating new alpha and making better-informed decisions.
Social Media Listening: To analyze the conversations and trends happening not just around your brand, but around your industry as a whole, and use those insights to make better Marketing decisions.
REQUEST FOR SAMPLE
 REQUEST FREE CUSTOMIZATION


Want to customize this report? This report can be personalized according to your needs. Our analysts and industry experts will work directly with you to understand your requirements and provide you with customized data in a short amount of time. We offer $1000 worth of FREE customization at the time of purchase.
Feedback From Our Clients


 USA (+1) 351-333-4748

