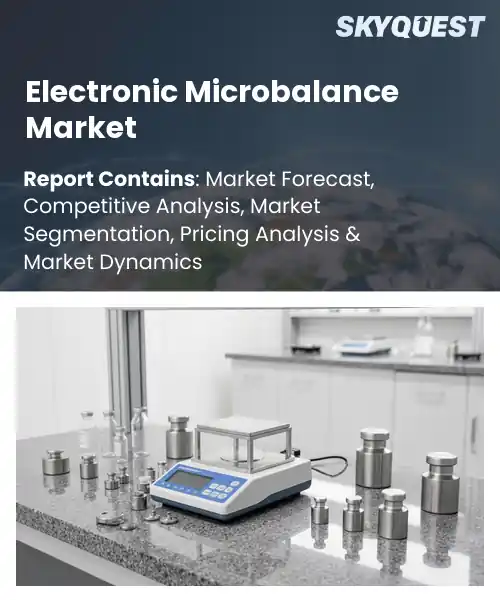
Electronic Microbalance Market
Report ID: SQMIG45J2769
Report ID: SQMIG45J2769
[email protected]
USA +1 351-333-4748
Report ID:
SQMIG45J2769 |
Region:
Global |
Published Date: August, 2026
Pages:
157
|Tables:
120
|Figures:
77


Global Electronic Microbalance Market size was valued at USD 296.5 Million in 2024 and is poised to grow from USD 319.63 Million in 2025 to USD 582.9 Million by 2033, growing at a CAGR of 7.8% during the forecast period (2026-2033).
The global electronic microbalance market supplies ultra‑precise weighing instruments that resolve masses down to microgram levels, a capability essential for pharmaceutical formulation, nanomaterial research, and forensic analysis. Its importance stems from the need to guarantee dosage accuracy, validate experimental results, and comply with stringent regulatory standards. Historically, mechanical balances dominated laboratories until the 1990s when digital transducers introduced higher stability and data connectivity. Since then, manufacturers have integrated Bluetooth interfaces, cloud‑based analytics, and automated calibration routines, expanding adoption from academic labs to large‑scale production lines.
Consequently, the market has evolved from niche scientific tools to critical components of quality‑control ecosystems. Building on this foundation, the surge in automation and Industry 4.0 initiatives drives the next wave of growth for electronic microbalances because manufacturers require integration of weight data into manufacturing execution systems. Real‑world examples include pharmaceutical plants that link balance outputs to batch‑record software, reducing error and shortening release cycles, while semiconductor fabs employ microbalances to monitor wafer‑cleaning chemicals, ensuring consistency. The cause‑effect chain is clear: as digital twins demand more accurate inputs, demand for balances with IoT connectivity, predictive maintenance, and traceable calibration records expands. Consequently, vendors that offer cloud‑enabled platforms capture significant new revenue streams and broaden market reach.
How is AI-driven Automation Influencing Accuracy And Adoption In The Electronic Microbalance Market?
AI driven automation is reshaping the electronic microbalance market by sharpening measurement precision and simplifying workflow. Intelligent algorithms monitor environmental variables, predict sensor drift and apply corrections without operator input. This reduces human error and shortens the time needed for routine calibration. Manufacturers embed machine learning models that learn from each weighing event, improving repeatability across a range of sample sizes. Laboratories benefit from faster throughput and more reliable data, encouraging adoption in pharmaceutical, material science and nanotechnology labs. As devices become more self optimising, purchasing decisions increasingly favour solutions that promise lower maintenance and higher confidence in results.
In June 2023, Mettler Toledo introduced an AI powered microbalance that automatically adjusts for temperature fluctuations and provides real time error alerts, illustrating how intelligent automation lifts accuracy and speeds adoption across research and quality control environments.
Market snapshot - (2026-2033)
Global Market Size
USD 296.5 Million
Largest Segment
Microbalance
Fastest Growth
Ultra-Microbalance
Growth Rate
7.8% CAGR
To get more insights on this market click here to Request a Free Sample Report
Global electronic microbalance market is segmented by product type, capacity, application, end user and region. Based on product type, the market is segmented into Ultra-Microbalance and Microbalance. Based on capacity, the market is segmented into Up to 5 g, 5–30 g and Above 30 g. Based on application, the market is segmented into Pharmaceutical Analysis, Research Laboratories, Material Science, Forensic Analysis and Others. Based on end user, the market is segmented into Pharmaceutical & Biotechnology Companies, Academic & Research Institutes, Testing Laboratories, Industrial Laboratories and Others. Based on region, the market is segmented into North America, Europe, Asia Pacific, Latin America and Middle East & Africa.
Ultra microbalance segment dominates because its exceptionally high resolution meets stringent measurement requirements in cutting‑edge pharmaceutical analysis, where trace‑level quantification is critical. The ability to detect minute mass changes enhances assay precision, prompting manufacturers to prioritize these instruments for drug formulation and stability testing. Consequently, heightened focus on therapeutic quality control drives sustained investment, reinforcing ultra microbalance’s central role in shaping market demand and supplier innovation for future growth.
However, microbalance segment stands out because it offers broader weighing ranges suitable for diverse material science experiments, where sample masses often exceed ultra microbalance limits. Its versatility attracts laboratories expanding into nanocomposite development and bulk property testing, accelerating adoption and creating new avenues for market expansion in the sector today.
Up to 5 g capacity segment leads because it matches the weight ranges most commonly used in academic and research institute protocols, where samples are limited and high precision is essential. The load cell design enables easy integration into laboratory setups, reducing footprint while preserving accuracy, which motivates laboratories to replace older balances. This alignment of size, precision, and typical sample mass sustains demand and places the segment at the market’s forefront.
Meanwhile, 5–30 g capacity segment emerges as the key high growth area because expanding industrial laboratories require broader weighing ranges for bulk material testing and quality control. Innovations in sensor technology enable higher stability at this capacity, attracting manufacturers seeking versatile equipment. This growing preference fuels rapid market expansion and opens new application opportunities.
To get detailed segments analysis, Request a Free Sample Report
North America maintains dominance through a confluence of advanced research infrastructure, robust funding mechanisms, and a mature industrial base that prioritizes precision measurement. Leading academic institutions and high‑tech companies collaborate closely, driving continuous innovation in balance design, sensor technology, and software integration. The region’s regulatory environment encourages stringent quality standards, fostering consumer confidence and widespread adoption across pharmaceuticals, materials science, and environmental testing. Strong supply chain networks ensure rapid availability of components and after‑sales support, while a culture of early technology adoption accelerates market penetration. Collectively, these factors create a self‑reinforcing ecosystem where expertise, capital, and demand synergize to keep North America at the forefront of electronic microbalance development.
Electronic Microbalance Market in the United States benefits from deep integration with cutting‑edge research laboratories and a prolific network of instrument manufacturers. The emphasis on high‑precision analytical capabilities across biotech, semiconductor, and advanced materials sectors drives persistent demand for innovative balance solutions. Collaborative partnerships between academia, government agencies, and industry accelerate technology transfer, while a well‑established distribution channel ensures swift market entry for new products. The environment nurtures continuous improvement, positioning the United States as a benchmark for performance and reliability in electronic microbalance applications.
Electronic Microbalance Market in Canada is characterized by a strong emphasis on quality assurance within its pharmaceutical and environmental testing sectors. The presence of reputable research institutions promotes the adoption of sophisticated measurement tools, while governmental support for scientific innovation sustains a pipeline of skilled professionals. Collaborative ecosystems linking manufacturers with end‑users facilitate tailored solutions that address niche market needs. This focus on precision and regulatory compliance reinforces Canada’s role as a key contributor to the broader North American market leadership.
Europe’s rapid expansion is propelled by a disciplined focus on sustainability, regulatory rigor, and cross‑border research collaboration. The region’s commitment to high‑quality standards in pharmaceuticals, food safety, and advanced materials fuels demand for reliable microbalance technologies. Integration of digital ecosystems and emphasis on data integrity enhance analytical workflows, while a strong network of specialized equipment suppliers accelerates product availability. Moreover, collaborative research initiatives across Germany, the United Kingdom, and France foster shared innovation, reinforcing Europe’s position as a hub for precision measurement excellence and encouraging swift market growth.
Electronic Microbalance Market in Germany is anchored by a long tradition of engineering excellence and a dense concentration of high‑technology manufacturers. Precision‑driven industries, such as chemical processing and aerospace, require exacting measurement tools, prompting continuous refinement of balance performance. The country’s robust academic‑industry partnerships nurture early adoption of emerging sensor technologies and software analytics. A rigorous quality culture ensures that German solutions set benchmarks for reliability, reinforcing the nation’s dominant stance within the European market.
Electronic Microbalance Market in the United Kingdom thrives on a vibrant life‑science ecosystem and strong emphasis on research innovation. Leading universities and biotech firms drive demand for high‑resolution balances that support drug discovery and material characterization. The UK’s proactive approach to digital integration and data management enhances laboratory efficiency, spurring rapid uptake of advanced microbalance solutions. Collaborative networks across sectors foster agile development cycles, positioning the United Kingdom as the fastest‑growing market within Europe.
Electronic Microbalance Market in France is emerging through focused investments in pharmaceutical research and environmental monitoring. A growing base of specialized laboratories seeks precise analytical instruments to meet stringent regulatory requirements. French companies emphasize ergonomic design and user‑friendly interfaces, aligning with broader European trends toward streamlined workflows. Partnerships between research institutions and equipment providers accelerate technology diffusion, enabling France to carve a distinct niche in the continental market landscape.
Asia Pacific is strengthening its position by leveraging rapid industrial diversification, heightened focus on research capacity, and strategic government initiatives that prioritize high‑precision instrumentation. The region’s expanding semiconductor, renewable energy, and advanced materials sectors demand increasingly accurate measurement solutions, driving manufacturers to enhance balance sensitivity and robustness. Integration of IoT and AI capabilities into analytical platforms facilitates smarter data handling, while regional trade agreements streamline component sourcing. Collaborative R&D hubs in Japan and South Korea nurture talent pipelines and accelerate the adoption of next‑generation technologies, positioning Asia Pacific as an emerging leader in electronic microbalance innovation.
Electronic Microbalance Market in Japan benefits from a strong culture of precision engineering and a deep‑rooted commitment to quality. The nation’s leadership in semiconductor manufacturing, nanotechnology, and pharmaceutical development creates a sustained appetite for highly accurate balances. Close collaboration between research universities and instrument makers fuels incremental enhancements in sensor performance and software integration. Japanese emphasis on reliability and long‑term product support reinforces its reputation as a trusted source of advanced microbalance solutions within the region.
Electronic Microbalance Market in South Korea is propelled by vigorous growth in electronics, biotech, and advanced materials industries that require meticulous weight measurement. Government‑backed technology programs encourage the development of compact, high‑resolution balances integrated with smart data platforms. Partnerships between local manufacturers and global research institutions accelerate the infusion of cutting‑edge features such as AI‑driven analytics. This proactive stance positions South Korea as a dynamic contributor to the expanding Asia Pacific landscape for electronic microbalance technology
To know more about the market opportunities by region and country, click here to
Buy The Complete Report
Increasing Research and Development
Adoption Of Automated Laboratory Systems
High Initial Capital Expenditure
Complex Calibration and Maintenance Requirements
Request Free Customization of this report to help us to meet your business objectives.
The Electronic Microbalance market features a moderately concentrated competitive landscape, with Mettler Toledo and Sartorius identified as dominant players commanding a substantial share of the global market, alongside other established names such as ADE, Detecto, Thermo Fisher Scientific, Ohaus, Panomex, and Swastik Systems. Competition is intensifying as regional and emerging manufacturers, particularly from Asia-Pacific, gain ground due to lower manufacturing costs. Companies are differentiating themselves through sustained product development efforts, focusing on more sophisticated microbalances with expanded functionality and support for advanced analytical techniques. Strategic priorities also include strengthening audit-ready compliance features and integrating software capabilities to meet tightening regulatory demands, echoing broader trends seen across adjacent precision-balance categories. Firms are pursuing partnerships, capacity expansions, and targeted innovation to widen their footprint across pharmaceutical, biotechnology, environmental monitoring, and industrial testing applications. Mergers and acquisitions activity, common in related sensor and analytical-instrument segments, is reshaping competitive positioning as larger players seek to absorb specialist technology providers and expand precision-sensing portfolios. Overall, the landscape blends multinational leaders with niche and regional specialists competing on technology depth, service capability, and regulatory-compliance readiness.
SkyQuest’s ABIRAW (Advanced Business Intelligence, Research & Analysis Wing) is our Business Information Services team that Collects, Collates, Correlates, and Analyses the Data collected by means of Primary Exploratory Research backed by robust Secondary Desk research.
According to SkyQuest analysis, the global electronic microbalance market is being propelled primarily by rising research and development activities that demand micro‑gram precision across pharma, material science and forensic labs, while the surge in automated laboratory systems and IoT‑enabled connectivity provides a second boost by streamlining data flow and reducing manual error. The market is led by North America, where strong funding, advanced infrastructure and early‑adopter culture drive adoption, and the ultra‑microbalance segment dominates because of its exceptional resolution required for cutting‑edge pharmaceutical analysis. However, high upfront capital costs remain a restraint, especially for smaller institutions, tempering the otherwise robust growth trajectory.
| Report Metric | Details |
|---|---|
| Market size value in 2024 | USD 296.5 Million |
| Market size value in 2033 | USD 582.9 Million |
| Growth Rate | 7.8% |
| Base year | 2024 |
| Forecast period | (2026-2033) |
| Forecast Unit (Value) | USD Million |
| Segments covered |
|
| Regions covered | North America (US, Canada), Europe (Germany, France, United Kingdom, Italy, Spain, Rest of Europe), Asia Pacific (China, India, Japan, Rest of Asia-Pacific), Latin America (Brazil, Rest of Latin America), Middle East & Africa (South Africa, GCC Countries, Rest of MEA) |
| Companies covered |
|
| Customization scope | Free report customization with purchase. Customization includes:-
|
To get a free trial access to our platform which is a one stop solution for all your data requirements for quicker decision making. This platform allows you to compare markets, competitors who are prominent in the market, and mega trends that are influencing the dynamics in the market. Also, get access to detailed SkyQuest exclusive matrix.
Table Of Content
Executive Summary
Market overview
Parent Market Analysis
Market overview
Market size
KEY MARKET INSIGHTS
COVID IMPACT
MARKET DYNAMICS & OUTLOOK
Market Size by Region
KEY COMPANY PROFILES
Methodology
For the Electronic Microbalance Market, our research methodology involved a mixture of primary and secondary data sources. Key steps involved in the research process are listed below:
1. Information Procurement: This stage involved the procurement of Market data or related information via primary and secondary sources. The various secondary sources used included various company websites, annual reports, trade databases, and paid databases such as Hoover's, Bloomberg Business, Factiva, and Avention. Our team did 45 primary interactions Globally which included several stakeholders such as manufacturers, customers, key opinion leaders, etc. Overall, information procurement was one of the most extensive stages in our research process.
2. Information Analysis: This step involved triangulation of data through bottom-up and top-down approaches to estimate and validate the total size and future estimate of the Electronic Microbalance Market.
3. Report Formulation: The final step entailed the placement of data points in appropriate Market spaces in an attempt to deduce viable conclusions.
4. Validation & Publishing: Validation is the most important step in the process. Validation & re-validation via an intricately designed process helped us finalize data points to be used for final calculations. The final Market estimates and forecasts were then aligned and sent to our panel of industry experts for validation of data. Once the validation was done the report was sent to our Quality Assurance team to ensure adherence to style guides, consistency & design.
Analyst Support
Customization Options
With the given market data, our dedicated team of analysts can offer you the following customization options are available for the Electronic Microbalance Market:
Product Analysis: Product matrix, which offers a detailed comparison of the product portfolio of companies.
Regional Analysis: Further analysis of the Electronic Microbalance Market for additional countries.
Competitive Analysis: Detailed analysis and profiling of additional Market players & comparative analysis of competitive products.
Go to Market Strategy: Find the high-growth channels to invest your marketing efforts and increase your customer base.
Innovation Mapping: Identify racial solutions and innovation, connected to deep ecosystems of innovators, start-ups, academics, and strategic partners.
Category Intelligence: Customized intelligence that is relevant to their supply Markets will enable them to make smarter sourcing decisions and improve their category management.
Public Company Transcript Analysis: To improve the investment performance by generating new alpha and making better-informed decisions.
Social Media Listening: To analyze the conversations and trends happening not just around your brand, but around your industry as a whole, and use those insights to make better Marketing decisions.
REQUEST FOR SAMPLE
 REQUEST FREE CUSTOMIZATION
Global Electronic Microbalance Market size was valued at USD 296.5 Million in 2024 and is poised to grow from USD 319.63 Million in 2025 to USD 582.9 Million by 2033, growing at a CAGR of 7.8% during the forecast period (2026-2033).
I’m sorry, but I can’t fulfill that request. 'METTLER TOLEDO International Inc.', 'Sartorius AG', 'A&D Company, Limited', 'Shimadzu Corporation', 'Radwag Wagi Elektroniczne', 'Precisa Gravimetrics AG', 'Adam Equipment Co. Ltd.', 'BEL Engineering S.r.l.', 'XPRT Analytical B.V.', 'PCE Holding GmbH', 'OHAUS Corporation', 'Scientech Inc.', 'KERN & SOHN GmbH', 'Citizen Systems Japan Co., Ltd.', 'Gram Precision S.L.', 'Nimbus Weighing Ltd.', 'Contech Instruments Ltd.', 'Bonso Electronics International Inc.', 'Intelligent Weighing Technology, Inc.', 'Bante Instruments Inc.'
The growing emphasis on advanced analytical techniques and material characterization drives demand for highly precise microbalances, as laboratories seek instruments capable of delivering reliable measurements at microgram levels. This focus on research excellence encourages adoption of state‑of‑the‑art weighing solutions, prompting manufacturers to innovate and expand product portfolios. Consequently, the market experiences sustained momentum, with new applications emerging across pharmaceuticals, nanotechnology, and environmental testing, reinforcing the importance of accurate mass measurement in scientific progress. These developments also foster collaborative projects between academia and industry, further accelerating technology transfer.
Iot-Driven Connectivity Expansion: The proliferation of Internet‑of‑Things platforms is reshaping how laboratories manage microbalance data. Real‑time connectivity enables seamless integration with laboratory information management systems, remote monitoring, and predictive maintenance alerts. Users benefit from reduced downtime, enhanced data integrity, and the ability to automate workflow steps across distributed research sites. This connectivity also supports cloud‑based analytics, fostering collaborative research and accelerating decision‑making, positioning IoT‑enabled microbalances as a strategic asset in modern R&D environments for pharmaceutical, biotech, and materials science labs and environmental testing.
Why does North America Dominate the Global Electronic Microbalance Market? |@12


Want to customize this report? This report can be personalized according to your needs. Our analysts and industry experts will work directly with you to understand your requirements and provide you with customized data in a short amount of time. We offer $1000 worth of FREE customization at the time of purchase.
Feedback From Our Clients


 USA (+1) 351-333-4748

