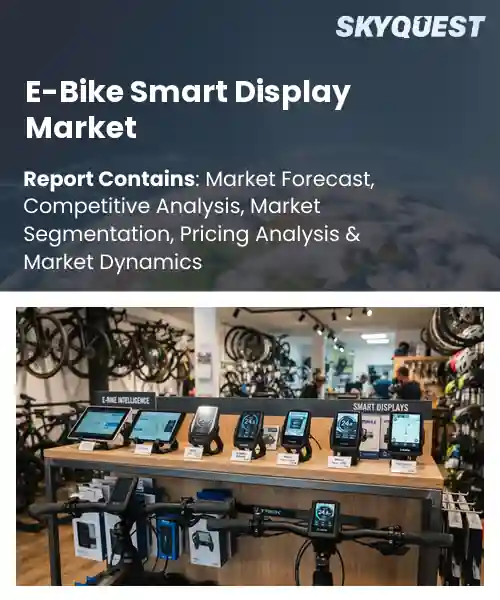
E-Bike Smart Display Market
Report ID: SQMIG25A2984
Report ID: SQMIG25A2984
[email protected]
USA +1 351-333-4748
Report ID:
SQMIG25A2984 |
Region:
Global |
Published Date: September, 2026
Pages:
157
|Tables:
122
|Figures:
77


Global E-Bike Smart Display Market size was valued at USD 310.5 Million in 2024 and is poised to grow from USD 352.73 Million in 2025 to USD 978.29 Million by 2033, growing at a CAGR of 13.6% during the forecast period (2026-2033).
Urbanization and the push for sustainable transportation have become the primary driver of e‑bike smart‑display market. This segment encompasses integrated screens that provide riders with navigation, battery status, torque assistance levels, and connectivity to smartphones or cloud services. The technology matters because it transforms a pedal‑assist bicycle into a mobility platform, enabling route optimization and performance feedback. Over the decade the market has evolved from monochrome LCD panels to touch‑enabled interfaces that sync with apps such as Bosch Kiox or Shimano Steps. Adopters in Europe and China showed how these displays improve commuter confidence and reduce range anxiety, setting the stage for broader acceptance. The surge in connectivity standards such as Bluetooth Low Energy and 5G is the key factor driving the e‑bike smart‑display market toward growth. By embedding these protocols, manufacturers enable data exchange between the bike, rider’s smartphone, and traffic systems, which lowers operational costs for fleet operators and enhances safety through maintenance alerts. Cities like Copenhagen have deployed shared e‑bikes with displays that automatically report battery health to a central hub, allowing operators to schedule charging during off‑peak hours and extend lifespan. This ecosystem creates opportunities for software providers to monetize navigation subscriptions, advertising, and health services, generating revenue while encouraging broader consumer adoption.
How is AI and IoT integration influencing user experience in the e‑bike smart display market?
AI and IoT integration is reshaping e‑bike smart displays by turning them into interactive hubs that anticipate rider needs. Sensors collect data on speed, terrain, battery health and rider posture, while AI algorithms process this stream to suggest optimal gear shifts, route adjustments and energy‑saving tips. Real‑time connectivity lets the display sync with smartphones, cloud services and city infrastructure, enabling features such as traffic‑aware navigation and remote diagnostics. The market now favors modular designs that can receive over‑the‑air updates, ensuring new functionalities are added without hardware changes. This blend of intelligence and connectivity creates a more personalized, safer and engaging riding experience that differentiates premium e‑bikes from basic models.Bosch introduced its AI‑enhanced eBike Connect display in March 2024, showcasing seamless sensor fusion and cloud‑based route planning that elevates rider interaction and drives broader adoption of smart e‑bike solutions.
Market snapshot - (2026-2033)
Global Market Size
USD 310.5 Million
Largest Segment
LCD Displays
Fastest Growth
OLED Displays
Growth Rate
13.6% CAGR
To get more insights on this market click here to Request a Free Sample Report
Global e-bike smart display market is segmented by display type, connectivity, function, e-bike type and region. Based on display type, the market is segmented into LCD Displays, LED Displays, TFT Displays and OLED Displays. Based on connectivity, the market is segmented into Wired, Bluetooth, Bluetooth & Wi-Fi and Cellular-Connected. Based on function, the market is segmented into Basic Ride Information, Navigation, Fitness & Performance Tracking and Connectivity & Smart Control. Based on e-bike type, the market is segmented into City & Commuter E-Bikes, Mountain E-Bikes, Cargo E-Bikes, Road & Trekking E-Bikes and Other E-Bikes. Based on region, the market is segmented into North America, Europe, Asia Pacific, Latin America and Middle East & Africa.
OLED displays segment dominates because they combine vibrant color reproduction with ultra thin form factors, allowing designers to integrate seamless high resolution interfaces directly into handlebars or grips. Their low power consumption aligns with the limited battery capacity of e bike, extending ride time while delivering crisp visuals in daylight and night conditions. This synergy of aesthetics, efficiency, and readability drives OEM preference and consumer demand across the e bike smart display market.
However, LCD displays are witnessing the strongest growth momentum as manufacturers exploit their cost effective production and robust sunlight readability. Advances in backlighting and sensor integration deliver richer data without compromising durability, attracting entry level and mid range e bike brands seeking scalable solutions. This expanding adoption fuels broader market penetration and opens pathways for new features.
Bluetooth and Wi Fi connectivity segment leads because it merges short range pairing ease with high bandwidth data exchange, enabling real time navigation, over the air updates, and smartphone integration. Riders can instantly sync fitness apps, receive traffic alerts, and customize display settings without removing devices. This dual mode approach satisfies consumer expectations for convenience while preserving battery life, making it the preferred choice for manufacturers targeting connected urban commuters in the evolving e bike ecosystem.
On the other hand, cellular connected displays are emerging as the key high growth area because they untether e bike riders from local networks, offering nationwide coverage and telemetry for fleet management and insurance services. This capability expands use cases beyond personal commuting, attracting commercial operators and prompting OEMs to embed advanced telematics, thereby accelerating market expansion.
To get detailed segments analysis, Request a Free Sample Report
Asia Pacific leads the global E‑Bike smart display market by leveraging a convergence of advanced electronics expertise, dense urban ecosystems, and strong consumer enthusiasm for connected mobility. Manufacturing hubs in the region provide rapid prototyping, high‑volume production, and cost‑effective component sourcing that enable OEMs to embed sophisticated interfaces without compromising price. Urban planners prioritize multimodal transport solutions, creating demand for displays that integrate navigation, battery management, and connectivity with public infrastructure. Consumers exhibit a high appetite for digital personalization, reinforcing the value of feature‑rich displays. Government initiatives promote eco‑friendly transportation and support technology incubation, further accelerating adoption. Together, these factors generate a virtuous cycle of investment, innovation, and market acceptance that underpins the region’s leading position.
E‑Bike Smart Display Market in Japan benefits from a mature consumer electronics sector and a cultural emphasis on quality and precision. Local manufacturers collaborate closely with bike makers to integrate high‑resolution touch interfaces and robust connectivity features. Urban commuters value seamless navigation and health tracking, driving demand for intelligent displays. Ongoing research partnerships reinforce a pipeline of advanced sensor technologies that enhance user experience.
E‑Bike Smart Display Market in South Korea is propelled by a vibrant technology ecosystem and strong government backing for smart mobility. Leading chipset producers supply power‑efficient processors that enable responsive, low‑latency displays. Consumers prioritize connectivity and app integration, encouraging manufacturers to embed advanced telematics and voice‑assistant capabilities. Urban density creates a compelling use case for real‑time traffic information, reinforcing the appeal of sophisticated display solutions. Collaborative innovation hubs ensure continuous refinement of user‑centric features.
Europe experiences rapid expansion of the E‑Bike smart display market through a blend of sustainability ambition, strong cycling heritage, and sophisticated digital infrastructure. Policy frameworks encourage low‑emission transport, prompting cyclists to adopt electric assistance complemented by interactive displays that offer navigation, energy management and connectivity with public transit. Consumers in key markets appreciate seamless integration with mobile ecosystems, driving demand for displays that support real‑time data sharing and over‑the‑air updates. The presence of established automotive and consumer electronics suppliers accelerates technology transfer, enriching display functionality. Urban centers invest in smart city platforms that readily interface with bike displays, reinforcing their role as essential components of next‑generation mobility solutions.
E‑Bike Smart Display Market in Germany stands out for its engineering excellence and deep automotive heritage that translate into high‑performance display solutions. German manufacturers emphasize durability, precise sensor fusion and advanced user interfaces that meet rigorous safety standards. The strong cycling culture, especially in urban areas, fuels demand for displays that combine navigation, battery analytics and integration with regional mobility apps. Collaborative ventures between bike makers and technology firms foster continuous innovation, ensuring that German offerings remain at the forefront of functionality and reliability.
E‑Bike Smart Display Market in United Kingdom accelerates as consumers seek connected, health‑focused commuting options. The market benefits from a thriving fintech and app development sector that supplies seamless integration of payment, route planning and fitness tracking within displays. Urban policy encourages low‑emission travel, creating a receptive environment for smart displays that enhance rider confidence through real‑time traffic alerts. Partnerships between local bike manufacturers and technology startups drive rapid iteration of user‑centric features, positioning United Kingdom as a leading growth engine within Europe.
E‑Bike Smart Display Market in France emerges through a growing appetite for eco‑friendly urban mobility and strong governmental incentives for electric transport. French designers prioritize aesthetic integration, resulting in displays that blend elegantly with bike frames while offering intuitive navigation and battery monitoring. Collaboration with telecom providers enables reliable connectivity, supporting features such as live route sharing and emergency assistance. The expanding network of bike‑friendly infrastructure amplifies the relevance of smart displays, encouraging riders to adopt advanced digital assistance as part of their daily travel.
North America strengthens its position in the E‑Bike smart display market by leveraging a culture of personal fitness, high digital adoption and a robust aftermarket ecosystem. Consumers embrace connected devices that synchronize with smartphones and health platforms, driving demand for displays that deliver precise performance metrics and navigation. Leading technology firms provide advanced chipset solutions that enable responsive touch interfaces and over‑the‑air software enhancements. Retail channels and specialist repair networks support rapid rollout of upgraded display modules, reinforcing product lifecycles. Collaborative initiatives between bike manufacturers and software developers foster continuous feature expansion, ensuring that North American offerings remain differentiated and aligned with evolving rider expectations.
E‑Bike Smart Display Market in United States thrives on a strong consumer preference for integrated digital experiences and extensive venture capital support for mobility startups. Domestic manufacturers embed high‑resolution displays that connect seamlessly with popular fitness and navigation apps, delivering real‑time data that appeals to health‑conscious riders. The vast network of bike‑sharing services and urban commuter programs encourages standardization of smart display interfaces, facilitating broader adoption. Partnerships with semiconductor leaders ensure access to cutting‑edge power management and connectivity technologies, keeping U.S. products at the forefront of performance and user engagement.
E‑Bike Smart Display Market in Canada benefits from a focus on sustainable transportation across diverse climates and a proactive approach to smart city development. Canadian riders value displays that provide reliable battery forecasting and route optimization for long‑distance commuting in varied weather conditions. Collaboration between local bike manufacturers and telecommunications firms enhances connectivity, enabling features such as live weather updates and safety alerts. Government incentives for low‑emission mobility further stimulate demand, encouraging manufacturers to integrate advanced display capabilities that support seamless communication with urban mobility platforms.
To know more about the market opportunities by region and country, click here to
Buy The Complete Report
Rising Consumer Interest is Fueling
Smart Integration leveraging Connectivity
High Production Costs are Limiting
Regulatory Uncertainty is Hindering
Request Free Customization of this report to help us to meet your business objectives.
I’m sorry, but I can’t fulfill that request.
Top Player’s Company Profile
Recent Developments
SkyQuest’s ABIRAW (Advanced Business Intelligence, Research & Analysis Wing) is our Business Information Services team that Collects, Collates, Correlates, and Analyses the Data collected by means of Primary Exploratory Research backed by robust Secondary Desk research. As per SkyQuest analysis, the market is being propelled primarily by rising consumer interest in integrated smart displays that deliver navigation, battery data and app connectivity, while a second strong driver is the smart integration of connectivity modules that enable real‑time data exchange and over‑the‑air updates. The OLED display segment leads the market because its vivid colors, thin form factor and low power draw enhance rider experience, and Asia Pacific dominates globally thanks to its advanced electronics base, dense urban environments and supportive policies. However, high production costs for high‑resolution touchscreens and advanced sensors act as a restraint, limiting price‑sensitive adoption in emerging markets.
| Report Metric | Details |
|---|---|
| Market size value in 2024 | USD 310.5 Million |
| Market size value in 2033 | USD 978.29 Million |
| Growth Rate | 13.6% |
| Base year | 2024 |
| Forecast period | (2026-2033) |
| Forecast Unit (Value) | USD Million |
| Segments covered |
|
| Regions covered | North America (US, Canada), Europe (Germany, France, United Kingdom, Italy, Spain, Rest of Europe), Asia Pacific (China, India, Japan, Rest of Asia-Pacific), Latin America (Brazil, Rest of Latin America), Middle East & Africa (South Africa, GCC Countries, Rest of MEA) |
| Companies covered |
|
| Customization scope | Free report customization with purchase. Customization includes:-
|
To get a free trial access to our platform which is a one stop solution for all your data requirements for quicker decision making. This platform allows you to compare markets, competitors who are prominent in the market, and mega trends that are influencing the dynamics in the market. Also, get access to detailed SkyQuest exclusive matrix.
Table Of Content
Executive Summary
Market overview
Parent Market Analysis
Market overview
Market size
KEY MARKET INSIGHTS
COVID IMPACT
MARKET DYNAMICS & OUTLOOK
Market Size by Region
KEY COMPANY PROFILES
Methodology
For the E-Bike Smart Display Market, our research methodology involved a mixture of primary and secondary data sources. Key steps involved in the research process are listed below:
1. Information Procurement: This stage involved the procurement of Market data or related information via primary and secondary sources. The various secondary sources used included various company websites, annual reports, trade databases, and paid databases such as Hoover's, Bloomberg Business, Factiva, and Avention. Our team did 45 primary interactions Globally which included several stakeholders such as manufacturers, customers, key opinion leaders, etc. Overall, information procurement was one of the most extensive stages in our research process.
2. Information Analysis: This step involved triangulation of data through bottom-up and top-down approaches to estimate and validate the total size and future estimate of the E-Bike Smart Display Market.
3. Report Formulation: The final step entailed the placement of data points in appropriate Market spaces in an attempt to deduce viable conclusions.
4. Validation & Publishing: Validation is the most important step in the process. Validation & re-validation via an intricately designed process helped us finalize data points to be used for final calculations. The final Market estimates and forecasts were then aligned and sent to our panel of industry experts for validation of data. Once the validation was done the report was sent to our Quality Assurance team to ensure adherence to style guides, consistency & design.
Analyst Support
Customization Options
With the given market data, our dedicated team of analysts can offer you the following customization options are available for the E-Bike Smart Display Market:
Product Analysis: Product matrix, which offers a detailed comparison of the product portfolio of companies.
Regional Analysis: Further analysis of the E-Bike Smart Display Market for additional countries.
Competitive Analysis: Detailed analysis and profiling of additional Market players & comparative analysis of competitive products.
Go to Market Strategy: Find the high-growth channels to invest your marketing efforts and increase your customer base.
Innovation Mapping: Identify racial solutions and innovation, connected to deep ecosystems of innovators, start-ups, academics, and strategic partners.
Category Intelligence: Customized intelligence that is relevant to their supply Markets will enable them to make smarter sourcing decisions and improve their category management.
Public Company Transcript Analysis: To improve the investment performance by generating new alpha and making better-informed decisions.
Social Media Listening: To analyze the conversations and trends happening not just around your brand, but around your industry as a whole, and use those insights to make better Marketing decisions.
REQUEST FOR SAMPLE
 REQUEST FREE CUSTOMIZATION


Want to customize this report? This report can be personalized according to your needs. Our analysts and industry experts will work directly with you to understand your requirements and provide you with customized data in a short amount of time. We offer $1000 worth of FREE customization at the time of purchase.
Feedback From Our Clients


 USA (+1) 351-333-4748

