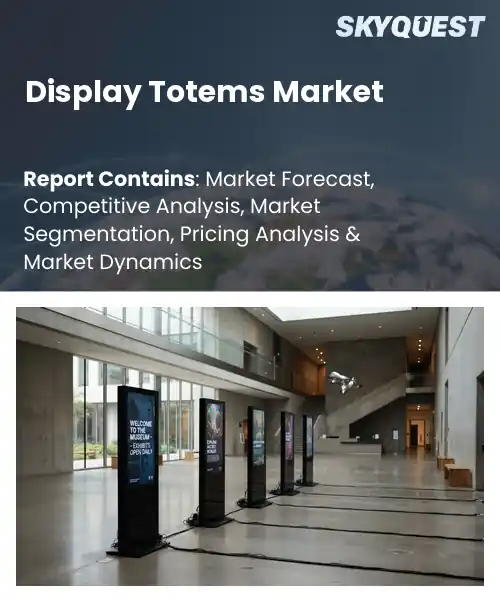
Display Totems Market
Report ID: SQMIG45I2551
Report ID: SQMIG45I2551
[email protected]
USA +1 351-333-4748
Report ID:
SQMIG45I2551 |
Region:
Global |
Published Date: November, 2026
Pages:
157
|Tables:
120
|Figures:
77


Global Display Totems Market size was valued at USD 2.65 Billion in 2024 and is poised to grow from USD 2.83 Billion in 2025 to USD 4.8 Billion by 2033, growing at a CAGR of 6.8% during the forecast period (2026-2033).
The global display totems market comprises signage kiosks used in retail, transportation, and public venues to convey information, advertise products, and enhance user engagement. Its importance stems from the shift toward contactless experiences and data‑driven marketing, which demand real‑time visual displays. Historically, the market evolved from static billboards to LCD kiosks in the early 2000s, then to LED and touchscreen solutions after 2015, exemplified by Samsung and LG installing totems in subway stations across Asia. This progression has accelerated as enterprises recognize that digital visual interfaces boost foot traffic and enable audience analytics, positioning display totems as a cornerstone of omnichannel strategies. Among the drivers shaping the display totems market, the integration of analytics and AI audience measurement stands out as the pivotal growth catalyst. By embedding sensors that track dwell time, facial demographics, and interaction patterns, retailers can instantly adapt content to match shopper intent, causing higher conversion rates and justifying premium pricing. For instance, an airport recently deployed AI‑enabled totems that display flight updates and retail offers, resulting in a 23 % lift in ancillary sales within three months. This cause‑and‑effect loop data collection prompting content creates a virtuous cycle that attracts advertisers seeking measurable ROI, thereby expanding deployment across hospitality, education, and healthcare sectors.
How is AI enhancing interactivity in the global display totems market?
AI is reshaping interactive display totems by embedding real‑time analytics, voice recognition and gesture control directly into the screens. Manufacturers now pair high‑resolution panels with edge‑AI chips that process user inputs locally, eliminating latency and preserving privacy. Content management platforms use computer‑vision algorithms to detect foot traffic patterns and adapt advertisements or way‑finding cues on the fly, making each encounter feel personalized. Retailers and transport hubs benefit from dynamic queues that display wait‑time estimates and offer touch‑free navigation, while advertisers gain richer engagement metrics. The convergence of AI with 5G connectivity further expands possibilities, allowing totems to stream live data feeds, support multilingual interactions and integrate with IoT sensors for context‑aware experiences.In March 2024 Samsung introduced its AI‑driven Smart Totem series, which combines on‑device facial recognition and natural‑language processing to deliver tailored content, boosting both visitor engagement and operational efficiency.
Market snapshot - (2026-2033)
Global Market Size
USD 2.65 Billion
Largest Segment
Digital Display Totems
Fastest Growth
Interactive Display Totems
Growth Rate
6.8% CAGR
To get more insights on this market click here to Request a Free Sample Report
Global display totems market is segmented by display type, display technology, application, end user and region. Based on display type, the market is segmented into Digital Display Totems, Static Display Totems and Interactive Display Totems. Based on display technology, the market is segmented into LCD, LED and OLED. Based on application, the market is segmented into Retail & Shopping Centers, Transportation Hubs, Hospitality & Tourism, Corporate & Public Spaces and Events & Exhibitions. Based on end user, the market is segmented into Retailers, Advertising Agencies, Corporate Organizations and Public Institutions. Based on region, the market is segmented into North America, Europe, Asia Pacific, Latin America and Middle East & Africa.
LED segment dominates because it delivers high brightness and energy efficiency, which align with the visual impact demands of modern totems. Its long lifespan reduces maintenance cycles, making it cost effective for owners seeking reliable signage. The technology’s scalability supports diverse form factors, from compact units to large pillars, enabling broader deployment across various venues. Consequently, advertisers prioritize LED for consistent performance and brand visibility throughout the entire customer journey today.
Meanwhile, OLED segment is witnessing the strongest growth momentum as its superior contrast and flexible form factor enable immersive experiences on totem surfaces. Designers leverage its thin profile to create sleek interactive installations, attracting premium brands seeking differentiation. This innovation fuels demand and expands market opportunities for high impact storytelling.
Retail & Shopping Centers segment dominates because totems placed in high traffic retail environments drive immediate consumer engagement and impulse purchasing. Brands value the ability to showcase dynamic content that syncs with in store promotions, enhancing the shopper journey. The constant footfall provides measurable exposure, justifying investment in eye catching displays. Consequently, retailers prioritize totem deployments to reinforce branding, guide navigation, and boost sales conversions within bustling commercial spaces today.
On the other hand, Events & Exhibitions segment is emerging as the key high growth area as organizers seek memorable visual experiences to attract attendees. Totems with setup enable branding and content updates, matching the paced nature of events. This demand drives investment and opens avenues for innovative display solutions.
To get detailed segments analysis, Request a Free Sample Report
Asia Pacific leads the market through a combination of advanced manufacturing ecosystems, strong technology adoption, and vibrant retail environments. The region benefits from a dense network of original equipment manufacturers that provide cost‑effective yet high‑quality hardware, while local innovators drive software integration and interactive capabilities. Consumer expectations for immersive experiences are especially high in urban centers, prompting brands to invest heavily in digital wayfinding and advertising solutions. Supportive government policies encouraging smart city initiatives further accelerate deployment, creating a feedback loop that reinforces the region’s leadership in design, production, and implementation of display totems.
Japan Display Totems Market
Display Totems Market in Japan is shaped by a culture that values precision engineering and seamless user experiences. Leading electronics firms collaborate with advertising agencies to deliver highly interactive installations in transport hubs and commercial complexes. The emphasis on aesthetic integration ensures that totems complement sophisticated architectural designs, while strong consumer acceptance of cashless and contactless technologies drives continual upgrades.
South Korea Display Totems Market
Display Totems Market in South Korea flourishes under a dynamic digital ecosystem where fast broadband and mobile penetration enable rich, real‑time content. Major conglomerates invest in smart retail concepts, embedding totems with AI‑driven analytics to personalize messaging. Government initiatives promoting smart city infrastructure further incentivize deployment in public spaces, while a consumer base enthusiastic about cutting‑edge visual interfaces sustains rapid product evolution.
Europe’s expansion is propelled by a convergence of sustainability goals, high retail density, and a regulatory environment that encourages digital transformation. Brands are increasingly seeking interactive touchpoints that reduce paper waste and enhance shopper engagement, aligning with broader environmental commitments. The region’s mature advertising sector leverages sophisticated data analytics to optimize content across multiple languages and cultural contexts. Additionally, strong emphasis on accessibility and inclusive design drives the adoption of totems in public transport and tourism venues, while cross‑border collaboration among technology providers accelerates innovation and standardization throughout the market.
Germany Display Totems Market
Display Totems Market in Germany benefits from a strong engineering heritage and a focus on precision manufacturing. Leading firms integrate robust hardware with modular software platforms, catering to industrial, retail, and transportation sectors. The market is further energized by sustainability initiatives that favor energy‑efficient solutions, positioning German totems as benchmarks for reliability and environmental performance.
United Kingdom Display Totems Market
Display Totems Market in United Kingdom experiences rapid growth fueled by a vibrant creative industry and a surge in experiential retail concepts. Brands capitalize on high foot‑traffic zones such as city centres and transport stations, deploying totems that blend interactive advertising with real‑time data feeds. The regulatory emphasis on digital accessibility encourages inclusive design, while a thriving start‑up ecosystem introduces novel user‑interface technologies that keep the market dynamic.
France Display Totems Market
Display Totems Market in France is emerging as a focal point for tourism and cultural venues seeking immersive visitor experiences. Operators prioritize aesthetically pleasing designs that harmonize with historic environments, while leveraging multilingual content to engage diverse audiences. Government support for smart city pilots and a growing emphasis on contactless information delivery stimulate adoption across urban and regional locations.
North America reinforces its market position through a blend of technological leadership, expansive retail networks, and a culture of innovation that prioritizes personalized consumer interactions. Companies invest heavily in integrating advanced analytics, IoT connectivity, and AI‑driven content management into totem solutions, enabling real‑time adaptation to shopper behavior. The region’s strong venture capital ecosystem fuels start‑ups that experiment with augmented reality and gesture‑based interfaces, while large retail chains adopt scalable deployments to create unified omnichannel experiences. Collaborative partnerships between hardware manufacturers and software developers further enhance interoperability, ensuring that North American deployments set industry standards for functionality and user engagement.
United States Display Totems Market
Display Totems Market in United States thrives on a robust ecosystem of technology providers and major retailers seeking seamless omnichannel integration. Emphasis on data‑driven personalization drives the incorporation of advanced sensors and analytics, while widespread adoption across malls, airports, and stadiums reflects a consumer appetite for interactive wayfinding and advertising experiences.
Canada Display Totems Market
Display Totems Market in Canada reflects a commitment to accessible public information and retail innovation within a geographically diverse landscape. Deployments focus on multilingual content and weather‑resilient hardware to serve both urban centres and remote communities, while collaboration with municipal smart‑city initiatives promotes the use of totems for real‑time transit updates and community engagement.
To know more about the market opportunities by region and country, click here to
Buy The Complete Report
Rising Demand For Interactive Advertising
Expansion Of Smart City Initiatives
High Initial Capital Expenditure
Complex Integration With Legacy Systems
Request Free Customization of this report to help us to meet your business objectives.
The competitive landscape of the global display totems market is shaped by intense rivalry as manufacturers vie for differentiation through advanced interactivity, modular designs, and sustainability. Market drivers include the push for immersive customer experiences and the need for rapid deployment in high‑traffic venues. Recent strategies feature acquisitions of niche software providers, strategic alliances with content platforms, and the rollout of AI‑driven analytics to enhance real‑time engagement.
Top Player’s Company Profile
Recent Developments
SkyQuest’s ABIRAW (Advanced Business Intelligence, Research & Analysis Wing) is our Business Information Services team that Collects, Collates, Correlates, and Analyses the Data collected by means of Primary Exploratory Research backed by robust Secondary Desk research. As per SkyQuest analysis the global display totems market is being propelled primarily by the integration of AI driven analytics that let retailers personalize content in real time, while a second strong driver is the expansion of smart‑city projects that demand networked, energy‑efficient signage for wayfinding and public information. The market is led by the LED display segment because its brightness and low power use deliver the visual impact needed in high‑traffic venues, and Asia Pacific remains the dominant region thanks to its dense manufacturing base and rapid adoption of immersive retail experiences. The main restraint is the high initial capital outlay required for sophisticated hardware and software, which can deter smaller operators.
| Report Metric | Details |
|---|---|
| Market size value in 2024 | USD 2.65 Billion |
| Market size value in 2033 | USD 4.8 Billion |
| Growth Rate | 6.8% |
| Base year | 2024 |
| Forecast period | (2026-2033) |
| Forecast Unit (Value) | USD Billion |
| Segments covered |
|
| Regions covered | North America (US, Canada), Europe (Germany, France, United Kingdom, Italy, Spain, Rest of Europe), Asia Pacific (China, India, Japan, Rest of Asia-Pacific), Latin America (Brazil, Rest of Latin America), Middle East & Africa (South Africa, GCC Countries, Rest of MEA) |
| Companies covered |
|
| Customization scope | Free report customization with purchase. Customization includes:-
|
To get a free trial access to our platform which is a one stop solution for all your data requirements for quicker decision making. This platform allows you to compare markets, competitors who are prominent in the market, and mega trends that are influencing the dynamics in the market. Also, get access to detailed SkyQuest exclusive matrix.
Table Of Content
Executive Summary
Market overview
Parent Market Analysis
Market overview
Market size
KEY MARKET INSIGHTS
COVID IMPACT
MARKET DYNAMICS & OUTLOOK
Market Size by Region
KEY COMPANY PROFILES
Methodology
For the Display Totems Market, our research methodology involved a mixture of primary and secondary data sources. Key steps involved in the research process are listed below:
1. Information Procurement: This stage involved the procurement of Market data or related information via primary and secondary sources. The various secondary sources used included various company websites, annual reports, trade databases, and paid databases such as Hoover's, Bloomberg Business, Factiva, and Avention. Our team did 45 primary interactions Globally which included several stakeholders such as manufacturers, customers, key opinion leaders, etc. Overall, information procurement was one of the most extensive stages in our research process.
2. Information Analysis: This step involved triangulation of data through bottom-up and top-down approaches to estimate and validate the total size and future estimate of the Display Totems Market.
3. Report Formulation: The final step entailed the placement of data points in appropriate Market spaces in an attempt to deduce viable conclusions.
4. Validation & Publishing: Validation is the most important step in the process. Validation & re-validation via an intricately designed process helped us finalize data points to be used for final calculations. The final Market estimates and forecasts were then aligned and sent to our panel of industry experts for validation of data. Once the validation was done the report was sent to our Quality Assurance team to ensure adherence to style guides, consistency & design.
Analyst Support
Customization Options
With the given market data, our dedicated team of analysts can offer you the following customization options are available for the Display Totems Market:
Product Analysis: Product matrix, which offers a detailed comparison of the product portfolio of companies.
Regional Analysis: Further analysis of the Display Totems Market for additional countries.
Competitive Analysis: Detailed analysis and profiling of additional Market players & comparative analysis of competitive products.
Go to Market Strategy: Find the high-growth channels to invest your marketing efforts and increase your customer base.
Innovation Mapping: Identify racial solutions and innovation, connected to deep ecosystems of innovators, start-ups, academics, and strategic partners.
Category Intelligence: Customized intelligence that is relevant to their supply Markets will enable them to make smarter sourcing decisions and improve their category management.
Public Company Transcript Analysis: To improve the investment performance by generating new alpha and making better-informed decisions.
Social Media Listening: To analyze the conversations and trends happening not just around your brand, but around your industry as a whole, and use those insights to make better Marketing decisions.
REQUEST FOR SAMPLE
 REQUEST FREE CUSTOMIZATION


Want to customize this report? This report can be personalized according to your needs. Our analysts and industry experts will work directly with you to understand your requirements and provide you with customized data in a short amount of time. We offer $1000 worth of FREE customization at the time of purchase.
Feedback From Our Clients


 USA (+1) 351-333-4748

