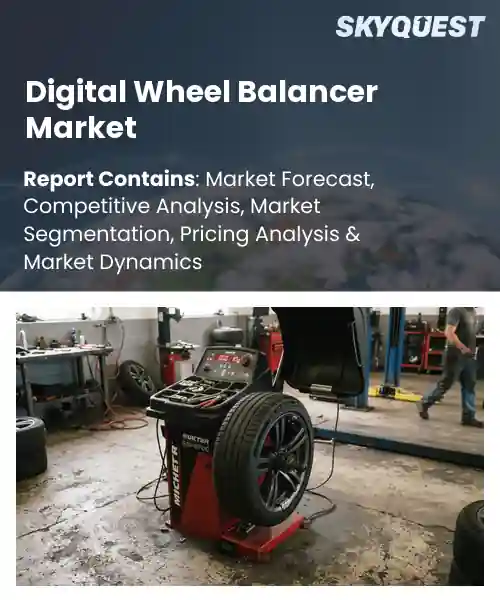
Digital Wheel Balancer Market
Report ID: SQMIG20I3863
Report ID: SQMIG20I3863
[email protected]
USA +1 351-333-4748
Report ID:
SQMIG20I3863 |
Region:
Global |
Published Date: September, 2026
Pages:
157
|Tables:
142
|Figures:
78


Global Digital Wheel Balancer Market size was valued at USD 1.76 Billion in 2024 and is poised to grow from USD 1.86 Billion in 2025 to USD 2.93 Billion by 2033, growing at a CAGR of 5.8% during the forecast period (2026-2033).
The wheel balancer market comprises machinery that uses sensors and software algorithms to correct wheel mass distribution, enhancing vehicle safety and fuel efficiency. Its significance lies in reducing vibration, prolonging tire life, and meeting stricter emissions standards set by regulators worldwide. The primary driver behind expansion is the accelerating adoption of electric vehicles, which demand tighter tolerance due to higher torque and heavier battery packs. Over the past decade, manufacturers such as Bosch and Cope have introduced smart balancing units that integrate with telematics platforms, illustrating a shift from manual to automated maintenance. This evolution creates an environment for innovation. Another pivotal factor shaping the wheel balancer market is the rise of maintenance ecosystems that link balancing data with fleet management software. When sensors record imbalance patterns, analytics platforms forecast tire wear and schedule service before vibrations become hazardous, thereby lowering downtime and warranty claims for operators. For example, a logistics firm in Europe integrated Bosch’s cloud‑based balancer data into its telematics dashboard, achieving a 12 % reduction in unscheduled chassis repairs within six months. This cause‑and‑effect dynamic drives demand for devices, prompts OEMs to open APIs, and creates lucrative opportunities for software providers to monetize data‑driven insights across automotive sectors.
How is AI-driven automation influencing the digital wheel balancer market?
AI driven automation is reshaping the digital wheel balancer market by embedding intelligent algorithms into the core measuring unit. Sensors capture vibration patterns while machine learning models translate the data into precise weight placement recommendations. This reduces manual interpretation, shortens cycle time and improves repeatability. Manufacturers are integrating cloud connectivity to store each balancing history, enabling predictive maintenance of the balancer itself. As workshops demand faster service, AI powered systems deliver consistent results across a range of vehicle types. The trend is supported by tighter emissions regulations that push service centers to adopt more efficient workflow solutions.Hunter Engineering, July 2023, launched an AI enabled digital wheel balancer that automatically calibrates and optimizes balancing cycles, cutting downtime and boosting throughput while preserving accuracy. The system learns from each job, refines its algorithm and integrates with shop management software, helping workshops increase service volume without sacrificing quality.
Market snapshot - (2026-2033)
Global Market Size
USD 1.76 Billion
Largest Segment
Passenger Vehicle Wheel Balancers
Fastest Growth
Motorcycle Wheel Balancers
Growth Rate
5.8% CAGR
To get more insights on this market click here to Request a Free Sample Report
Global digital wheel balancer market is segmented by balancer type, operation, application, end user, mounting type and region. Based on balancer type, the market is segmented into Passenger Vehicle Wheel Balancers, Commercial Vehicle Wheel Balancers and Motorcycle Wheel Balancers. Based on operation, the market is segmented into Semi-Automatic and Fully Automatic. Based on application, the market is segmented into Automotive Workshops, Tire Service Centers and OEM Facilities. Based on end user, the market is segmented into Independent Garages, Dealerships and Fleet Maintenance. Based on mounting type, the market is segmented into Floor Mounted and Bench Mounted. Based on region, the market is segmented into North America, Europe, Asia Pacific, Latin America and Middle East & Africa.
Passenger vehicle wheel balancers segment dominates because they align directly with the largest volume of wheels serviced worldwide, ensuring steady demand for digital balancing solutions. Their compatibility with a wide array of tire sizes and mounting patterns simplifies integration for workshops, prompting manufacturers to prioritize features that cater to these vehicles. Consequently, product development, marketing spend, and supplier partnerships gravitate toward this segment, reinforcing its leadership position within the market.
However, commercial vehicle wheel balancers segment is witnessing the strongest growth momentum as logistics fleets expand and demand higher payload efficiency, driving workshops to adopt digital solutions that can handle larger diameters and heavier rims. This rising need fuels innovation and creates fresh revenue streams, accelerating overall market expansion.
Fully automatic operation segment leads because it eliminates manual calibration steps, delivering precise balance results with minimal operator intervention. This convenience shortens service cycles, allowing shops to process more wheels per hour, which directly improves profitability. Manufacturers therefore embed advanced sensors and AI-driven algorithms, positioning fully automatic units as the preferred choice for efficiency‑driven service environments, thereby cementing their market leadership for both small independents and large dealership chains globally.
On the other hand, semi‑automatic operation segment is emerging as the key high‑growth area because workshops seek affordable digital balancers that still improve accuracy over fully manual tools. Incremental automation lowers entry barriers, prompting broader adoption across smaller facilities and encouraging incremental upgrades, which fuels market expansion and diversifies the user base.
To get detailed segments analysis, Request a Free Sample Report
North America leads the market through a confluence of sophisticated automotive service infrastructure, strong emphasis on precision maintenance, and a culture that embraces cutting‑edge diagnostic tools. Industry players benefit from deep integration with original equipment manufacturers and a well‑established aftermarket network that prioritises vehicle safety and performance. Robust professional training programmes cultivate a skilled technician base adept at leveraging digital balancing solutions. Additionally, regulatory frameworks encourage adherence to stringent tire maintenance standards, reinforcing demand for accurate digital systems. The region’s high vehicle turnover and proactive replacement cycles further sustain adoption, while collaborative innovation ecosystems accelerate product development and customization, cementing North America’s position at the forefront of the digital wheel balancer landscape.
Digital Wheel Balancer Market in the United States thrives on a mature service network that pairs extensive dealer reach with independent shop flexibility. Consumer awareness of tire longevity and safety drives frequent maintenance visits, creating a receptive environment for advanced balancing technology. Strong partnerships between equipment manufacturers and training institutes ensure technicians remain proficient, while regulatory emphasis on road safety bolsters market momentum. Innovation hubs in the nation support continual refinement of digital features, aligning product offerings with evolving service expectations.
Digital Wheel Balancer Market in Canada benefits from a broad geographic spread of service centres that prioritize precision and reliability across diverse climates. Emphasis on vehicle performance under challenging road conditions fuels demand for highly accurate balancing solutions. Collaborative initiatives between automotive associations and technology providers foster knowledge sharing, enhancing technician expertise. Regulatory focus on safety standards reinforces the adoption of digital tools, while the market’s alignment with environmentally conscious practices promotes efficient tire wear management and extended service life.
Europe experiences accelerated expansion through a blend of stringent safety legislation, heightened consumer expectations for ride comfort, and a strong tradition of engineering excellence. Manufacturers and service providers invest heavily in digital integration to meet regulatory demands that stress precise tire maintenance. Collaborative research ecosystems across the continent encourage continuous innovation, delivering feature‑rich solutions tailored to diverse market segments. The presence of well‑established automotive clusters supports seamless supply chain coordination, while professional training networks elevate technician competency. Moreover, a growing emphasis on sustainability encourages efficient tire usage, positioning digital wheel balancers as essential tools for reducing waste and enhancing overall vehicle efficiency throughout the region.
Digital Wheel Balancer Market in Germany is anchored by a dense network of high‑tech workshops that value precision engineering. The market benefits from close ties between equipment producers and automotive manufacturers, fostering co‑development of advanced balancing algorithms. Rigorous safety regulations and a culture of meticulous maintenance drive widespread adoption. Technical training institutions collaborate closely with industry, ensuring a workforce adept at leveraging digital capabilities. Continuous innovation cycles keep German offerings at the forefront of performance and reliability standards.
Digital Wheel Balancer Market in the United Kingdom is propelled by a rapidly evolving service landscape that embraces digital transformation. Strong consumer focus on vehicle handling and safety fuels demand for accurate balancing solutions. Collaborative platforms between trade associations and technology firms accelerate knowledge exchange, enhancing technician skill sets. Regulatory emphasis on road safety further reinforces market uptake, while the competitive nature of the aftermarket encourages service providers to differentiate through advanced digital tools, positioning the United Kingdom as a leading growth engine within Europe.
Digital Wheel Balancer Market in France is emerging through a concerted push towards modernizing automotive service practices. Growing awareness of tire performance benefits drives interest among independent garages and dealer networks alike. Partnerships between equipment manufacturers and technical schools nurture a skilled labor pool capable of deploying sophisticated digital tools. Regulatory initiatives that prioritize tire safety amplify market relevance, while early adopters showcase the operational efficiencies and customer satisfaction gains achievable with precise digital balancing technology.
Asia Pacific advances its position by leveraging rapid urbanization, expanding automotive ownership, and a strong appetite for technology‑enabled services. The region’s diverse market landscape encourages adaptation of digital wheel balancers to varied vehicle types and service models. Investment in skill development programs equips technicians with the expertise required for precision balancing, while close collaboration between local manufacturers and global innovators accelerates product localization. Governmental focus on road safety and vehicle efficiency further stimulates demand, and the competitive nature of the aftermarket drives continual improvement in solution affordability and feature set, reinforcing Asia Pacific’s emerging role as a pivotal growth arena.
Digital Wheel Balancer Market in Japan benefits from a long‑standing dedication to meticulous vehicle care and advanced technology adoption. Service centres integrate digital balancing tools to meet high expectations for ride smoothness and tire longevity. Collaborative initiatives between automotive giants and equipment suppliers drive bespoke solution development, while rigorous training programs ensure technicians maintain exceptional proficiency. Regulatory focus on safety standards amplifies market relevance, positioning Japan as a benchmark for precision and reliability in digital wheel balancing.
Digital Wheel Balancer Market in South Korea thrives on a dynamic automotive service sector that embraces rapid digitalization. Strong consumer demand for optimal driving performance encourages service providers to adopt sophisticated balancing equipment. Synergies between local technology firms and global manufacturers facilitate the introduction of innovative features tailored to regional preferences. Comprehensive technical education programs empower a skilled workforce, while safety‑oriented regulations reinforce the necessity of accurate tire maintenance, cementing South Korea’s growing influence within the Asia Pacific market.
To know more about the market opportunities by region and country, click here to
Buy The Complete Report
Increasing Adoption Of Smart Vehicles
Regulatory Push For Safety Standards
High Initial Capital Investment
Limited Technical Expertise Availability
Request Free Customization of this report to help us to meet your business objectives.
The global digital wheel balancer market is shaped by intense competition as leading OEMs and specialist firms race to integrate advanced sensor technology, AI-driven diagnostics and connected service platforms. Recent M&A activity, such as Bosch’s acquisition of a vibration‑analysis start‑up, and strategic partnerships, like Hunter Engineering’s alliance with a telematics provider to enable remote performance monitoring, illustrate how companies are leveraging technology innovation to differentiate product portfolios and capture service‑oriented revenue streams.
Top Player’s Company Profile
Recent Developments
SkyQuest’s ABIRAW (Advanced Business Intelligence, Research & Analysis Wing) is our Business Information Services team that Collects, Collates, Correlates, and Analyses the Data collected by means of Primary Exploratory Research backed by robust Secondary Desk research. As per SkyQuest analysis the global digital wheel balancer market is being propelled primarily by the rising adoption of smart and electric vehicles which require tighter wheel‑balance tolerance, while a second strong driver is the tightening of safety‑related regulations that push workshops to adopt precise, data‑rich tools. The passenger‑vehicle wheel balancer segment leads the market because it serves the largest volume of wheels worldwide, and North America remains the dominant region thanks to its advanced service infrastructure and stringent compliance standards. However, the high initial capital investment needed for fully automated, AI‑enabled units acts as a restraint, especially for smaller independent garages.
| Report Metric | Details |
|---|---|
| Market size value in 2024 | USD 1.76 Billion |
| Market size value in 2033 | USD 2.93 Billion |
| Growth Rate | 5.8% |
| Base year | 2024 |
| Forecast period | (2026-2033) |
| Forecast Unit (Value) | USD Billion |
| Segments covered |
|
| Regions covered | North America (US, Canada), Europe (Germany, France, United Kingdom, Italy, Spain, Rest of Europe), Asia Pacific (China, India, Japan, Rest of Asia-Pacific), Latin America (Brazil, Rest of Latin America), Middle East & Africa (South Africa, GCC Countries, Rest of MEA) |
| Companies covered |
|
| Customization scope | Free report customization with purchase. Customization includes:-
|
To get a free trial access to our platform which is a one stop solution for all your data requirements for quicker decision making. This platform allows you to compare markets, competitors who are prominent in the market, and mega trends that are influencing the dynamics in the market. Also, get access to detailed SkyQuest exclusive matrix.
Table Of Content
Executive Summary
Market overview
Parent Market Analysis
Market overview
Market size
KEY MARKET INSIGHTS
COVID IMPACT
MARKET DYNAMICS & OUTLOOK
Market Size by Region
KEY COMPANY PROFILES
Methodology
For the Digital Wheel Balancer Market, our research methodology involved a mixture of primary and secondary data sources. Key steps involved in the research process are listed below:
1. Information Procurement: This stage involved the procurement of Market data or related information via primary and secondary sources. The various secondary sources used included various company websites, annual reports, trade databases, and paid databases such as Hoover's, Bloomberg Business, Factiva, and Avention. Our team did 45 primary interactions Globally which included several stakeholders such as manufacturers, customers, key opinion leaders, etc. Overall, information procurement was one of the most extensive stages in our research process.
2. Information Analysis: This step involved triangulation of data through bottom-up and top-down approaches to estimate and validate the total size and future estimate of the Digital Wheel Balancer Market.
3. Report Formulation: The final step entailed the placement of data points in appropriate Market spaces in an attempt to deduce viable conclusions.
4. Validation & Publishing: Validation is the most important step in the process. Validation & re-validation via an intricately designed process helped us finalize data points to be used for final calculations. The final Market estimates and forecasts were then aligned and sent to our panel of industry experts for validation of data. Once the validation was done the report was sent to our Quality Assurance team to ensure adherence to style guides, consistency & design.
Analyst Support
Customization Options
With the given market data, our dedicated team of analysts can offer you the following customization options are available for the Digital Wheel Balancer Market:
Product Analysis: Product matrix, which offers a detailed comparison of the product portfolio of companies.
Regional Analysis: Further analysis of the Digital Wheel Balancer Market for additional countries.
Competitive Analysis: Detailed analysis and profiling of additional Market players & comparative analysis of competitive products.
Go to Market Strategy: Find the high-growth channels to invest your marketing efforts and increase your customer base.
Innovation Mapping: Identify racial solutions and innovation, connected to deep ecosystems of innovators, start-ups, academics, and strategic partners.
Category Intelligence: Customized intelligence that is relevant to their supply Markets will enable them to make smarter sourcing decisions and improve their category management.
Public Company Transcript Analysis: To improve the investment performance by generating new alpha and making better-informed decisions.
Social Media Listening: To analyze the conversations and trends happening not just around your brand, but around your industry as a whole, and use those insights to make better Marketing decisions.
REQUEST FOR SAMPLE
 REQUEST FREE CUSTOMIZATION


Want to customize this report? This report can be personalized according to your needs. Our analysts and industry experts will work directly with you to understand your requirements and provide you with customized data in a short amount of time. We offer $1000 worth of FREE customization at the time of purchase.
Feedback From Our Clients


 USA (+1) 351-333-4748

