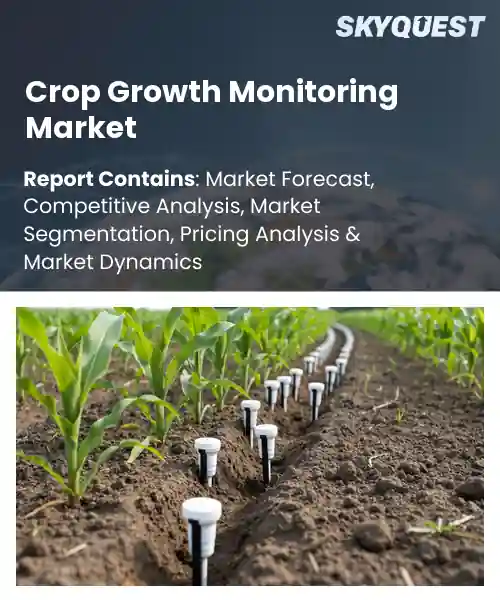
Crop Growth Monitoring Market
Report ID: SQMIG45E3088
Report ID: SQMIG45E3088
[email protected]
USA +1 351-333-4748
Report ID:
SQMIG45E3088 |
Region:
Global |
Published Date: July, 2026
Pages:
157
|Tables:
146
|Figures:
78


Global Crop Growth Monitoring Market size was valued at USD 4.28 Billion in 2024 and is poised to grow from USD 4.82 Billion in 2025 to USD 12.45 Billion by 2033, growing at a CAGR of 12.6% during the forecast period (2026-2033).
The global crop growth monitoring market comprises technologies and services that collect, analyze, and visualize data on plant development to enhance agricultural productivity. Its importance stems from rising food demand, climate variability, and the need for resource efficiency. Historically, the market evolved from manual field scouting to satellite imaging in the early 2000s, and later incorporated unmanned aerial vehicles and IoT sensors that provide real‑time canopy metrics. For example, Brazil’s large‑scale soy producers adopted multispectral drones in 2017, reducing nitrogen use by 15 %. This progression illustrates how digital tools have become essential for managing yields and sustainability in modern agriculture. Adoption of sensor networks represents the key catalyst driving the phase of market expansion, because they translate environmental signals into actionable insights that directly boost farm profitability. When soil‑moisture probes relay water stress alerts to a farm management platform, growers can schedule irrigation, which cuts energy consumption while preventing yield loss. This cause‑and‑effect relationship fuels demand for cloud‑based analytics, encouraging capital to fund startups such as a European firm that combines machine‑learning algorithms with drone imagery to predict disease outbreaks weeks ahead. Consequently, the sector attracts investment, accelerates technology diffusion, and opens revenue streams through subscription services and data licensing.
How are AI and IoT improving accuracy in the crop growth monitoring market?
AI and IoT are reshaping crop growth monitoring by fusing real‑time sensor data with advanced analytics. Sensors placed in fields capture temperature, humidity, soil moisture and plant health indicators, while AI algorithms clean, integrate and interpret this stream to spot stress patterns before they become visible. The combined system reduces reliance on manual scouting, delivering precise, location‑specific insights that help farmers adjust irrigation, fertilisation and pest control. As the market expands, these technologies are becoming more affordable and interoperable, encouraging broader adoption across diverse farm sizes and regions. The result is a feedback loop where richer data fuels smarter models, which in turn drive even finer sensor deployment, accelerating the overall accuracy and value of monitoring solutions.Joint Research Centre, May 2026, introduced an AI‑driven satellite analytics platform that refines regional crop condition maps, boosting prediction accuracy and supporting faster decision‑making for growers
Market snapshot - (2026-2033)
Global Market Size
USD 4.28 Billion
Largest Segment
Hardware
Fastest Growth
Services
Growth Rate
12.6% CAGR
To get more insights on this market click here to Request a Free Sample Report
Global crop growth monitoring market is segmented by component, technology, application, farm type, end user and region. Based on component, the market is segmented into Hardware, Software and Services. Based on technology, the market is segmented into Satellite Imaging, Drones & UAVs, IoT Sensors and AI & Analytics. Based on application, the market is segmented into Crop Health Monitoring, Yield Prediction, Irrigation Management and Nutrient Monitoring. Based on farm type, the market is segmented into Open-Field Farming, Greenhouse Farming and Indoor Farming. Based on end user, the market is segmented into Farmers, Agribusinesses and Government & Research Organizations. Based on region, the market is segmented into North America, Europe, Asia Pacific, Latin America and Middle East & Africa.
Satellite Imaging segment dominates because it provides unparalleled spatial coverage and consistent temporal resolution, enabling farmers to observe field conditions over vast areas without physical presence. Its ability to deliver cloud free imagery across multiple spectral bands supports early disease detection and stress assessment, fostering trust among agronomists. Continuous data streams reinforce decision making workflows, cementing its central role in the crop growth monitoring market.
However, Drones & UAVs segment emerges as the most rapidly expanding area in the crop growth monitoring market. Their ability to capture ultra high resolution data on demand, combined with flexible flight planning, fuels adoption for precision scouting and localized analytics. This agility unlocks new revenue streams and accelerates overall market growth.
Crop Health Monitoring segment dominates because it directly tackles the most critical pain points of yield loss, pest infestation, and water stress by delivering real time insights into plant vitality. Integrated sensor networks and remote sensing fuse data to generate actionable alerts, empowering growers to intervene promptly. This immediate value creation sustains its primacy within the crop growth monitoring market.
On the other hand, Yield Prediction segment is witnessing the strongest growth momentum as advanced AI models translate multisource data into accurate output forecasts. Farmers seek to align planting decisions with market demand, driving investments in predictive analytics platforms. This surge expands the market’s analytical horizon and creates new service opportunities.
To get detailed segments analysis, Request a Free Sample Report
North America benefits from a highly integrated agricultural ecosystem that combines advanced research infrastructure, extensive farmer networks, and strong public‑private partnerships. The region’s early adoption of precision agriculture technologies creates a feedback loop of innovation and investment, reinforcing its leadership. Robust data‑driven decision support tools are widely embraced, enabling growers to optimize inputs and improve yields. Moreover, a supportive regulatory environment encourages technology deployment while fostering collaboration among universities, technology providers, and agribusinesses. These combined strengths generate a resilient market foundation that consistently outpaces other regions in technology uptake and operational efficiency.
Crop Growth Monitoring Market in the United States is propelled by a deep ecosystem of research universities, venture capital, and leading agritech firms that co‑develop sophisticated sensing and analytics platforms. Farmers across diverse climatic zones actively integrate satellite imagery, drone scouting, and IoT sensor networks to enhance field‑level decision making. Strong extension services and collaborative pilot programs further accelerate adoption, while a culture of data transparency promotes continuous improvement across the supply chain.
Crop Growth Monitoring Market in Canada leverages its vast arable lands and a commitment to sustainable farming practices. National research agencies partner with regional growers to test and refine sensor‑based solutions that address challenges such as short growing seasons and variable weather patterns. Collaborative initiatives between government, academia, and technology firms facilitate knowledge transfer, encouraging widespread deployment of precision tools that improve resource efficiency and crop resilience.
Europe’s expansion is fueled by a convergence of stringent environmental policies, strong market demand for sustainable food production, and a vibrant network of agritech innovators. Regulatory frameworks incentivize adoption of low‑impact cultivation methods, prompting growers to seek precise monitoring solutions. The region’s dense research clusters and collaborative funding programs accelerate technology development, while a culture of cross‑border cooperation spreads best practices quickly. These dynamics create a fertile environment for continuous market growth and heightened competitiveness across European agricultural sectors.
Crop Growth Monitoring Market in Germany stands as a benchmark for technological leadership, supported by world‑class research institutions and a robust industrial base. German growers integrate high‑resolution satellite data and automated ground sensors to fine‑tune nutrient management and water usage. Strong collaboration between agronomy experts and equipment manufacturers ensures that solutions are tailored to the country’s varied soil and climate conditions, bolstering overall productivity and sustainability.
Crop Growth Monitoring Market in the United Kingdom is experiencing the fastest growth due to proactive government incentives and a thriving startup ecosystem. British farmers adopt advanced analytics platforms that combine weather forecasting with real‑time field data, enabling rapid response to changing conditions. Academic partnerships and industry accelerators nurture innovative solutions, while a focus on reducing carbon footprints drives the widespread implementation of precision monitoring technologies.
Crop Growth Monitoring Market in France is emerging as a key player through strong emphasis on organic and environmentally conscious agriculture. French growers leverage drone‑based imaging and soil moisture sensors to align cultivation practices with sustainability goals. Collaborative projects between culinary institutes, agricultural cooperatives, and technology providers foster the development of region‑specific monitoring tools, supporting a transition toward more resilient and resource‑efficient farming.
Asia Pacific is solidifying its role by combining rapid technological adoption with diverse agricultural landscapes that demand tailored solutions. The region’s investment in digital infrastructure enables real‑time data acquisition across smallholder and large‑scale farms alike. Collaborative initiatives between governments, research bodies, and private innovators create ecosystems where sensor technologies, AI analytics, and mobile platforms are co‑developed to address region‑specific challenges. This synergy enhances productivity, reduces input waste, and positions Asia Pacific as a forward‑looking market for crop growth monitoring.
Crop Growth Monitoring Market in Japan benefits from a culture of meticulous precision and strong governmental support for agritech research. Japanese farms employ sophisticated sensor networks and high‑resolution aerial imaging to manage limited arable land efficiently. Partnerships between technology firms and agricultural cooperatives accelerate the rollout of integrated monitoring systems, fostering greater yield stability and resource conservation across the country’s varied terrain.
Crop Growth Monitoring Market in South Korea thrives on a vibrant tech sector and proactive policy measures that encourage digital farming. Korean growers integrate IoT‑enabled field devices with cloud‑based analytics to monitor crop health and optimize input application. Close collaboration between universities, startup incubators, and agricultural enterprises drives continuous innovation, ensuring that monitoring solutions keep pace with the nation’s ambition for high‑value, sustainable agriculture.
To know more about the market opportunities by region and country, click here to
Buy The Complete Report
Precision Satellites are Transforming Data
AI Analytics are Enhancing Forecast Accuracy
High Implementation Costs Are Deterring Adoption
Data Privacy Concerns Are Limiting Integration
Request Free Customization of this report to help us to meet your business objectives.
The competitive landscape of the global crop growth monitoring market is shaped by intensified funding activity and strategic collaborations, with major players securing large capital rounds and forming alliances to integrate advanced sensor analytics and AI-driven decision tools, driving rapid product innovation and market consolidation. Recent mega‑deals in Q2 2026 and high‑profile partnerships underscore the race to deliver real‑time field insights and scalable precision platforms.
Top Player’s Company Profile
Recent Developments
SkyQuest’s ABIRAW (Advanced Business Intelligence, Research & Analysis Wing) is our Business Information Services team that Collects, Collates, Correlates, and Analyses the Data collected by means of Primary Exploratory Research backed by robust Secondary Desk research. As per SkyQuest analysis, the global crop growth monitoring market is being propelled primarily by high‑resolution satellite imagery, which gives farmers near‑real‑time insight into canopy health and soil moisture, driving rapid adoption across large farms. A second strong catalyst is AI‑powered analytics that combine sensor data to produce accurate forecasts, further encouraging investment in digital agronomy tools. However, the high upfront cost of hardware such as drones and multispectral sensors remains a notable restraint, especially for price‑sensitive growers. North America continues to dominate the market thanks to its integrated research ecosystem and early technology uptake, while the satellite imaging segment holds the largest share, reflecting its unrivaled spatial coverage and consistency
| Report Metric | Details |
|---|---|
| Market size value in 2024 | USD 4.28 Billion |
| Market size value in 2033 | USD 12.45 Billion |
| Growth Rate | 12.6% |
| Base year | 2024 |
| Forecast period | (2026-2033) |
| Forecast Unit (Value) | USD Billion |
| Segments covered |
|
| Regions covered | North America (US, Canada), Europe (Germany, France, United Kingdom, Italy, Spain, Rest of Europe), Asia Pacific (China, India, Japan, Rest of Asia-Pacific), Latin America (Brazil, Rest of Latin America), Middle East & Africa (South Africa, GCC Countries, Rest of MEA) |
| Companies covered |
|
| Customization scope | Free report customization with purchase. Customization includes:-
|
To get a free trial access to our platform which is a one stop solution for all your data requirements for quicker decision making. This platform allows you to compare markets, competitors who are prominent in the market, and mega trends that are influencing the dynamics in the market. Also, get access to detailed SkyQuest exclusive matrix.
Table Of Content
Executive Summary
Market overview
Parent Market Analysis
Market overview
Market size
KEY MARKET INSIGHTS
COVID IMPACT
MARKET DYNAMICS & OUTLOOK
Market Size by Region
KEY COMPANY PROFILES
Methodology
For the Crop Growth Monitoring Market, our research methodology involved a mixture of primary and secondary data sources. Key steps involved in the research process are listed below:
1. Information Procurement: This stage involved the procurement of Market data or related information via primary and secondary sources. The various secondary sources used included various company websites, annual reports, trade databases, and paid databases such as Hoover's, Bloomberg Business, Factiva, and Avention. Our team did 45 primary interactions Globally which included several stakeholders such as manufacturers, customers, key opinion leaders, etc. Overall, information procurement was one of the most extensive stages in our research process.
2. Information Analysis: This step involved triangulation of data through bottom-up and top-down approaches to estimate and validate the total size and future estimate of the Crop Growth Monitoring Market.
3. Report Formulation: The final step entailed the placement of data points in appropriate Market spaces in an attempt to deduce viable conclusions.
4. Validation & Publishing: Validation is the most important step in the process. Validation & re-validation via an intricately designed process helped us finalize data points to be used for final calculations. The final Market estimates and forecasts were then aligned and sent to our panel of industry experts for validation of data. Once the validation was done the report was sent to our Quality Assurance team to ensure adherence to style guides, consistency & design.
Analyst Support
Customization Options
With the given market data, our dedicated team of analysts can offer you the following customization options are available for the Crop Growth Monitoring Market:
Product Analysis: Product matrix, which offers a detailed comparison of the product portfolio of companies.
Regional Analysis: Further analysis of the Crop Growth Monitoring Market for additional countries.
Competitive Analysis: Detailed analysis and profiling of additional Market players & comparative analysis of competitive products.
Go to Market Strategy: Find the high-growth channels to invest your marketing efforts and increase your customer base.
Innovation Mapping: Identify racial solutions and innovation, connected to deep ecosystems of innovators, start-ups, academics, and strategic partners.
Category Intelligence: Customized intelligence that is relevant to their supply Markets will enable them to make smarter sourcing decisions and improve their category management.
Public Company Transcript Analysis: To improve the investment performance by generating new alpha and making better-informed decisions.
Social Media Listening: To analyze the conversations and trends happening not just around your brand, but around your industry as a whole, and use those insights to make better Marketing decisions.
REQUEST FOR SAMPLE
 REQUEST FREE CUSTOMIZATION


Want to customize this report? This report can be personalized according to your needs. Our analysts and industry experts will work directly with you to understand your requirements and provide you with customized data in a short amount of time. We offer $1000 worth of FREE customization at the time of purchase.
Feedback From Our Clients


 USA (+1) 351-333-4748

