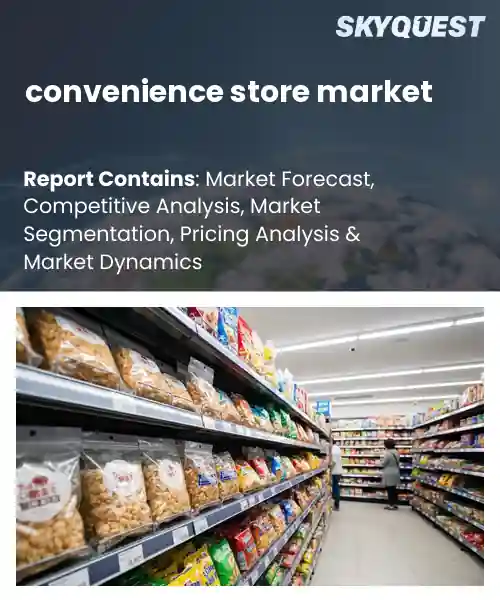
convenience store market
Report ID: SQMIG30C2213
Report ID: SQMIG30C2213
[email protected]
USA +1 351-333-4748
Report ID:
SQMIG30C2213 |
Region:
Global |
Published Date: July, 2026
Pages:
157
|Tables:
181
|Figures:
79


Global Convenience Store Market size was valued at USD 1.95 Trillion in 2024 and is poised to grow from USD 2.06 Trillion in 2025 to USD 3.16 Trillion by 2033, growing at a CAGR of 5.5% during the forecast period (2026-2033).
Digital integration drives phase of the convenience‑store market because it links consumer data with inventory, allowing stores to forecast demand and tailor promotions. Evidence emerges in the adoption of self‑checkout and AI shelf sensors by chains like 7‑Eleven and FamilyMart, which have cut labor expenses and lifted basket size by roughly 12 percent. The cause enhanced visibility produces faster replenishment, fewer stock‑outs, and a wider selection of ready‑to‑eat items that satisfy expectations. As a result, investors see formats as gateways to revenue such as ads, mobile ordering, and subscription meal kits, creating a growth loop that expands the market beyond conventional retail.
How is AI-driven automation reshaping inventory management in the convenience store market?
AI‑driven automation is redefining inventory management by turning raw sales data into real‑time stocking decisions. Machine‑learning models analyze point‑of‑sale trends, weather patterns and local events to predict demand with far greater accuracy than traditional methods. Connected shelf sensors and smart shelves relay stock levels instantly, triggering automated reorder alerts that keep shelves full while trimming excess. Robots and autonomous carts handle routine shelf‑restocking, freeing staff to focus on customer service and merchandising. The result is fewer stockouts, fresher product assortments and a smoother flow of goods that matches the fast‑paced nature of convenience retail.Kroger introduced its AI‑powered inventory platform in March 2024, automating replenishment across its convenience outlets and delivering faster, more precise stock turns that reinforce market efficiency.
Market snapshot - (2026-2033)
Global Market Size
USD 1.95 Trillion
Largest Segment
Traditional Convenience Stores
Fastest Growth
Smart/Automated Convenience Stores
Growth Rate
5.5% CAGR
To get more insights on this market click here to Request a Free Sample Report
Global convenience store market is segmented by store type, product category, ownership model, application, location type, store format and region. Based on store type, the market is segmented into Traditional Convenience Stores, Forecourt Convenience Stores, Urban Convenience Stores, Neighborhood Convenience Stores and Smart/Automated Convenience Stores. Based on product category, the market is segmented into Food & Beverages, Tobacco Products, Alcoholic Beverages, Personal Care Products, Household Essentials, OTC Healthcare Products and Others. Based on ownership model, the market is segmented into Company-owned Stores, Franchise Stores and Independent Stores. Based on application, the market is segmented into Daily Essentials Shopping, Ready-to-eat Food Purchases, Fuel-linked Retailing, Quick-service Retail, Parcel & Financial Services and Others. Based on location type, the market is segmented into Urban, Suburban, Rural and Highway & Transit Locations. Based on store format, the market is segmented into Physical Stores, Omnichannel Stores and Smart & Autonomous Stores. Based on region, the market is segmented into North America, Europe, Asia Pacific, Latin America and Middle East & Africa.
Urban Convenience Stores segment dominates because they align perfectly with dense consumer populations seeking quick, everyday purchases. Their proximity to residential and commercial hubs drives frequent visits, while extended operating hours cater to varied schedules. The model benefits from low inventory complexity and strong impulse buying, reinforcing their central role in the convenience retail ecosystem. Additionally, their ability to integrate local product assortments enhances relevance and loyalty among shoppers.
However, Smart/Automated Convenience Stores are witnessing the strongest growth momentum as retailers adopt advanced vending and AI driven inventory systems. Contactless purchasing and data analytics attract tech savvy consumers, while reduced labor costs enable rapid rollout in high traffic zones. This innovation fuels new revenue streams and expands the overall market footprint.
Food & Beverages segment leads because it satisfies the core demand for quick meals and snacks that define convenience shopping. High turnover rates, strong brand loyalty, and the ability to cross sell with complementary items drive consistent footfall. The category benefits from frequent replenishment cycles, seasonal promotions, and the emotional appeal of indulgent treats, cementing its pivotal position in store profitability. Moreover, its adaptability to health trends and ready to eat formats sustains relevance across diverse consumer preferences.
Meanwhile, OTC Healthcare Products are emerging as the key high growth area as consumers increasingly seek convenient health solutions within everyday shopping trips. Shelf stable formulations and expanding wellness awareness drive demand, while retailers leverage cross promotion with food items to boost basket size. This trend opens new profit avenues and deepens store relevance in health focused purchasing.
To get detailed segments analysis, Request a Free Sample Report
Asia Pacific dominates the global convenience store market because the region combines exceptionally high urban density with a cultural affinity for quick, ready‑to‑eat options. Retail operators benefit from sophisticated supply‑chain infrastructures that enable frequent product turnover and a broad assortment of locally tailored snacks, beverages, and services. Consumer lifestyles that emphasize convenience, together with mature franchise models, have created a competitive environment that drives continual format innovation. Technological integration such as mobile payments and data‑driven inventory management further reinforces efficiency and customer engagement. In addition, supportive regulatory frameworks encourage long operating hours and diversified service offerings, allowing convenience stores to function as community hubs beyond traditional retail. These synergistic factors solidify Asia Pacific’s leadership in shaping global convenience retail trends.
convenience store market in Japan is characterized by an intensive focus on product freshness and convenience‑oriented services such as bill payment and ticketing. Brands emphasize compact store formats that fit densely populated neighborhoods, while leveraging sophisticated logistics to maintain high turnover of ready‑made meals and seasonal snacks. The strong emphasis on customer service and innovative seasonal merchandising keeps the Japanese sector at the forefront of retail agility.
convenience store market in South Korea thrives on a blend of high‑tech integration and diverse service offerings, ranging from parcel lockers to in‑store cafés. Stores capitalize on a culture that values quick access to quality food and digital payment solutions, fostering a seamless shopping experience. Aggressive expansion of store footprints in both metropolitan and suburban areas, combined with a keen focus on localized product assortments, reinforces the sector’s dynamic growth.
The rapid expansion of the convenience store market in North America is propelled by shifting consumer expectations toward one‑stop, time‑saving shopping experiences. Retailers respond to growing demand for ready‑made meals, health‑focused snack options, and on‑the‑go services such as fuel, financial transactions, and digital order pickup. Urban sprawl and suburban development create ample real estate opportunities for new formats, while advances in data analytics enable precise inventory control and personalized promotions. Partnerships with technology platforms and delivery services extend reach beyond the physical footprint, attracting a broader customer base. Moreover, an emphasis on sustainability and community‑centric initiatives enhances brand relevance, encouraging frequent visits and fostering loyalty across diverse demographic groups.
convenience store market in United States is shaped by a strong emphasis on extensive product variety and integrated fuel services that attract motorists and urban shoppers alike. Operators adopt advanced merchandising strategies, including curated snack selections and grab‑and‑go meal solutions, to meet fast‑paced lifestyles. The incorporation of digital loyalty programs and contactless payment options further elevates the shopping experience, while strategic placement near high‑traffic corridors supports steady footfall and brand visibility.
convenience store market in Canada reflects a balanced approach that blends traditional retail with growing demand for locally sourced foods and ethical product lines. Stores prioritize convenience amenities such as bill payment, courier drop‑off, and seasonal merchandise that resonate with regional consumer preferences. Embracing contactless payment technologies and loyalty incentives helps capture a tech‑savvy shopper base, while expansion into suburban neighbourhoods reinforces accessibility and supports sustained market growth.
Europe is strengthening its position in the convenience store market by aligning retail offerings with evolving consumer priorities around quality, sustainability, and experiential shopping. Operators invest in compact store designs that integrate premium fresh‑food counters, eco‑friendly packaging, and multifunctional services such as parcel collection and community events. A focus on regional product sourcing and artisanal snack selections appeals to local taste preferences, while digital platforms enable seamless ordering and loyalty integration across borders. Collaborative initiatives with policymakers support longer operating hours and flexible zoning, facilitating store proliferation in both city centres and suburban districts. These strategic adaptations enhance the European sector’s ability to attract diverse shopper segments and reinforce its relevance within the broader retail ecosystem.
convenience store market in Germany emphasizes high standards of product quality and a strong orientation toward sustainable practices. Retail formats often feature extensive fresh‑food sections, including bakery items and locally sourced produce, catering to health‑conscious consumers. Integration of digital payment solutions and loyalty programs streamlines the purchase process, while emphasis on energy‑efficient store operations aligns with environmental expectations. Strategic placement in commuter hubs and residential districts ensures convenient access for a broad customer base.
convenience store market in United Kingdom focuses on delivering a blend of traditional quick‑shop items and emerging lifestyle services such as coffee bars and click‑and‑collect points. Operators adapt store layouts to accommodate compact urban spaces, offering a curated selection of premium snacks, prepared meals, and locally relevant products. The adoption of contactless payment and mobile loyalty apps enhances shopper engagement, while partnerships with delivery platforms extend reach into the home‑service sphere, reinforcing the sector’s relevance in a fast‑moving market.
convenience store market in France integrates a strong culinary heritage with modern convenience, offering a range of freshly prepared sandwiches, pastries, and regionally inspired beverages. Stores prioritize high‑touch customer service and often include café‑style seating to encourage dwell time. Digital innovations such as QR‑based promotions and seamless payment options support a frictionless experience. Expansion into suburban neighbourhoods and integration with local producers underscore a commitment to both accessibility and authentic French flavours.
To know more about the market opportunities by region and country, click here to
Buy The Complete Report
Growing Urban Population
Digital Payment Adoption
Regulatory Compliance Burdens
Intense Competitive Landscape
Request Free Customization of this report to help us to meet your business objectives.
SwiftSku’s acquisition of a regional POS vendor and 7‑Eleven’s partnership with a mobile‑payment startup illustrate how M&A and strategic alliances are reshaping convenience‑store competition, while AI‑driven inventory platforms and real‑time analytics are becoming decisive differentiators for operators seeking efficiency and customer insight.
Top Player’s Company Profile
Recent Developments
SkyQuest’s ABIRAW (Advanced Business Intelligence, Research & Analysis Wing) is our Business Information Services team that Collects, Collates, Correlates, and Analyses the Data collected by means of Primary Exploratory Research backed by robust Secondary Desk research. As per SkyQuest analysis the global convenience‑store market is expected to expand at a 5.5 % CAGR through 2033, propelled primarily by a growing urban population that fuels constant foot traffic and by rapid digital‑payment adoption which streamlines checkout and encourages impulse buying. The Asia‑Pacific region leads the market, driven by dense cities and strong franchise networks, while urban convenience stores emerge as the dominant store type because of their proximity to residential and commercial hubs. However, stringent regulatory compliance requirements pose a notable restraint, adding operational costs and limiting product flexibility. Together these forces shape a dynamic growth trajectory for the sector.
| Report Metric | Details |
|---|---|
| Market size value in 2024 | USD 1.95 Trillion |
| Market size value in 2033 | USD 3.16 Trillion |
| Growth Rate | 5.5% |
| Base year | 2024 |
| Forecast period | (2026-2033) |
| Forecast Unit (Value) | USD Trillion |
| Segments covered |
|
| Regions covered | North America (US, Canada), Europe (Germany, France, United Kingdom, Italy, Spain, Rest of Europe), Asia Pacific (China, India, Japan, Rest of Asia-Pacific), Latin America (Brazil, Rest of Latin America), Middle East & Africa (South Africa, GCC Countries, Rest of MEA) |
| Companies covered |
|
| Customization scope | Free report customization with purchase. Customization includes:-
|
To get a free trial access to our platform which is a one stop solution for all your data requirements for quicker decision making. This platform allows you to compare markets, competitors who are prominent in the market, and mega trends that are influencing the dynamics in the market. Also, get access to detailed SkyQuest exclusive matrix.
Table Of Content
Executive Summary
Market overview
Parent Market Analysis
Market overview
Market size
KEY MARKET INSIGHTS
COVID IMPACT
MARKET DYNAMICS & OUTLOOK
Market Size by Region
KEY COMPANY PROFILES
Methodology
For the convenience store market, our research methodology involved a mixture of primary and secondary data sources. Key steps involved in the research process are listed below:
1. Information Procurement: This stage involved the procurement of Market data or related information via primary and secondary sources. The various secondary sources used included various company websites, annual reports, trade databases, and paid databases such as Hoover's, Bloomberg Business, Factiva, and Avention. Our team did 45 primary interactions Globally which included several stakeholders such as manufacturers, customers, key opinion leaders, etc. Overall, information procurement was one of the most extensive stages in our research process.
2. Information Analysis: This step involved triangulation of data through bottom-up and top-down approaches to estimate and validate the total size and future estimate of the convenience store market.
3. Report Formulation: The final step entailed the placement of data points in appropriate Market spaces in an attempt to deduce viable conclusions.
4. Validation & Publishing: Validation is the most important step in the process. Validation & re-validation via an intricately designed process helped us finalize data points to be used for final calculations. The final Market estimates and forecasts were then aligned and sent to our panel of industry experts for validation of data. Once the validation was done the report was sent to our Quality Assurance team to ensure adherence to style guides, consistency & design.
Analyst Support
Customization Options
With the given market data, our dedicated team of analysts can offer you the following customization options are available for the convenience store market:
Product Analysis: Product matrix, which offers a detailed comparison of the product portfolio of companies.
Regional Analysis: Further analysis of the convenience store market for additional countries.
Competitive Analysis: Detailed analysis and profiling of additional Market players & comparative analysis of competitive products.
Go to Market Strategy: Find the high-growth channels to invest your marketing efforts and increase your customer base.
Innovation Mapping: Identify racial solutions and innovation, connected to deep ecosystems of innovators, start-ups, academics, and strategic partners.
Category Intelligence: Customized intelligence that is relevant to their supply Markets will enable them to make smarter sourcing decisions and improve their category management.
Public Company Transcript Analysis: To improve the investment performance by generating new alpha and making better-informed decisions.
Social Media Listening: To analyze the conversations and trends happening not just around your brand, but around your industry as a whole, and use those insights to make better Marketing decisions.
REQUEST FOR SAMPLE
 REQUEST FREE CUSTOMIZATION


Want to customize this report? This report can be personalized according to your needs. Our analysts and industry experts will work directly with you to understand your requirements and provide you with customized data in a short amount of time. We offer $1000 worth of FREE customization at the time of purchase.
Feedback From Our Clients


 USA (+1) 351-333-4748

