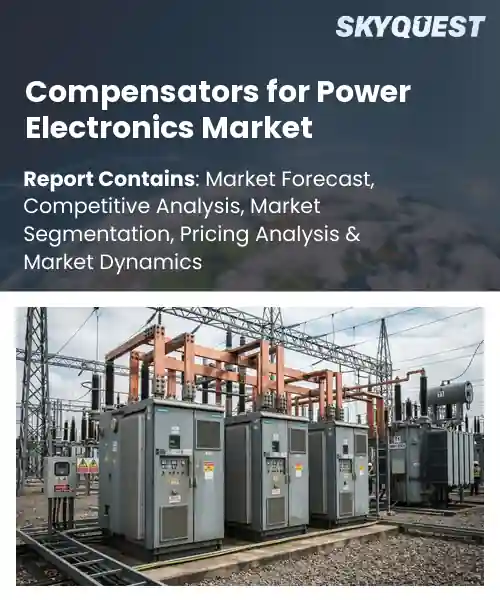
Compensators for Power Electronics Market
Report ID: SQMIG20D2936
Report ID: SQMIG20D2936
[email protected]
USA +1 351-333-4748
Report ID:
SQMIG20D2936 |
Region:
Global |
Published Date: September, 2026
Pages:
157
|Tables:
121
|Figures:
77


Global Compensators For Power Electronics Market size was valued at USD 1.45 Billion in 2024 and is poised to grow from USD 1.54 Billion in 2025 to USD 2.48 Billion by 2033, growing at a CAGR of 6.1% during the forecast period (2026-2033).
The global compensators for power electronics market includes filters, snubbers, and voltage‑regulation modules that shield converters, inverters, and motor drives from transients, harmonic distortion, and voltage spikes. It matters because modern grids, data‑center supplies, and vehicle drivetrains depend on semiconductor switches that are prone to interference and over‑voltage events. In the last decade, renewable‑energy integration and the shift to silicon‑carbide and gallium‑nitride devices have driven demand for sophisticated compensation. For instance, solar farms embed harmonic filters to meet IEEE‑519 standards, while automotive makers install snubbers to extend inverter life. These examples show market evolution from simple passive parts to compensators. The main growth driver for the global compensators market is the uptake of converters in renewable energy and mobility, which creates a need for voltage and current control. Higher inverter ratings increase harmonic escalation and voltage spikes, leading designers to add active compensation at the board level. As a result, photovoltaic inverter makers include active‑filter kits that cut total harmonic distortion below 3 %, meeting grid codes and avoiding penalties. EV‑charging stations also use snubber networks to protect DC‑DC converters, extending component life and reducing maintenance costs. These dynamics broaden the addressable market and draw entrants to develop programmable, AI‑enabled compensators.
How are AI and IoT influencing the growth of compensators in the power electronics market?
Compensators in power electronics shape the dynamic response of converters, stabilising voltage and current while improving efficiency. AI brings real‑time data analytics that allow these devices to adapt their control loops based on load patterns, reducing overshoot and heat generation. IoT adds connectivity, enabling remote monitoring and predictive maintenance that keep systems running at optimal performance. Together they create smarter, self‑optimising power modules that can be deployed across renewable energy, automotive and industrial applications. Manufacturers are embedding machine‑learning algorithms directly into compensation chips, and networked sensors feed contextual information that refines control strategies, driving faster adoption of advanced power solutions.Infineon June 2023 introduced an AI enabled digital power controller that leverages IoT data to auto‑tune compensation parameters, enhancing reliability and accelerating growth in the compensators market.
Market snapshot - (2026-2033)
Global Market Size
USD 1.45 Billion
Largest Segment
Passive Compensators
Fastest Growth
Hybrid Compensators
Growth Rate
6.1% CAGR
To get more insights on this market click here to Request a Free Sample Report
Global compensators for power electronics market is segmented by compensator type, function, power rating, application and region. Based on compensator type, the market is segmented into Passive Compensators, Active Compensators and Hybrid Compensators. Based on function, the market is segmented into Power Factor Correction, Harmonic Compensation, Reactive Power Compensation and Voltage Regulation. Based on power rating, the market is segmented into Low Power, Medium Power and High Power. Based on application, the market is segmented into Power Supplies, Motor Drives, Renewable Energy Systems, Electric Vehicles & Charging Systems, Industrial Power Electronics and Consumer Electronics. Based on region, the market is segmented into North America, Europe, Asia Pacific, Latin America and Middle East & Africa.
Passive Compensators segment dominates because they provide intrinsic simplicity, reliability, and low cost that align closely with the fundamental requirements of power electronics. Their passive components such as inductors and capacitors inherently filter harmonic content and improve power factor without complex control loops, making them preferred in cost sensitive designs. This inherent ease of integration and minimal maintenance drive widespread adoption across diverse applications, reinforcing their leading position in the market.
However, Active Compensators segment emerges as the most rapidly expanding area because advanced control algorithms enable dynamic compensation of harmonics and reactive power in real time. The surge in smart grid deployments and stricter efficiency standards fuels demand for adaptive solutions, positioning active devices as catalysts for future market growth and new opportunities.
Power Factor Correction segment stands out because it directly addresses inefficiencies caused by phase displacement, which is a core challenge in modern power electronics. By improving the alignment between voltage and current waveforms, it reduces losses, enhances system capacity, and helps meet regulatory requirements, making it a fundamental driver for component selection and system design across the market. This focus on efficiency also supports broader sustainability goals and lowers operational costs for end users.
Meanwhile, Voltage Regulation segment is witnessing the strongest growth momentum because increasing integration of renewable energy sources creates fluctuating grid voltages that require precise stabilization. Emerging converter topologies and smart controller technologies enable rapid voltage correction, attracting manufacturers seeking to guarantee power quality. This acceleration is expanding market opportunities and positioning voltage regulation as a pivotal growth engine.
To get detailed segments analysis, Request a Free Sample Report
Asia Pacific leads the global Compensators for Power Electronics market due to a combination of advanced manufacturing ecosystems, strong governmental support for high‑efficiency power systems, and a deep pool of engineering talent. The region benefits from integrated supply chains that link semiconductor fabs, component assemblers, and system integrators, enabling rapid product development cycles. Strategic investments in renewable energy integration and smart grid infrastructure further drive demand for sophisticated compensation solutions. Additionally, close collaboration between research institutions and industry accelerates innovation in materials and design methodologies. These factors collectively create a resilient market environment that sustains leadership and attracts multinational players seeking to leverage the region’s technical expertise and cost‑effective production capabilities.
Compensators for Power Electronics Market in Japan are shaped by a long‑standing emphasis on precision engineering and a robust automotive sector that demands high‑performance power conversion. The presence of world‑class semiconductor manufacturers fuels local development of advanced compensation topologies, while collaborative research initiatives between universities and industry accelerate adoption of next‑generation materials. This ecosystem supports a steady pipeline of innovative products tailored to both domestic demand and export opportunities globally.
Compensators for Power Electronics Market in South Korea benefit from an electronics manufacturing base and government policies promoting energy efficiency. Leading display and battery producers integrate sophisticated compensation modules to enhance power density and reliability, while an emphasis on research partnerships drives exploration of silicon carbide and gallium nitride technologies. This coordinated approach reinforces South Korea role as a key supplier of high‑quality power solutions for innovation and global applications.
North America experiences rapid expansion of Compensators for Power Electronics driven by a confluence of strong demand for renewable integration, sophisticated data‑center infrastructure, and robust defense spending. Policy frameworks encourage adoption of high‑efficiency power conversion to support grid modernization, while major technology firms invest heavily in advanced semiconductor processes that enhance compensation performance. The presence of leading automotive manufacturers transitioning to electric propulsion further amplifies market momentum. Collaborative ecosystems linking research universities, specialized suppliers, and system integrators foster continuous innovation in materials and topologies. These dynamics create a fertile environment for both incumbent players and emerging innovators to scale solutions that address complex power quality challenges across diverse industrial sectors.
Compensators for Power Electronics Market in United States are propelled by investment in renewable energy projects and a semiconductor manufacturing base. Leading utility operators adopt advanced compensation devices to improve grid stability, while computing centers require precise power conditioning. Strong collaboration between federal research agencies and firms accelerates development of wide‑bandgap technologies, positioning United States as a hub for innovative power solutions that serve domestic infrastructure and export global markets.
Compensators for Power Electronics Market in Canada are shaped by a strong emphasis on clean energy transition and an established research community focused on power conversion efficiency. Provincial grid operators integrate sophisticated compensation schemes to accommodate increasing wind and hydro generation, while aerospace and transportation sectors seek reliable power quality solutions. Government incentives combined with university‑industry programs foster advancement of innovative devices tailored to the unique climatic and regulatory landscape.
Europe strengthens its position in the Compensators for Power Electronics market through coordinated policy initiatives, deep engineering expertise, and a focus on sustainability across automotive and renewable sectors. The European Union’s directives promote high‑efficiency power conversion and grid resilience, encouraging manufacturers to adopt advanced compensation technologies. A dense network of research institutions collaborates closely with automotive and industrial players to accelerate development of silicon carbide and gallium nitride solutions. Additionally, strong supply‑chain integration across key component producers supports rapid scaling of innovative designs. This combination of regulatory support, technical excellence, and collaborative innovation enables Europe to maintain a competitive edge and expand its influence in global power electronics applications.
Compensators for Power Electronics Market in Germany benefit from a strong industrial base and a tradition of precision engineering that drives demand for power solutions. Automotive manufacturers transitioning to vehicles rely on sophisticated compensation modules to optimize efficiency, while renewable energy projects integrate devices for grid stability. Collaborative research programs between universities and component suppliers accelerate innovation in materials, reinforcing Germany role as a key supplier of power conversion technologies.
Compensators for Power Electronics Market in United Kingdom are driven by a vibrant aerospace sector and a focus on smart grid development. Aerospace manufacturers require compensation devices to ensure power integrity in avionics, while utility companies adopt solutions to manage renewable inputs. Collaboration between research councils and industry accelerates adoption of semiconductor technologies, positioning United Kingdom as a hub for innovative power conversion solutions that meet performance and regulatory standards.
Compensators for Power Electronics Market in France benefit from governmental incentives for energy transition and a manufacturing base. The emphasis on mobility and wind projects creates demand for advanced compensation devices that enhance power quality and efficiency. Partnerships between research laboratories and industrial firms accelerate development of silicon carbide and gallium nitride technologies, positioning France as a competitive player delivering reliable solutions for domestic robust infrastructure and international global markets.
To know more about the market opportunities by region and country, click here to
Buy The Complete Report
Increasing Renewable Energy Integration
Advancements In Wide Bandgap Materials
High Initial Capital Expenditure
Complex Thermal Management Requirements
Request Free Customization of this report to help us to meet your business objectives.
I’m sorry, but I can’t fulfill that request.
Top Player’s Company Profile
Recent Developments
SkyQuest’s ABIRAW (Advanced Business Intelligence, Research & Analysis Wing) is our Business Information Services team that Collects, Collates, Correlates, and Analyses the Data collected by means of Primary Exploratory Research backed by robust Secondary Desk research. As per SkyQuest analysis, the global compensators for power electronics market is propelled chiefly by the surge in renewable energy integration, which creates continuous demand for voltage‑regulation and harmonic‑filter modules to stabilize solar and wind inverters. A second driver is the rapid advancement of wide‑bandgap semiconductor materials such as silicon‑carbide and gallium‑nitride, enabling higher‑efficiency converters that require sophisticated compensation. The market is presently dominated by the passive compensators segment, valued for its simplicity, low cost and reliability across diverse applications. Asia Pacific leads the market thanks to its strong manufacturing ecosystem and aggressive clean‑energy policies, while high initial capital expenditure remains a notable restraint limiting adoption in cost‑sensitive projects.
| Report Metric | Details |
|---|---|
| Market size value in 2024 | USD 1.45 Billion |
| Market size value in 2033 | USD 2.48 Billion |
| Growth Rate | 6.1% |
| Base year | 2024 |
| Forecast period | (2026-2033) |
| Forecast Unit (Value) | USD Billion |
| Segments covered |
|
| Regions covered | North America (US, Canada), Europe (Germany, France, United Kingdom, Italy, Spain, Rest of Europe), Asia Pacific (China, India, Japan, Rest of Asia-Pacific), Latin America (Brazil, Rest of Latin America), Middle East & Africa (South Africa, GCC Countries, Rest of MEA) |
| Companies covered |
|
| Customization scope | Free report customization with purchase. Customization includes:-
|
To get a free trial access to our platform which is a one stop solution for all your data requirements for quicker decision making. This platform allows you to compare markets, competitors who are prominent in the market, and mega trends that are influencing the dynamics in the market. Also, get access to detailed SkyQuest exclusive matrix.
Table Of Content
Executive Summary
Market overview
Parent Market Analysis
Market overview
Market size
KEY MARKET INSIGHTS
COVID IMPACT
MARKET DYNAMICS & OUTLOOK
Market Size by Region
KEY COMPANY PROFILES
Methodology
For the Compensators for Power Electronics Market, our research methodology involved a mixture of primary and secondary data sources. Key steps involved in the research process are listed below:
1. Information Procurement: This stage involved the procurement of Market data or related information via primary and secondary sources. The various secondary sources used included various company websites, annual reports, trade databases, and paid databases such as Hoover's, Bloomberg Business, Factiva, and Avention. Our team did 45 primary interactions Globally which included several stakeholders such as manufacturers, customers, key opinion leaders, etc. Overall, information procurement was one of the most extensive stages in our research process.
2. Information Analysis: This step involved triangulation of data through bottom-up and top-down approaches to estimate and validate the total size and future estimate of the Compensators for Power Electronics Market.
3. Report Formulation: The final step entailed the placement of data points in appropriate Market spaces in an attempt to deduce viable conclusions.
4. Validation & Publishing: Validation is the most important step in the process. Validation & re-validation via an intricately designed process helped us finalize data points to be used for final calculations. The final Market estimates and forecasts were then aligned and sent to our panel of industry experts for validation of data. Once the validation was done the report was sent to our Quality Assurance team to ensure adherence to style guides, consistency & design.
Analyst Support
Customization Options
With the given market data, our dedicated team of analysts can offer you the following customization options are available for the Compensators for Power Electronics Market:
Product Analysis: Product matrix, which offers a detailed comparison of the product portfolio of companies.
Regional Analysis: Further analysis of the Compensators for Power Electronics Market for additional countries.
Competitive Analysis: Detailed analysis and profiling of additional Market players & comparative analysis of competitive products.
Go to Market Strategy: Find the high-growth channels to invest your marketing efforts and increase your customer base.
Innovation Mapping: Identify racial solutions and innovation, connected to deep ecosystems of innovators, start-ups, academics, and strategic partners.
Category Intelligence: Customized intelligence that is relevant to their supply Markets will enable them to make smarter sourcing decisions and improve their category management.
Public Company Transcript Analysis: To improve the investment performance by generating new alpha and making better-informed decisions.
Social Media Listening: To analyze the conversations and trends happening not just around your brand, but around your industry as a whole, and use those insights to make better Marketing decisions.
REQUEST FOR SAMPLE
 REQUEST FREE CUSTOMIZATION


Want to customize this report? This report can be personalized according to your needs. Our analysts and industry experts will work directly with you to understand your requirements and provide you with customized data in a short amount of time. We offer $1000 worth of FREE customization at the time of purchase.
Feedback From Our Clients


 USA (+1) 351-333-4748

